D I A B E T E S & M E T A B O L I S M J O U R N A L D I A B E T E S & M E T A B O L I S M J O U R N A L
This is an Open Access article distributed under the terms of the Creative Commons Attribution Non-Commercial License (http://creativecommons.org/licenses/by-nc/4.0/) which permits unrestricted non-commercial use, distribution, and reproduction in any medium, provided the original work is properly cited.
The Effect of 12 Weeks Aerobic, Resistance, and
Combined Exercises on Omentin-1 Levels and Insulin Resistance among Type 2 Diabetic Middle-Aged
Women
Zeinab AminiLari1, Mohammad Fararouei2, Sasan Amanat3, Ehsan Sinaei4, Safa Dianatinasab3, Mahmood AminiLari1, Nima Daneshi5, Mostafa Dianatinasab2,5
1Department of Clinical Epidemiology and Biostatistics, McMaster University, Hamilton, ON, Canada,
2Shiraz HIV/AIDS Research Center, Institute of Health, Shiraz University of Medical Sciences, Shiraz,
3Department of Nutrition, Shiraz University of Medical Sciences School of Nutrition and Food Sciences, Shiraz,
4Department of Physical Therapy, Shiraz University of Medical Sciences School of Rehabilitation Sciences, Shiraz,
5Department of Epidemiology, Student Research Committee, Shiraz University of Medical Sciences School of Health, Shiraz, Iran
Background: Recent studies have shown that omentin-1 derived from adipokines can affect physiological regulations and some metabolic dis-eases such as type 2 diabetes mellitus (T2DM).
Methods: The purpose of this study was to examine the impact of 12 weeks of aerobic (cycle ergometer), resistance, and com- bined exercises on omentin-1 level, glucose and insulin resistance indices in overweight middle age women with T2DM. In this study, 60 overweight middle age diabetic women were selected using simple random sampling and they were assigned to three groups of aerobic exercise (n=12), resistant exercise (n=12) and combined exercise (n=13), and one control group (n=15). Exer- cises were done in a three times per week sessions for a total of 12 weeks. Blood samples were collected before each exercise ses- sion and 24 hours after of the last session.
Results: Present study showed that fasting blood sugar decreased significantly in all intervention groups, while homeostasis mod- el assessment of insulin resistance (HOMA-IR) decreased only in the aerobic and combined exercises groups. Furthermore, there was a significant increase in the omentin-1 level only in the combined exercise group.
Conclusion: Compared to aerobic and resistance exercises, 12 weeks of combined exercise was more efficient in improving HOMA-IR and increasing serum omentin-1 among women with T2DM.
Keywords: Diabetes mellitus, type 2; Exercise; Glucose; Insulin resistance; Omentin-1; Overweight women
Corresponding authors: Mostafa Dianatinasab https://orcid.org/0000-0002-0185-5807
Shiraz HIV/AIDS Research Center, Institute of Health, Shiraz University of Medical Sciences, Shiraz, Iran
E-mail: [email protected]
Mohammad Fararouei https://orcid.org/0000-0001-9362-328X
Shiraz HIV/AIDS Research Center, Institute of Health, Shiraz University of Medical Sciences, Shiraz, Iran
INTRODUCTION
Nowadays, obesity, especially abdominal obesity, as well as in- crease in body fat layers are considered as one of the main
problems globally [1]. A wide range of behavioral, genetic, bio- logical, and environmental factors can lead to obesity [2]. Obe- sity is strongly associated with chronic cardiovascular disor- ders and type 2 diabetes mellitus (T2DM) during the middle- https://doi.org/10.4093/dmj.2017.41.3.205
pISSN 2233-6079 · eISSN 2233-6087
age and the old age [1]. Even though people with obesity, T2DM or metabolic syndromes may encounter variety of problems while doing exercises, but they are often advised to do exercise as a non-pharmacological treatment for losing weight [3]. A previous research has shown that a decrease in peripheral insulin resistance during exercise leads to increase in peripheral glucose uptake, while liver glucose production remains the same. A significant insulin resistance in muscle has been reported in T2DM [4]. In patients with this condi- tion, an increase in glucose absorption which takes place dur- ing exercising shows that insulin resistance does not necessari- ly lead to prevention of blood glucose absorption in cells. Insu- lin resistance decreases the capability of insulin to stimulate the absorption and to save up glucose, as well as to decrease the glucose production by the liver [4].
Recently, it was discovered that the adipose tissue is an active endocrine tissue which secretes a large amount of active inter- mediates such as adipokine, which plays a significant role in energy homeostasis, in addition to, regulating the blood pres- sure, glucose and fat metabolisms [5-7]. Omentin-1, a recent- ly-recognized adipokine which is expressed in the visceral adi- pose tissue, is synthesized and secreted within the adipose tis- sue vessels stem cells. The omentin-1 can play a role to increas- es glucose transfer in the adipose tissue carried out by insulin.
Omentin-1 might play either a paracrine or an endocrine role in regulating the insulin sensitivity. Furthermore, omentin-1 is involved in regulating energy metabolism and distribution of body fat. Some scientists have suggested that, serum omen- tin-1 level decreases with obesity and insulin resistance. In fact, obesity and insulin resistance associated with this decreases, can reduce gene expression [8-10]. Furthermore, a decrease in omentin-1 serum level can contribute to insulin resistance [9].
Indeed, insulin resistances which results from obesity can re- duce omentin-1 gene expression [10].
Diabetes has been associated with a reduction in the omen- tin-1 level. Gursoy et al. [11], demonstrated that omentin-1 levels were considerably lower in those with T2DM in com- parison with a healthy control group. They showed that insulin resistance greatly reduced omentin-1 levels. At the same time, Pan et al. [12], indicated that omentin-1 level increased after weight loss.
Another study has suggested that serum omentin-1 level was lower in patients with impaired glucose regulation and those with T2DM in comparison with normal glucose level partici- pants [12]. It was further shown that omentin-1 level had a neg-
ative correlation with body mass index (BMI), fasting insulin, homeostasis model assessment of insulin resistance (HOMA- IR), and plasma glucose [13].
In addition, physical activities have been suggested to play a role in controlling the omentin-1 level. For instance, Saremi et al. [14], investigated the effects of 12 weeks of aerobic exercise (AE; five sessions per week) on 18 obese men. The results showed an increase in cytokine/adipokine level, as well as a de- crease in insulin resistance [14].
With regard to our knowledge about the effect of physical activity, this study was conducted in order to distinguish be- tween the effects of aerobic, resistant exercise (RE) and com- bined exercise (CE) on the plasma omentin-1, HOMA-IR and body composition in middle age overweight diabetic women.
The primary hypothesis of the study was significant differences in the change of HOMA-IR from the baseline to the end of three interventions and the control group. The secondary hy- pothesis was a significant change in plasma omentin-1.
METHODS
This randomized controlled trial study was conducted from February to April 2013 (approval state of IR.SUMS.REC.
1395.192). The study population comprised of women with T2DM (using simple random sampling) who were visiting public clinic (Emam Reza Clinic) running by Shiraz University of Medical Sciences.
The inclusion criteria were: having been suffering from T2DM (fasting blood sugar ≥126 mg/dL and 2-hour post- prandial blood glucose ≥200 mg/dL) [15] for at least 2 years, being female, aged 45 to 60 years, not being diagnosed with any other diseases, patients were contacted by a phone call and were invited to participate into the study. During the phone call, after a brief explanation of the aims and protocol of the study, those interested were invited for the first visit during which they became fully aware of the study protocol and inter- ventions.
All volunteers were examined by a general physician to as- sure that the intervention would not endanger patients. All participants gave their written informed consent. Group as- signment: patients were divided into four groups each consist- ing of 15 participants. A group (control group) received no in- tervention and three groups underwent ‘AEs,’ ‘REs,’ group, and
‘CEs’ groups.
For those in AE group, each exercise session consisted of
three phases of warm up, the main stage and a cool-down peri- od. The warm-up phase comprised of 20 minutes of stretching and jogging. The main phase of the study was consisted of 25 minutes exercise in order to achieve 50% to 55% of maximum heart rate as measured by cycle ergometer. Running, exercise and stretching made up the cooling-down phase.
Each phase in the RE group had three sessions per week which consisted of three phases of warm-up, the main, and cooling-down. The warm-up involved 20 minutes of stretching exercises and jogging on the spot. The main phase consisted of three sets×eight repetitions of weight training including leg extension, prone leg curl, abdominal crunch, biceps, triceps, and seated calf. The exercise intensity was 50% to 55% of one repetition maximum (RM) or 1 RM. The cooling-down also consisted of running, free exercises and stretching.
The group with CEs had the same schedule of other groups for warm-up and cooling-down. The main phase consisted of aerobic training integrated with RE, with half the execution time and the same intensity of resistance and aerobic groups.
The trainings programs were performed within three sessions per week for 12 weeks. Every 2 weeks, in all exercise groups training was increased by 5 minutes and the intensity by 5%.
The average intensity of main stage in every exercise group was 5.5 metabolic equivalent of task (MET) in first week and in- creased to 7.1 MET at the end of the study.
Weight and height were measured and BMI was calculated using the following formula: BMI=weight (kg)/height (m2). In addition, body composition measurements (body fat percent- age and skeletal muscle mass) were defined using body imped- ance analyzer (BOCA; MECA, Seoul, Korea) in sleeping posi- tion and normal hydration state. Moreover, before interven- tion, 5 mL blood samples were taken after 12 hours of fasting and the serum samples were separated using a centrifuge. The samples were frozen at –70° degrees centigrade until the time of serum analysis and omentin-1 and plasma glucose were then measured. Serum omentin-1 and fasting insulin concen- trations were determined using enzyme-linked immunosor- bent assay kits (Cristal day biotech, Shanghai, China) and (Monobind, Aachen, Germany). Fasting plasma glucose was measured using glucose kit (Pars Azmoon, Tehran, Iran) through the photometric method. Insulin resistance was deter- mined through homeostasis model evaluation (HOMA-IR) and based on the following equation: HOMA-IR=[fasting glu- cose (mg/dL)×fasting insulin (mU/L)/405].
Test groups performed exercises for 12 weeks, while the con-
trol group did not. At the end of this period, blood samples were collected again as a post-test measurement of the depen- dent variables was performed. Primary criterion was the sig- nificant increase in serum omentin-1 concentration after 12 weeks training program. The sample size was calculated based on results of Wilms et al. [16], study.
STATA version 12 (STATA Corp., College Station, TX, USA) was used to analysis the data. Sample size was calculated to de- tect at least 1.5 units difference between groups in change of HOMA-IR from pre- to post- (12 weeks) measures with an as- sumed standard deviation of about the same size of difference (1.5 units), alpha value of 0.05 and a power of 80%. In order to compare the effects of each method of exercise on the absolute differences between pre and post-intervention measures of de- pendent variables, analysis of variance was used. Post hoc mul- tiple comparison analysis (Tukey test) was applied to compare groups differences. Statistical analysis was conducted assuming two-sided 5% level of significance.
RESULTS
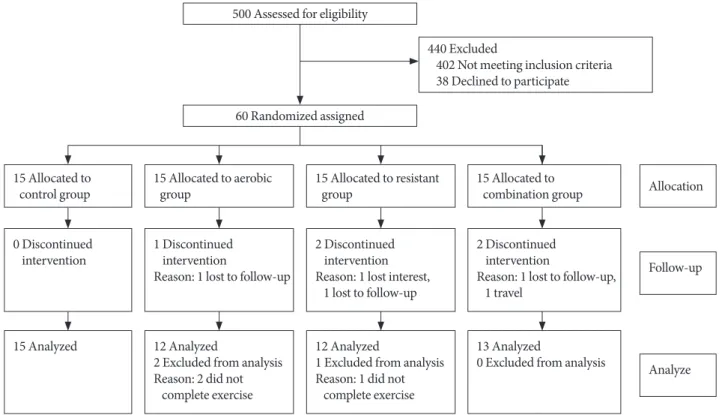
After completion of intervention, data of 52 participants (con- trol group 15, AE group 12, RE group 12, and CE group 13) were analyzed (completion [response rate], 83%). Eight partic- ipants (17%) were excluded due to the fact that they either did not complete the exercises training or they refused to provide the post-test blood samples (Fig. 1). After excluding those par- ticipants, the results of statistical analyses showed that there were no significant differences in baseline measures of the study variables between the groups (Table 1).
In comparison to the baseline measures, the interventions caused significant reduction in weight and BMI within RE and CE groups. However, these changes in the measures were not statistically significant when compared to the control group (Table 2). No significant change was found between the AE group and the control group regarding omentin-1 levels (Fig.
2), results of comparing changes of study variables (i.e.,
∆HOMA-IR, or ∆omentin level between groups) was shown in Table 2. It was also revealed that changes in omentin-1 were not significant when RE group was compared to the control group (P=0.76). However, change in omentin-1 level in the CE group was significantly higher after intervention was com- pared to the baseline measurements (21.00 to 48.82; P=0.001).
Furthermore, the results of the study showed that after 12 weeks of training sessions, serum omentin-1 was significantly
higher in the CE group in comparison to the other groups.
Comparing to the baseline levels, serum glucose was de- creased among all groups at the end of the study. However, comparing the intervention arms with the control group sug- gested a significant reduction in glucose concentration among the intervention groups. Regarding insulin resistance index, a significant difference was observed between aerobic and con-
trol groups (Fig. 2). In addition, after 12 weeks of AE and RE, HOMA-IR was decreased significantly among CE group com- pared to the control group, no significant difference was ob- served between resistance and the control group in this regard.
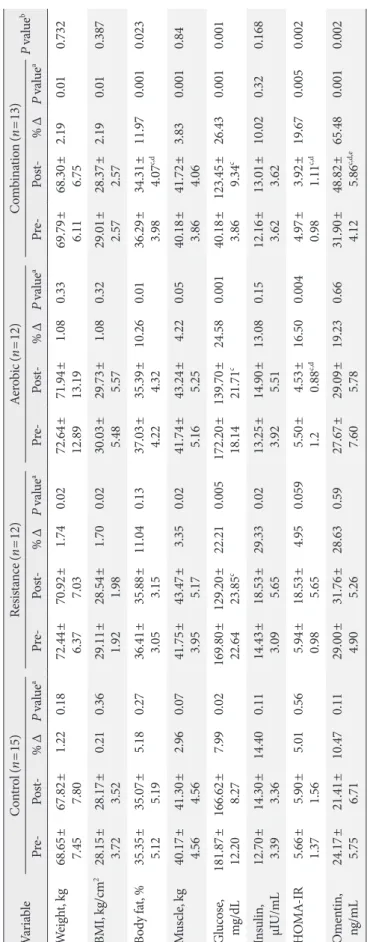
Results suggested that body fat percentage decreased in AE and CE groups after 12 weeks of exercise but this reduction was significant only in CE group. Finally, bivariate correlation be- Table 1. Baseline characteristics of the participants
Characteristic Control (n=15) Resistance (n=15) Aerobic (n=15) Combination (n=15) P valuea
Height, cm 153.18±5.86 157.65±3.43 155.75±6.57 155.18±5.32 0.64
Weight, kg 68.65±7.45 72.44±6.37 72.64±12.89 69.79±6.11 0.82
BMI, kg/cm2 28.15±3.72 29.11±1.92 30.03±5.48 29.01±2.57 0.85
Body fat, % 35.35±5.12 36.41±3.05 37.03±4.22 36.29±3.98 0.74
Muscle, kg 40.17±4.56 41.75±3.95 41.74±5.16 40.18±3.86 0.92
Glucose, mg/dL 181.87±12.20 169.80±22.64 172.20±18.14 170.00±21.25 0.50
Insulin, μIU/mL 12.70±3.39 14.43±3.09 13.25±3.92 12.16±3.62 0.47
HOMA-IR 5.66±1.37 5.94±0.98 5.50±1.2 4.97±0.98 0.26
Omentin, ng/mL 24.17±5.75 29.00±4.90 27.67±7.60 31.90±4.12 0.74
Values are presented as mean±standard deviation.
BMI, body mass index; HOMA-IR, homeostasis model assessment of insulin resistance.
aAnalysis of variance.
Allocation
Follow-up
Analyze 500 Assessed for eligibility
60 Randomized assigned
1 5 Allocated to aerobic group
1 Discontinued intervention
Reason: 1 lost to follow-up
12 Analyzed
2 Excluded from analysis R eason: 2 did not
complete exercise 1 5 Allocated to
control group
0 Discontinued intervention
15 Analyzed
1 5 Allocated to resistant group
2 Discontinued intervention R eason: 1 lost interest,
1 lost to follow-up
12 Analyzed
1 Excluded from analysis R eason: 1 did not
complete exercise
1 5 Allocated to combination group
2 Discontinued intervention
R eason: 1 lost to follow-up, 1 travel
13 Analyzed
0 Excluded from analysis 440 Excluded
402 Not meeting inclusion criteria 38 Declined to participate
Fig. 1. Study flow diagram.
Table 2. Laboratory values, anthropometric measures in groups at baseline and 12th week VariableControl (n=15)Resistance (n=12)Aerobic (n=12)Combination (n=13) P valueb Pre-Post-% ∆P valueaPre-Post-% ∆P valueaPre-Post-% ∆P valueaPre-Post-% ∆P valuea Weight, kg68.65± 7.4567.82± 7.801.220.1872.44± 6.3770.92± 7.031.740.0272.64± 12.8971.94± 13.191.080.3369.79± 6.1168.30± 6.752.190.010.732 BMI, kg/cm2 28.15± 3.7228.17± 3.520.210.3629.11± 1.9228.54± 1.981.700.0230.03± 5.4829.73± 5.571.080.3229.01± 2.5728.37± 2.572.190.010.387 Body fat, %35.35± 5.1235.07± 5.195.180.2736.41± 3.0535.88± 3.1511.040.1337.03± 4.2235.39± 4.3210.260.0136.29± 3.9834.31± 4.07c,d11.970.0010.023 Muscle, kg40.17± 4.5641.30± 4.562.960.0741.75± 3.9543.47± 5.173.350.0241.74± 5.1643.24± 5.254.220.0540.18± 3.8641.72± 4.063.830.0010.84 Glucose, mg/dL181.87± 12.20166.62± 8.277.990.02169.80± 22.64129.20± 23.85c22.210.005172.20± 18.14139.70± 21.71c24.580.00140.18± 3.86123.45± 9.34c26.430.0010.001 Insulin, μIU/mL12.70± 3.3914.30± 3.3614.400.1114.43± 3.0918.53± 5.6529.330.0213.25± 3.9214.90± 5.5113.080.1512.16± 3.6213.01± 3.6210.020.320.168 HOMA-IR5.66± 1.375.90± 1.565.010.565.94± 0.9818.53± 5.654.950.0595.50± 1.24.53± 0.88c,d16.500.0044.97± 0.983.92± 1.11c,d19.670.0050.002 Omentin, ng/mL24.17± 5.7521.41± 6.7110.470.1129.00± 4.9031.76± 5.2628.630.5927.67± 7.6029.09± 5.7819.230.6631.90± 4.1248.82± 5.86c,d,e65.480.0010.002 Values are presented as mean±standard deviation. BMI, body mass index; HOMA-IR, homeostasis model assessment of insulin resistance. aPaired sample t-test, bBased on analysis of variance comparing groups for exact changes (pre-post 12 weeks measures), cP<0.05 compare with control, dP<0.05 compare with resis- tance, e P<0.05 comparison with aerobic. Table 3. The correlations between omentin and BMI (and HOMA-IR) VariableOmentin BMIBody fat percentHOMA-IR Omentin1.0--- BMI–0.301a1.0-- Body fat percent–0.532b0.9651.0- HOMA-IR–0.801b0.677–0.1781.0 BMI, body mass index; HOMA-IR, homeostasis model assessment of insulin resistance. aCorrelation is significant at the 0.05 level (2-tailed), bCorrelation is significant at the 0.01 level (2-tailed).
tween serum omentin-1, HOMA-IR and BMI showed that omentin-1 level is inversely associated to HOMA-IR (P=0.001), body fat percentage (P=0.004), and BMI (P=0.021) (Table 3).
DISCUSSION
The present study suggested that glucose level decreases after 12 weeks of AE, RE, and CE. These changes were bigger among the participants in the CEs group. Also, compared to the con- trols, insulin resistance index decreased significantly in the aerobic and combined groups. Furthermore, the combined group had significant elevation in omentin-1 serum level.
In another study, it was shown that vigorous exercise is more effective in improving glycemic and lipid profiles than AE among patients with T2DM [17]. Other studies reported that CE (aerobic plus resistance) are more effective in reducing A1c and increasing insulin sensitivity [3].
Present study showed that the strongest effect of exercise on reducing insulin resistance was observed when the partici- pants did both types of exercises. Jorge et al. [18], also reported similar findings. Accordingly, diabetic patients who did resis- tance and combined resistance and AEs experienced an in- crease in insulin receptor substrate 1 (IRS-1) expression.
Omentin-1 level in diabetics is lower than that of healthy in- dividuals [13]. In a study by Pan et al. [12], changes in serum omentin-1 were measured in 46 patients with impaired glu- cose tolerance (IGT), 55 T2DM, and 50 participants with nor- mal glucose tolerance (NGT). The results showed that serum omentin-1 level was lower in IGT and T2DM groups when compared to NGT group Abd-Elbaky et al. [19], reported that
decrease in omentin-1 level was related to pathogenesis of T2DM. Bremer and Jialal [20] suggested that plasma level of omentin-1 among patients with metabolic syndrome was con- siderably lower than healthy individuals. These findings are in accordance with the results of present study in which changes in serum omentin-1 were negatively associated with insulin re- sistance.
It seems that exercise can lead to an increase in the omen- tin-1. In a similar study, the effect of 12 weeks of AE (five ses- sions a week) on 18 obese men was examined. It was shown that increase in omentin-1 had a positive effect on the omen- tin-1 levels of the participants via considerable reduction in weight [14]. In the present study, body fat percentage decreased significantly only in CE group. It has been previously pointed out that combination of aerobic and resistance training is more efficient in reduction of visceral fat than each exercise alone [21,22]. In addition, as Moreno-Navarrete et al. [13] reported, decrease in visceral adipose tissue could lead to increase in omentin-1 gene expression. It could be the reason for the in- crease in serum omentin-1 in CE group.
In the present study, all of the training groups experienced significantly decrease in glucose level, but only AE and CE had reduced HOMA-IR after 12 weeks of exercise. Davidson et al.
[23] in their study on 136 older obese participant which un- derwent aerobic, resistance, or combination training for 6 months have reported similar results. They observed improve- ment in HOMA-IR in aerobic and combination groups. It has been previously stated that reduction in visceral and abdomi- nal fat is a key linkage between exercise and insulin resistance improvement [24,25]. As this study showed, after 12 weeks of Fig. 2. Changes of (A) homeostasis model assessment of insulin resistance (HOMA-IR) and (B) serum omentin-1 before and af- ter 12 weeks training intervention based on analysis of variance. RE, resistance exercise; AE, aerobic exercise; CE, combined exer- cise. aP<0.05 compare with control, bP<0.05 compare with resistance, cP<0.05 comparison with aerobic.
7 6 5 4 3 2 1 0
60 50 40 30 20 10 0
HOMA-IR Omentin (ng/mL)
Control RE AE CE Control RE AE
a,b
Pre Pre
Post Post
CE
A B
a,b
a,b,c
exercise body fat percentage reduced only in aerobic and com- bination groups; hence, it is may partly justified why we saw HOMA-IR reduction in AE and CE but not RE.
In conclusion, 12 weeks of aerobic and combination of AE and RE programs in diabetic women caused significant im- provements in HOMA-IR. Moreover, significant increase in serum omentin-1 was observed with reduction of body fat in CE group. It seems that resistance and aerobic types of exercise can be used to improve insulin sensitivity and the omentin-1 level amongst diabetic patients.
CONFLICTS OF INTEREST
No potential conflict of interest relevant to this article was re- ported.
ACKNOWLEDGMENTS
The present study was financially supported by Shiraz Univer- sity of Medical Sciences, Shiraz, Iran (No: 95-01-59-12487).
We greatly appreciate the efforts of the patients who partici- pated in this study and our colleagues at the Voluntary Coun- seling and Treatment Center (VCT) who supported our re- search. No sources of funding were used in this study. The au- thors declare no conflict of interest. The authors would like to thank Mr. H. Argasi at the Research Consultation Center (RCC) at Shiraz University of Medical Sciences for his invalu- able assistance in editing this article.
REFERENCES
1. Galic S, Oakhill JS, Steinberg GR. Adipose tissue as an endo- crine organ. Mol Cell Endocrinol 2010;316:129-39.
2. Sturm R. Childhood obesity: what we can learn from existing data on societal trends, part 2. Prev Chronic Dis 2005;2:A20.
3. Granger DN, Granger JP. Colloquium series on integrated sys- tems physiology: from molecule to function. San Rafael: Mor- gan & Claypool Life Sciences; 2011. Chapter 5, Cardiovascular responses to exercise; p1-124.
4. Kang J. Nutrition and metabolism in sports, exercise and health. Abingdon: Routledge; 2013.
5. Berg AH, Scherer PE. Adipose tissue, inflammation, and car- diovascular disease. Circ Res 2005;96:939-49.
6. Uchiyama Y, Suzuki T, Mochizuki K, Goda T. Dietary supple- mentation with (-)-epigallocatechin-3-gallate reduces inflam-
matory response in adipose tissue of non-obese type 2 diabetic Goto-Kakizaki (GK) rats. J Agric Food Chem 2013;61:11410-7.
7. Rabe K, Lehrke M, Parhofer KG, Broedl UC. Adipokines and insulin resistance. Mol Med 2008;14:741-51.
8. Tan BK, Adya R, Farhatullah S, Lewandowski KC, O’Hare P, Lehnert H, Randeva HS. Omentin-1, a novel adipokine, is de- creased in overweight insulin-resistant women with polycystic ovary syndrome: ex vivo and in vivo regulation of omentin-1 by insulin and glucose. Diabetes 2008;57:801-8.
9. de Souza Batista CM, Yang RZ, Lee MJ, Glynn NM, Yu DZ, Pray J, Ndubuizu K, Patil S, Schwartz A, Kligman M, Fried SK, Gong DW, Shuldiner AR, Pollin TI, McLenithan JC. Omentin plasma levels and gene expression are decreased in obesity. Di- abetes 2007;56:1655-61.
10. Cai RC, Wei L, Di JZ, Yu HY, Bao YQ, Jia WP. Expression of omentin in adipose tissues in obese and type 2 diabetic pa- tients. Zhonghua Yi Xue Za Zhi 2009;89:381-4.
11. Gursoy G, Kirnap NG, Esbah O, Acar Y, Demirbas B, Akcayoz S, Ozturk A. The relationship between plasma omentin-1 levels and insulin resistance in newly diagnosed type 2 diabetıc women. Clin Rev Opin 2010;2:49-54.
12. Pan HY, Guo L, Li Q. Changes of serum omentin-1 levels in normal subjects and in patients with impaired glucose regula- tion and with newly diagnosed and untreated type 2 diabetes.
Diabetes Res Clin Pract 2010;88:29-33.
13. Moreno-Navarrete JM, Catalan V, Ortega F, Gomez-Ambrosi J, Ricart W, Fruhbeck G, Fernandez-Real JM. Circulating omen- tin concentration increases after weight loss. Nutr Metab (Lond) 2010;7:27.
14. Saremi A, Asghari M, Ghorbani A. Effects of aerobic training on serum omentin-1 and cardiometabolic risk factors in over- weight and obese men. J Sports Sci 2010;28:993-8.
15. World Health Organization. Definition and diagnosis of diabe- tes mellitus and intermediate hyperglycemia. Geneva: World Health Organization; 2006.
16. Wilms B, Ernst B, Gerig R, Schultes B. Plasma omentin-1 levels are related to exercise performance in obese women and in- crease upon aerobic endurance training. Exp Clin Endocrinol Diabetes 2015;123:187-92.
17. Cauza E, Hanusch-Enserer U, Strasser B, Ludvik B, Metz- Schimmerl S, Pacini G, Wagner O, Georg P, Prager R, Kostner K, Dunky A, Haber P. The relative benefits of endurance and strength training on the metabolic factors and muscle function of people with type 2 diabetes mellitus. Arch Phys Med Rehabil 2005;86:1527-33.
18. Jorge ML, de Oliveira VN, Resende NM, Paraiso LF, Calixto A, Diniz AL, Resende ES, Ropelle ER, Carvalheira JB, Espindola FS, Jorge PT, Geloneze B. The effects of aerobic, resistance, and combined exercise on metabolic control, inflammatory mark- ers, adipocytokines, and muscle insulin signaling in patients with type 2 diabetes mellitus. Metabolism 2011;60:1244-52.
19. Abd-Elbaky AE, Abo-ElMatty DM, Mesbah NM, Ibrahim SM.
Omentin and apelin concentrations in relation to obesity, dia- betes mellitus type two, and cardiovascular diseases in Egyp- tian population. Int J Diabetes Dev Ctries 2016;36:52-8.
20. Bremer AA, Jialal I. Adipose tissue dysfunction in nascent metabolic syndrome. J Obes 2013;2013:393192.
21. Ho SS, Dhaliwal SS, Hills AP, Pal S. The effect of 12 weeks of aerobic, resistance or combination exercise training on cardio- vascular risk factors in the overweight and obese in a random- ized trial. BMC Public Health 2012;12:704.
22. Park DH, Ransone JW. Effects of submaximal exercise on high- density lipoprotein-cholesterol subfractions. Int J Sports Med 2003;24:245-51.
23. Davidson LE, Hudson R, Kilpatrick K, Kuk JL, McMillan K, Janiszewski PM, Lee S, Lam M, Ross R. Effects of exercise mo- dality on insulin resistance and functional limitation in older adults: a randomized controlled trial. Arch Intern Med 2009;
169:122-31.
24. O’Leary VB, Marchetti CM, Krishnan RK, Stetzer BP, Gonzalez F, Kirwan JP. Exercise-induced reversal of insulin resistance in obese elderly is associated with reduced visceral fat. J Appl Physiol (1985) 2006;100:1584-9.
25. Kohrt WM, Kirwan JP, Staten MA, Bourey RE, King DS, Hol- loszy JO. Insulin resistance in aging is related to abdominal obesity. Diabetes 1993;42:273-81.