Temperature
(day/night, °C) Nutrient supply N P K Ca Mg
--- % ---
15/8
x 1.0 54
†68 59 61 67
x 1.5 54 73 49 52 54
x 2.0 59 78 53 60 65
28/21
x 1.0 100 100 100 100 100
x 1.5 104 139 104 95 101
x 2.0 106 120 111 106 101
36/26
x 1.0 85 89 63 69 83
x 1.5 77 72 50 70 82
x 2.0 77 79 55 66 77
F-value Temperature Nutrient
Temperature x Nutrient
72.41
***0.19 0.74
96.39
***3.46 10.45
***142.99
***2.07 1.80
61.16
***0.92 0.74
50.09
***0.72 0.95 Our data report that extra-supply of minerals doesn’t play crucial roles to promote macro-element uptake as tomato plants are suffered from temperature stresses.
†The data indicate a percentage of macro-element uptake when the uptake is defined as 100 in optimal supply (1/2 strength Hoagland’s nutrient solution) at optimal temperature condition (28/21°C). The concentration, x 1.0, means the 1/2 strength Hoagland’s nutrient solution.
Mineral Uptake and Soluble Carbohydrates of Tomato Plants as Affected by Air Temperatures and Mineral Treatment Levels
Jwakyung Sung, Hejin Yun, Minji Cho, Yejin Lee, Hyenchung Chun, Sangkeun Ha, and Yeonkyu Sonn*
Soil and Fertilizer Division, NAAS, RDA, Wanju, Jeollabuk-do 55365, Korea
(Received: June 15 2015, Revised: August 21 2015, Accepted: August 24 2015)
Both low and high temperatures affect plant growth and development at whole plant level, tissue and even cell level through a variety of metabolic changes. Temperature stress is one of frequently occurring problems in greenhouse crops in summer and winter seasons due to the wide-spread year-round cultivation. In the present study, we investigated the extent of the inhibition of growth, macro-element uptake and soluble carbohydrate production, and the effect of extra-supply of minerals as a means of the recovery from temperature damage.
Tomato plants were grown five different growth temperatures (15/8, 20/13, 28/21, 33/23 and 36/26°C), and extra-supply of minerals was composed of 1.5- and 2.0-fold stronger than the standard nutrition (1/2 strength of Hoagland’s solution). Temperature stress significantly adversely affected tomato growth and mineral uptake, whereas soluble carbohydrate accumulation represented temperature-dependent response, more accumulation at low temperature and more consumption at high temperature. The soluble sugars in leaves and stems were mostly declined with the supply of extra-minerals at low and optimal temperatures, whereas remained unchanged at high temperature. The starch levels also remained unchanged or slightly decreased.
Key words: Tomato, Mineral uptake, Carbohydrates, Temperature stress, Mineral supply The effect of the extra-supplied nutrients on macro-element uptake.
1)
*Corresponding author : Phone: +82632382425, Fax: +82632380208, E-mail: [email protected]
§
Acknowledgement : This work was carried out with the support of “Cooperative Research Program for Agriculture Science &
Technology Development (Project No. PJ010899)” Rural Development Administration, Republic of Korea.
Introduction
The production of vegetable crops has shown significant yield increases in South Korea since over the last several decades. Transitory or constantly high temperatures cause a variety of morpho-anatomical, physiological and biochemical changes in plants, which affect plant growth and development and may result in a significant reduction in economic yield.
At moderately high temperatures, injuries or death to crop plants may occur only after long-term exposure, and it may be derived from a limited photosynthesis, assimilate partitioning, and water and nutrient use efficiency (Kuiper, 1964; Walker, 1969; Ruter and Ingram, 1990). A well-known consequence of elevated temperature in plants is the damage caused by heat-induced imbalance in photosynthesis and respiration; in general, the rate of photosynthesis decreases whereas dark- and photo-respiration rates increase considerably under high temperatures (Nakamoto and Hiyama, 1999). Assimilate parti- tioning, taking place via apoplastic and symplastic pathways under high temperature, has significant effects on transport and transfer processes in plants although it strongly depends on genotypes (Yang et al., 2002; Taiz and Zeiger, 2006).
Mineral uptake by plants in the rhizosphere is directly influenced by soil temperature, and the lower (chilling) and higher (heat) temperatures compared to the optimum lead to a considerable reduction in mineral uptake (Cumbus and Nye, 1984; Raju et al., 1990; Tindall et al., 1990).
Tomato (Lycopersicon esculentum) is one of the most popular vegetable crops cultivated commercially around the world and, according to the report (MAFRA statistics, 2013), greenhouses-based cultivation was approximately 6,054ha (the 3rd in vegetable crops) throughout South Korea without big fluctuation year by year. Furthermore, a year round cultivation of tomato often causes unexpected heat (high in summer season) and chilly (low in winter season) stresses, and thus results in deleterious effects on the growth and yield.
Although the literature on plant responses to temperatures such as mineral uptake and carbohydrate production is abundant, the information about the effects of extra-supply of minerals is only a very few. From the previous study with lettuce, we have found out several fruitful results about mineral uptake and soluble carbohydrate production under temperature stresses (submitted), and this study aimed to know the extent of a damage of growth, mineral uptake and carbohydrate production under low or high temperature conditions, and to know whether there is any effect of extra-supply of minerals to recover and promote those in tomato plants.
Materials and Methods
Plant materials and growth conditions This study was
performed in an environment-controlled growth chamber, NAAS, RDA, South Korea in 2014. The uniformly grown seedlings of tomato (cv. Seonmyeong, Nongwoo Bio Ltd.) were transplanted into 1 L plastic box filled with pure sand soil, and then fed with 1/2 strength of Hoagland’s solution which is composed as follows; 5 mM Ca(NO
3)
2, 5 mM KNO
3, 2 mM MgSO
4, 0.5 mM KH
2PO
4, 1.5 mM Fe-EDTA, 1 mM NH
4NO
3, 2 μM H
3BO
3, 0.2 μM MnCl
2, 0.01 μM ZnSO
4, 0.01 μM CuSO
4, and 0.03 μM H
2MoO. The 1/2 strength of Hoagland’s solution, 100 mL per box, was supplied every day during the experiment. Plants were grown in five different temperature conditions, low (15/8°C, day/night), moderately low (20/13°C), optimal (28/21°C), moderately high (33/23°C) and high (36/26°C) temperatures. To investigate the effect of an extra-supply of minerals as a means of mitigating tem- perature stress, tomato seedlings were grown in three different nutrient conditions, standard (1/2 strength of Hoagland solution), 1.5- and 2.0-fold stronger nutrient solutions. Tomato plants were assigned with the completely randomized two factor factorial design (temperature and nutrient supply) in an environment-controlled chamber and were taken to determine the contents of carbohydrates and mineral elements at 10, 20 and 30 days after treatment (DAT).
Measurement of nutrients The samples (0.3 g) which were at 80°C for 48 h were soaked in 5 mL of 368 mM salicylic acid in 84.7% sulfuric acid (H
2SO
4) for 24 h then digested in a digestion system, heated to 300°C for 3 h, followed by several drops of hydrogen peroxide (H
2O
2). The extracted solution was transferred to 100 mL volumetric flasks and then diluted to 100 mL with deionized water for mineral assays. The N concentration was colorimetrically determined using the automatic flow injection analyzer (BRAN LUBBE, Germany). The P concentration was measured using the molybdate-blue colorimetric method (UV-2450, Shimadzu, Japan) and cation concentrations were determined with ICP-OES (INTEGRA XMP, GBC, Australia).
Measurement of soluble carbohydrates Soluble sugar from dried shoots and roots was determined by the reaction of 1.0 mL of the alcoholic extract with 2.0 mL fresh 0.2%
anthrone in sulfuric acid (w/v); the absorbance was read at 630 nm. After the extraction of the soluble fractions, the solid fraction was used for starch analysis. Starch was firstly extracted with 9.3 N (normal concentration) of perchloric acid and followed by 4.6 N. The extracts were combined and starch concentration was determined after reaction with the anthrone reagent. Glucose was used as the standard for soluble sugar.
Statistical analysis This experiment was performed with
the completely randomized two factor factorial design (tem-
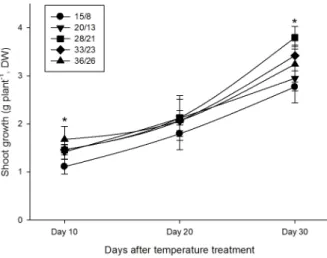
Fig. 1. Effect of temperature stresses on tomato plants grown under 1/2 strength Hoagland’s nutrient solution (n=3). Star (*) mark means significant difference in p<0.05.
Fig. 2. Effect of an extra-supply of nutrients on tomato plants grown under four different temperature regimes at 30 DAT (n=3). The concentration, x 1.0, means the 1/2 strength Hoagland’s nutrient solution.
perature and nutrient level) with three repeats. The analysis of variance (ANOVA) was conducted to find effects of treatments.
Least significant difference (LSD) was performed to determine the significance of the difference between the means of treatments. An α error value of 0.05 was chosen to indicate statistical significance. All statistical analysis was performed using version 9.01 of SAS (SAS Institute Inc, Cary, NC).
Results
Effects of temperature and extra-supplied nutrient on tomato growth The shoot growth of tomato (dry weight- based) from each temperature condition was shown in Fig. 1, and, between temperature conditions, represented significant differences (p<0.05) at 10 and 30 days after treatment (DAT).
Tomato growth at the end of the experiment was the highest at
the optimal (28/21°C) and followed by moderately high (33/23°C), high (36/26°C), low (15/8°C), and moderately low (20/13°C) temperature conditions. The reduction in tomato growth was more significant in low temperature which indicated only 69-73% to the optimal temperature, whereas represented 85-90% in high temperature. The effect of extra-supply of nutrients (1.5 and 2.0 fold stronger) as a means of mitigating the damage from temperature stresses was not observed (Fig. 2).
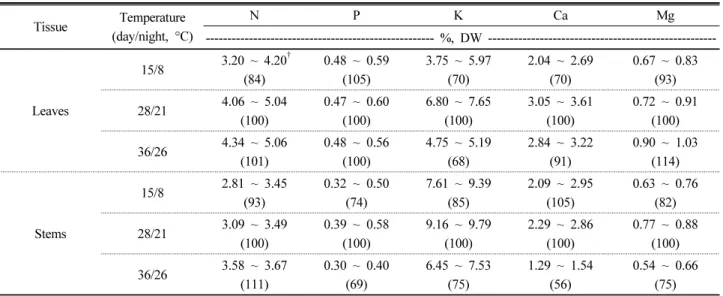
Effects of temperature and extra-supplied nutrients on concentration and uptake of macro-elements The concen- trations of macro-elements in temperature-affected tomato plants resulted in a tendency of the overall decrease except P (unchanged or slight increase at both conditions), N (unchanged at high) and Mg (marked increase at high) in leaves, and except N (slight increase at high) and Ca (slight increase at low) in stems (Table 1). The most significant reduction was K concentration which indicated 70% (leaves) and 85% (stems) at low temperature and 68% (leaves) and 75% (stems) at high temperature. The uptake of macro-elements was greatly affected by the interaction of reduced growth and mineral concentration derived from temperature stresses (Table 2), and the uptake rates at low temperature were ranged from 54 to 68% (Data was only expressed as a mg uptake per shoot on Table) of optimal temperature, and, at high temperature, from 63 to 89% of optimal temperature. In particular, it seemed likely that temperature stress strongly influenced the uptake of cations. The extra supply of nutrients was non-effective to promote the nutrient uptake as tomato plants were exposed extremely adverse temperature conditions although an effect was partially observed for N and P at the double-concentrated nutrient supply at low temperature (Table 3).
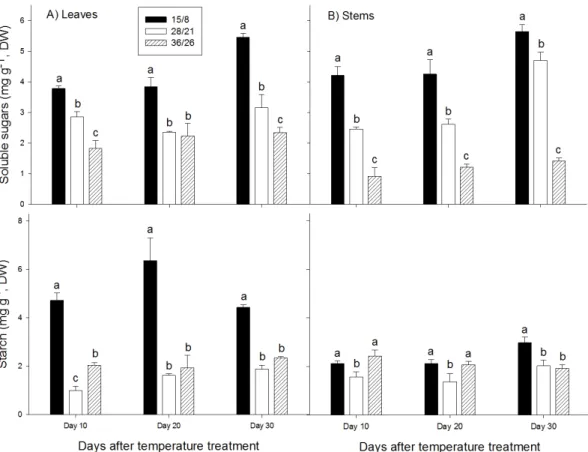
Effects of temperature and extra-supplied nutrients on
soluble carbohydrates production The contents (glucose
equi.) of soluble carbohydrates greatly differed with both
temperature conditions and a type of soluble carbohydrates
(Fig. 3). The levels of soluble sugars were the highest at low
temperature regardless of tissue (leaves and stems) and time
points, and followed by optimal and high temperatures. The
level of soluble sugars in leaves and stems at low and high
temperatures represented 172 (5.45 ± 0.14 mg g
-1DW), 120
(5.64 ± 0.23 mg g
-1DW), 74 (2.34 ± 0.17 mg g
-1DW) and 30
(1.42 ± 0.10 mg g
-1DW) %, respectively, at 30 DAT. An
accumulation of starch was differed from soluble sugars, and
was in order of low, high and optimal temperatures. The level
of starch in leaves and stems at low and high temperatures
represented 235 (4.43 ± 0.11 mg g
-1DW), 147 (2.98 ± 0.23
mg g
-1DW), 124 (2.35 ± 0.16 mg g
-1DW) and 95 (1.93 ± 0.13
mg g
-1DW) %, respectively, at 30 DAT. The extra supply of
nutrients on the contents of soluble carbohydrates greatly
Table 1. The range of macro-element concentrations in temperature-affected tomato plants.
Tissue Temperature (day/night, °C)
N P K Ca Mg
--- %, DW ---
Leaves
15/8 3.20 ~ 4.20
†(84)
0.48 ~ 0.59 (105)
3.75 ~ 5.97 (70)
2.04 ~ 2.69 (70)
0.67 ~ 0.83 (93)
28/21 4.06 ~ 5.04
(100)
0.47 ~ 0.60 (100)
6.80 ~ 7.65 (100)
3.05 ~ 3.61 (100)
0.72 ~ 0.91 (100)
36/26 4.34 ~ 5.06
(101)
0.48 ~ 0.56 (100)
4.75 ~ 5.19 (68)
2.84 ~ 3.22 (91)
0.90 ~ 1.03 (114)
Stems
15/8 2.81 ~ 3.45
(93)
0.32 ~ 0.50 (74)
7.61 ~ 9.39 (85)
2.09 ~ 2.95 (105)
0.63 ~ 0.76 (82)
28/21 3.09 ~ 3.49
(100)
0.39 ~ 0.58 (100)
9.16 ~ 9.79 (100)
2.29 ~ 2.86 (100)
0.77 ~ 0.88 (100)
36/26 3.58 ~ 3.67
(111)
0.30 ~ 0.40 (69)
6.45 ~ 7.53 (75)
1.29 ~ 1.54 (56)
0.54 ~ 0.66 (75)
†
Data indicate the range of the concentrations measured at three sampling points, 10, 20 and 30 DAT, and the data within the parenthesis represent a concentration index of macro-elements when the concentrations are defined as 100 in optimal temperature condition (28/21°C).
Table 2. The shoot uptake of macro-elements in temperature-affected tomato at 30 DAT.
Temperature (day/night, °C)
N P K Ca Mg
--- mg shoot
-1, DW ---
15/8 94.3 ± 13.9b
†12.0 ± 1.2b 177.9 ± 28.8b 71.4 ± 11.6b 21.3 ± 2.3c
28/21 173.8 ± 10.3a 17.6 ± 0.6a 299.3 ± 12.8a 117.4 ± 5.7a 32.0 ± 0.8a
36/26 147.8 ± 15.1a 15.6 ± 1.5a 187.9 ± 18.7b 80.9 ± 8.4b 26.7 ± 3.1b
F-value 27.98
***17.38
**30.37
***25.93
**16.11
**†
Data indicate the uptake of macro-elements of tomato shoots at three different temperature conditions at 30 days after treatment, and tomato plants were grown under the 1/2 strength Hoagland’s nutrient solution. The letters mean significant differences from LSD test (n=3).
Table 3. The effect of the extra-supplied nutrients on macro-element uptake.
Temperature
(day/night, °C) Nutrient supply N P K Ca Mg
--- % ---
15/8
x 1.0 54
†68 59 61 67
x 1.5 54 73 49 52 54
x 2.0 59 78 53 60 65
28/21
x 1.0 100 100 100 100 100
x 1.5 104 139 104 95 101
x 2.0 106 120 111 106 101
36/26
x 1.0 85 89 63 69 83
x 1.5 77 72 50 70 82
x 2.0 77 79 55 66 77
F-value Temperature Nutrient
Temperature x Nutrient
72.41
***0.19 0.74
96.39
***3.46 10.45
***142.99
***2.07 1.80
61.16
***0.92 0.74
50.09
***0.72 0.95
†