Effect of high temperature on mineral uptake, Soluble carbohydrates partitioning and cucumber yield
Jwakyung Sung, Suyeon Lee, Yejin Lee, Sangkeun Ha, Yeonkyu Sonn*
Soil and Fertilizer Division, NAAS, RDA, Republic of Korea
Received on 31 October 2014, revised on 30 December 2014, accepted on 31 December 2014
Abstract : Plastic film houses are directly associated with increases in plant growth and yield of vegetable crops through a year round cultivation, however, at the same time temperature stresses are one of fates which are difficult to avoid during crop growth. The objective of this study was to examine the translocation and distribution of minerals (N, P, K) and carbohydrates as well as seasonal fluctuation of mineral uptake and carbohydrate production in cucumber plant grown under moderately high temperature. The temperature treatments consisted of 2-layers film houses (optimal temp.) and 3-layers (high temp.). Shoot growth of cucumber plants were linearly increased until 14 weeks after transplanting (WAT) without any significant difference between both temperatures, and the slowdown was observed from 16 WAT.
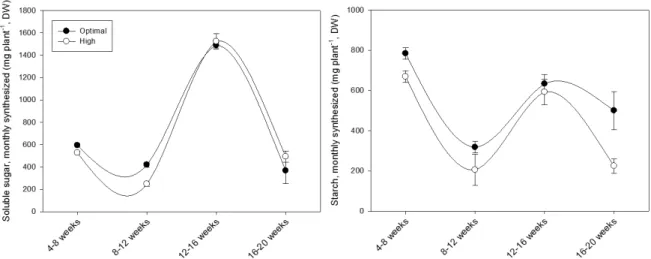
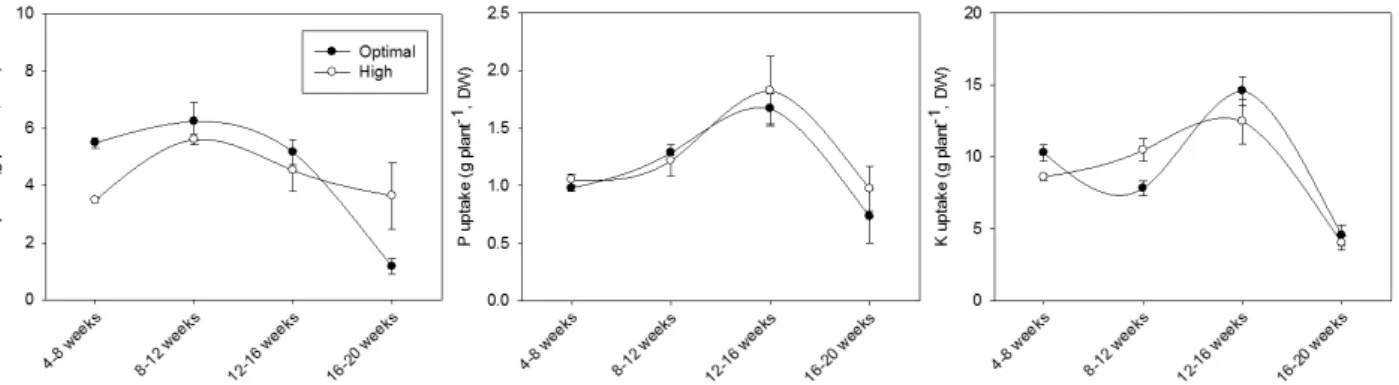
The level of soluble sugar and starch was slightly greater in optimal temperature compared to the high. Cumulative accumulation of soluble sugar was significantly different before and after 12 WAT in both treatments, whereas starch level represented a constant increase. Monthly production of soluble sugar reached the peak between 12 to 16 WAT, and starch peaked between 4 to 8 WAT and 12 to 16 WAT. Total uptake of N, P and K in optimal and high temperature conditions was 18.4g plant -1 and 17.6 for N, 4.7 and 5.1 for P, and 37.7 and 36.2 for K, respectively, and the pattern of monthly N uptake between optimal and high temperatures was greater in early growth stage, whereas was greater in mid growth stage in both P and K. Thus, this study suggests that moderately high temperature influences much greater to photosynthesis and carbohydrate production than plant biomass and mineral uptake. On the basis of the present result, it is required to indentify analysis of respiration rates from plant and soil by constantly increasing temperature conditions and field studies where elevated temperatures are monitored and manipulated.
Key words : Plastic film house, Cucumber, Mineral uptake, Carbohydrates, High temperature
*Corresponding author: Tel: +82-63-238-2425 E-mail address: [email protected]
I. Introduction
The production of vegetable crops has shown significant yield increases in South Korea since over the last several decades. The utilization of plastic mulch in combination with drip irrigation has played a major role in the increases in production of many vegetable crops, and the majority of the reports on plastic mulches show that increased RZT is one of the main benefits associated with the use of plastic mulches (Lamont, 1993). The concentration of mineral elements in crop shoot was increased by plastic mulches (Wien and Minotti, 1987), the improvement
of root growth and nutrient uptake led to an increased
aboveground growth of crop (Wien et al., 1993). On
the other hand of the benefits by enhanced root zone
temperature, heat stress due to high ambient tem-
peratures is a serious threat to crop production
worldwide (Hall, 2001). Transitory or constantly high
temperatures cause a variety of morpho-anatomical,
physiological and biochemical changes in plants,
which affect plant growth and development and may
result in a significant reduction in economic yield. At
moderately high temperatures, injuries or death to
crop plants may occur only after long-term exposure,
and it may be derived from a limited photosynthesis,
assimilate partitioning, and water and nutrient use
efficiency (Kuiper, 1964; Walker, 1969; Ruter and
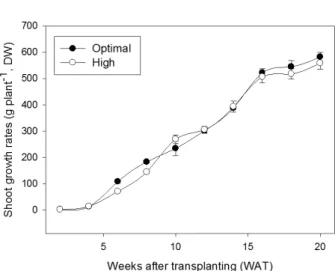
Fig. 1. Time-coursed changes in growth rates of cucumber shoot (leaf + stem + fruit) grown under different temperature conditions (n=5). Cucumber seedlings were transplanted on March 1st, 2013. The symbols indicate optimal (closed) and high (opened) temperatures, respectively.
Ingram, 1990). A well-known consequence of elevated temperature in plants is the damage caused by heat-induced imbalance in photosynthesis and respiration;
in general, the rate of photosynthesis decreases whereas dark- and photo-respiration rates increase considerably under high temperatures (Nakamoto and Hiyama, 1999).
Assimilate partitioning, taking place via apoplastic and symplastic pathways under high temperatures, has significant effects on transport and transfer processes in plants although it strongly depends genotypes (Yang et al., 2002; Taiz and Zeiger, 2006).
Mineral uptake by plants from the rhizosphere is directly influenced by soil temperature, and the lower (chilling) and higher (heat) temperatures compared to the optimum lead to a considerable reduction in mineral uptake (Cumbus and Nye, 1984; Raju et al., 1990;
Tindall et al., 1990). Cucumber ( Cucumis sativus ) is one of the most popular vegetable crops cultivated commercially worldwide, and the scale of film houses- based cultivation throughout South Korea was ap- proximately 2,836 ha (MAFRA statistics, 2014).
Furthermore, a year round cultivation of cucumber often induces the unexpected heat (high in summer season) and chilly (low in winter season) stresses, and thus results in deleterious effects on the growth and yield. Although the literature on plant responses to temperatures is abundant, there are few studies estimating mineral uptake and carbohydrate production during whole growth season. The objective of this study was to examine the translocation and distribution of minerals (N, P, K) and carbohydrates as well as seasonal fluctuation of mineral uptake and carbohydrate production in cucumber plant grown under moderately high temperature.
II. Materials and Method
1. Plant materials and growth conditions This study was performed at a farmer’s greenhouse located in Byoungcheon-myeon, Cheonan-si, Chung-
cheongnam-do, South Korea in 2013 for cucumber ( Cucumis sativus cv. Backdadagi). Cucumber seedlings were transplanted on March 1, 2013 with a planting interval of 0.6 m. The mineral sources applied into the soil as a basal fertilizer were as follows; rice straw (2,000 kg), micro-elements (13 kg), bone dust (26 kg), amino acids-containing fertilizer (52 kg) and ash (78 kg) per 1,000 m 2 . An additional fertilizer (12 L per day), liquid manure, was supplied every day for 5 months after 2 weeks of transplanting using a fertigation system. Mineral composition of all fertilizer sources used in this study was described in table 2.
In order to elevate air and soil temperatures in
greenhouse, we installed 3-layers plastic films compared
to 2-layers in conventional cultivation (optimal), and
the daily fluctuation of temperature was monitored
during growth season (Fig. 1). Cucumber plants were
taken to determine the contents of carbohydrates and
mineral elements at every two weeks, and the fruit
to estimate the yield was harvested as it was fully
developed.
Table 1. Comparison of soil chemical properties between temperature treatments during whole growth period.
Temperature pH
(1:5)
EC (dS m
-1)
OM (g kg
-1)
T-N (%)
Av. P
2O
5(mg kg
-1)
Exch. cations (cmolc+kg
-1)
K Ca Mg Na
Optimal 7.2 - 7.5 1.76 - 3.83 29 - 31 0.12 - 0.14 717 - 805 0.96 - 1.08 9.7 - 11.0 3.9 - 4.4 0.49 - 0.63 High 7.2 - 7.4 2.37 - 4.26 31 - 33 0.12 - 0.14 780 - 848 0.93 - 1.27 10.1 - 11.0 3.8 - 4.7 0.42 - 0.58 Optimal range of
soil chemistry 6.0 - 6.5 < 2.0 20 - 30 - 400 - 500 0.70 - 0.80 5.0 - 6.0 1.5 - 2.0 - 2. Measurement of soluble carbohydrates
Soluble sugar from fresh leaf, stem and fruit was determined by the reaction of 1.0 mL of the alcoholic extract with 2.0 mL fresh 0.2% anthrone in sulfuric acid (w/v); the absorbance was read at 630 nm. After the extraction of the soluble fractions, the solid fraction was used for starch analysis. Starch was extracted with 9.3 mol L -1 perchloric acid followed by 4.6 N. The extracts were combined and starch con- centration was determined after reaction with the anthrone reagent. Glucose was used as the standard for soluble sugar.
3. Measurement of nutrients
Fresh plants were separated into young leaves, fully-expanded leaves, petioles, stems and roots, and then washed with tap water followed by distilled water. One gram of separated fresh samples was ground with 20 mL of dH 2 O, passed through a mem- brane filter (0.45 μm), and used as a sample for measuring water soluble minerals. The oven-dried samples (0.3 g) which were at 80°C for 48 h were soaked in 5 mL of 368 mmol -1 L salicylic acid in 84.7
% sulfuric acid (H 2 SO 4 ) for 24 h then digested in a digestion system, heated to 300°C for 3 h, followed by several drops of hydrogen peroxide (H 2 O 2 ). The extracted solution was transferred to 100 mL vol- umetric flasks and then diluted to 100 mL with deionized water for mineral assays. The N concentration was colorimetrically determined using the automatic flow injection analyzer (BRAN LUBBE, Germany). The
P concentration was measured using the molybdate-blue colorimetry method (UV-2450, Shimadzu, Japan) and cation concentrations were determined with ICP-OES (INTEGRA XMP, GBC, Australia). The uptake ratio of each N, P, and K of each treatment was calculated as a ratio of each nutrient concentration in each treatment to that in NPK sufficient condition.
4. Statistical analysis
The analysis of variance (ANOVA) was conducted to find effects of treatments. Least significant dif- ference (LSD) was performed to determine the significance of the difference between the means of treatments. Pearson’s correlation coefficient analysis was performed to determine the relationship between minerals. An α value of 0.05 was chosen to indicate statistical significance. All statistical analysis was performed using version 9.01 of SAS (SAS Institute Inc, Cary, NC).
III. Results and Discussion
Soil chemical properties during whole growth period
were examined and compared between both tem-
perature conditions (Table 1). All chemical indices
were not significantly different between both tem-
peratures, but were greater than those of the rec-
ommended optimal range except soil pH. Mineral
composition of fertilizer sources applied into the soil
as basal and additional fertilizers were described in
table 2. As a result of mineral composition, rice
straw, amino acids-containing fertilizer, bone dust
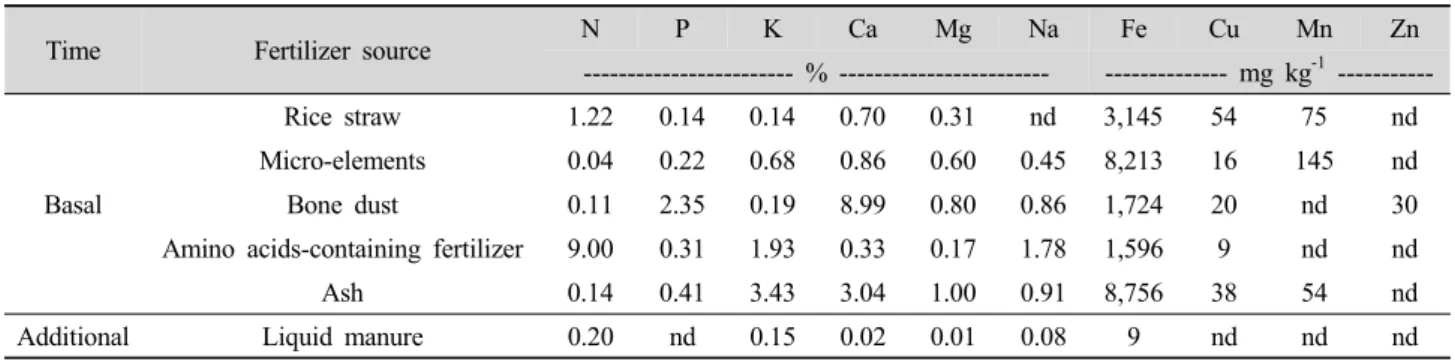
Table 2. Mineral composition of fertilizer sources applied into the soil as basal and additional fertilizers.
Time Fertilizer source N P K Ca Mg Na Fe Cu Mn Zn
--- % --- --- mg kg
-1---
Basal
Rice straw 1.22 0.14 0.14 0.70 0.31 nd 3,145 54 75 nd
Micro-elements 0.04 0.22 0.68 0.86 0.60 0.45 8,213 16 145 nd
Bone dust 0.11 2.35 0.19 8.99 0.80 0.86 1,724 20 nd 30
Amino acids-containing fertilizer 9.00 0.31 1.93 0.33 0.17 1.78 1,596 9 nd nd
Ash 0.14 0.41 3.43 3.04 1.00 0.91 8,756 38 54 nd
Additional Liquid manure 0.20 nd 0.15 0.02 0.01 0.08 9 nd nd nd
Table 3. Concentration of macro elements in leaf, stem and fruit of cucumber plants subjected to high temperature during whole growth period.
Temperature Tissue N P K Ca Mg
--- %, DW --- Optimal
Leaf 2.59 - 3.52 0.23 - 0.49 2.35 - 4.63 2.40 - 4.90 0.80 - 1.59 Stem 1.32 - 2.24 0.50 - 0.78 4.73 - 6.87 0.73 - 1.12 0.48 - 0.72 Fruit 2.85 - 5.15 0.62 - 1.13 4.93 - 7.02 0.51 - 0.83 0.36 - 0.47 High
Leaf 2.29 - 3.29 0.36 - 0.61 4.09 - 5.37 2.73 - 4.34 1.10 - 1.65 Stem 1.25 - 2.21 0.56 - 0.94 3.45 - 7.30 1.03 - 2.69 0.52 - 0.96 Fruit 2.78 - 4.98 0.82 - 1.26 5.48 - 7.40 0.65 - 1.13 0.43 - 0.68
and ash were used as a soil physical amendment, N source, P source and K source, respectively. In addition, all basal fertilizer sources contained huge amount of iron (Fe). The temperature of air and soil in greenhouse was not different between both treatments (data not shown), but, on the average, 3-layers plastic film-covered treatment (high temperature) was approximately 2°C higher during whole growth season.
1. Growth and yield of cucumber
The shoot growth rates were linearly increased until 14 weeks after transplanting (WAT) without any significant difference between both temperatures (Fig. 1), and the slowdown of cucumber growth was observed from 16 WAT. Total shoot weight grown for 20 weeks was 581.9 g plant -1 (leaf + stem + fruit) for optimal and 558.4 for high. Fruit fresh weight and total yield of fruit per 10 a for whole growth season was not significant between both temperature conditions
(Table 3). The fresh weight of each fruit was between 180 to 190 g, and total yield was 18 to 20 Mg 10a -1 .
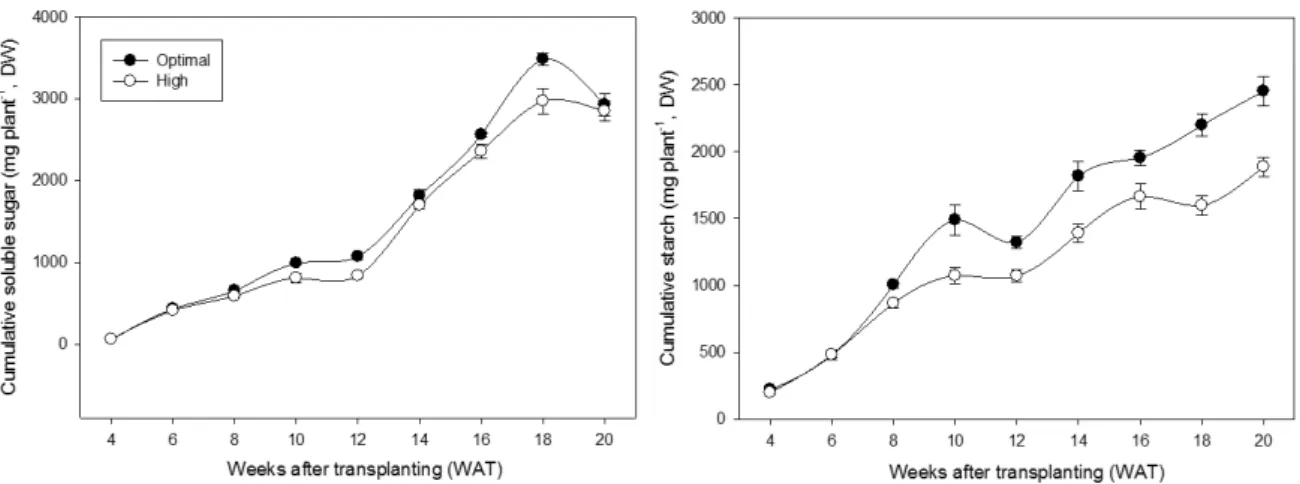
2. Carbohydrates production
Temporal changes in the contents of soluble sugar
and starch from leaf, stem and fruit of cucumber
plant were monitored at every two weeks during the
whole growth season (Fig. 2). Overall, the level of soluble
sugar and starch was slightly greater in optimal
temperature compared to the high. Soluble sugar was
the greatest in leaf, and followed fruit and stem until
early growth stage (6 WAT), after that time point, the
level in fruit was kept the highest, which ranged from
4.2 to 7.3 mg g -1 in optimal and from 3.7 to 6.2 in
high, on the other hand, the level in leaf was sharply
declined at 8 WAT and constantly maintained low
until the end of growth season (from 1.1 to 2.1 mg g -1
in optimal and from 0.7 to 1.4 in high). Soluble sugar
in stem showed similarly with leaf, which represented
a drastic decline. A tendency of starch level was
4 6 8 10 12 14 16 18 20
So lu bl e su ga r ( m g g
-1, D W )
0 2 4 6 8 10
Leaf (Optimal) Leaf (High) Stem (Optimal) Stem (High) Fruit (Optimal) Fruit (High)
4 6 8 10 12 14 16 18 20
Star ch ( m g g
-1, DW )
0 5 10 15 20 25