Vol. 30, No. 11 (2020)
601
Facile Synthesis of In
2S
3Modified Ag
3PO
4Nanocomposites with Improved Photoelectrochemical Properties and Stabilities
Yi-Kai Zeng
1, Shenyu Bo
3, Jun-hui Wang
1, Bin Cui
1, Hao Gu
1, Lei Zhu
1,2†and Won-Chun Oh
2†1Key Laboratory for Advanced Technology in Environmental Protection of Jiangsu Province, Yancheng Institute of Technology, Yancheng, 224051, P.R. China
2Department of Advanced Materials Science & Engineering, Hanseo University, Seosan 31962, Republic of Korea
3Suzhou Taicang Ecological Environment Bureau, Taicang City, Suzhou, 215400, P.R. China
(Received September 23, 2020 : Revised October 13, 2020 : Accepted October 14, 2020)
Abstract
In this work, Ag3PO4/In2S3 nanocomposites with low loading of In2S3 (5-15 wt %) are fabricated by two step chemical precipitation approach. The microstructure, composition and improved photoelectrochemical properties of the as- prepared composites are studied by X-ray diffraction pattern (XRD), field emission scanning electron microscopy (SEM), transmission electron microscopy (TEM), X-ray photoelectron spectroscopy (XPS), photocurrent density, EIS and amperometric i-t curve analysis. It is found that most of In2S3 nanoparticles are deposited on the surfaces of Ag3PO4. The as-prepared Ag3PO4/ In2S3 composite (10 wt%) is selected and investigated by SEM and TEM, which exhibits special morphology consisting of lager size substrate (Ag3PO4), particles and some nanosheets (In2S3). The introduction of In2S3 is effective at improving the charge separation and transfer efficiency of Ag3PO4/In2S3, resulting in an enhancement of photoelectric behavior. The origin of the enhanced photoelectrochemical activity of the In2S3-modified Ag3PO4 may be due to the improved charge separation, photocurrent stability and oriented electrons transport pathways in environment and energy applications.Key words
Ag3PO4, In2S3, photocurrent, charge separation, photoelectrochemical property.1. Introduction
Solar energy represents one of the most abundant renewable natural energy but still least harvest resource.
1,2)Recently, photoelectrochemical water splitting by semi- conductor photocatalysts has been considered as an effective route to convert solar energy directly into hydrogen for future renewable energy applications.
3,4)The water splitting process involves two half-cell reactions, the hydrogen evolution reaction (HER) on photocathodes and oxygen evolution reaction (OER) on photoanodes. The latter is usually more complex and sluggish because it requires the removal of four electrons and two protons from two H
2O molecules, which is twice that required for HER. Silver phosphate (Ag
3PO
4), naturally crystallizing in a P4̅3n body-centered cubic structure, is an n-type semiconductor with a direct bandgap of 2.43 eV and an indirect bandgap of 2.36 eV, ensuring that Ag
3PO
4absorbs
solar energy of the wavelength shorter than 530 nm.
5)This material has received considerable attention because of its versatile photooxidation applications such as OER catalysis and oxidation of organic pollutants,
6)which can be traced back to as early as 1988 when Tennakone and co-workers reported the first photocleavage of water using Ag
3PO
4.
7)It is well known that Ag
3PO
4is slightly soluble in aqueous solution, which reduces its structural stability.
Moreover, the conduction band potential of Ag
3PO
4is more positive than that of the hydrogen potential.
8)Thus, Ag
3PO
4absorbs a photon to generate an electron and a hole, and then the electron combines with an interstitial silver ion (Ag
+) to give a silver atom (Ag), which results in the photocorrosion of Ag
3PO
4in the absence of a sacrificial reagent. The appeared black metallic Ag particles would suspend in the photocatalytic reaction systems and attach onto the surface of the Ag
3PO
4catalyst, which would inevitably prevent the visible light absorption and
†Corresponding authors
E-Mail : [email protected] (L. Zhu, Yancheng Inst.Tech.) E-Mail : [email protected] (W.-C. Oh, Hanseo Univ.)
© Materials Research Society of Korea, All rights reserved.
This is an Open-Access article distributed under the terms of the Creative Commons Attribution Non-Commercial License (http://creative- commons.org/licenses/by-nc/3.0) which permits unrestricted non-commercial use, distribution, and reproduction in any medium, provided the original work is properly cited.
decrease the photocatalytic activity.
9)One of the effective ways is to build composite structures by assembling Ag
3PO
4with other semiconductors such as CeO
2,
10)Nb
2O
5,
11)GO,
12)In
2S
313)etc. In those systems, the composites exhibited a better photocatalytic performance compared with the pure Ag
3PO
4and the enhanced photocatalytic activity is attributed to the synergistic effect including the matched bandgap structures, the improved visible light absorption and the enhanced separation rates of photogenerated electron-hole pairs.
Impressively, In
2S
3is an n-type III–VI group chalcogenide semiconductor, which consists of elements with low toxicity.
Moreover, In
2S
3has been demonstrated to be a very promising optoelectronic material,
14)and widely utilized in solar cell,
15)photocatalysis,
16)and PEC water splitting.
17-18)In particular, In
2S
3has favorable bandgap (2.0-2.3 eV), moderate charge transport characters, and relatively negative conduction band edge for photoelectrochemical hydrogen generation.
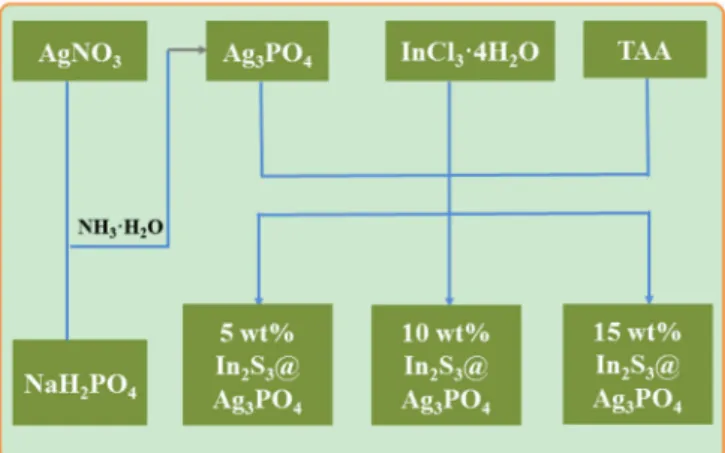
19)Herein, we demonstrate a successful and general procedure to resolve the above problems by the growth of In
2S
3on the surfaces of Ag
3PO
4crystals as shown in Fig. 1. The insoluble In
2S
3could effectively protect the Ag
3PO
4core- crystals from dissolution in aqueous solutions and enhance their stabilities during the photoelectric response process.
Moreover, the experimental results confirm that these novel hetero crystals all exhibit much higher photoelectrochemical activities and stabilities than pure Ag
3PO
4crystals.
2. Experimental Details 2.1 Materials
All of the reagents used in this experiment were analytical reagent grade and without further purification.
2.2 Sample preparation
Tetrahedral Ag
3PO
4mesocrystals were easily prepared via the well-known silver ammonia assisted process. In a typical synthesis, AgNO
3was added into 10 mL of deionized waterto form transparent solution. Subsequently, 3 mL of ammonia water (25 %) was added dropwise into the above solution under stirring.
After stirring for 30 min, 30 mL of NaH
2PO
4(0.5 mol/
L) dissolved solution was then added dropwise into the above solution. The mixture was stirred for 4 h and separated by centrifuge followed by washed with ethanol and deionized water for 3 times, then dried in a vacuum oven at 60
oC.
The In
2S
3modified Ag
3PO
4composites were prepared according to previous report with modification.
20)0.1 g of Ag
3PO
4powder and calculated InCl
3·4H
2O were dispersed in a set volume of ethylene glycol (EG) and ultrasonicated for 0.5 h. A certain amount of thioacetamide
(TAA) was then added into the solution under vigorous stirring for 1h and subsequent heated at 140
oC for 0.5 h under argon gas flowing. The resulting solid product was collected by centrifugation, washed with distilled water, and dried in an oven at 60
oC. In this manner, different weight contents (5 ~ 15 wt%) of In
2S
3in Ag
3PO
4/In
2S
3composites were obtained, respectively. Pure Ag
3PO
4and In
2S
3samples were respectively prepared using the same procedures.
2.3 Characterization
The crystal structures of prepared compounds were performed by X-Ray Diffraction (XRD) with Cu Kα irradiation (X'Pert3, PANalytical), while the morphology and microstructure of the compounds were characterized by Scanning Electron Microscopy (SEM, Nova NanoSEM 450) and Field Emission Transmission Electron Micro- scopy (FE-TEM, JEM-2100F). X-ray photoelectron spec- troscopy (XPS) was conducted to distinguish the chemical state (ThermoScientific, Escalab 250Xi).
2.4 Photoelectric Conversions
The photocurrent and the electrochemical impedance spectra (EIS) of the photocatalysts were obtained using an electrochemical workstation (CHI660E, China). A standard three-electrode system was performed in this photochemical study including counter electrode (Pt foil), reference electrode (saturated Ag/AgCl electrode) and working electrodes (glassy carbon electrode).
21)To prepare the working electrode, 4 mg of catalysts and 30 mL of Nafion solution were dispersed in 1 mL of water-ethanol solution by sonicating for 2 h to form a homogeneous mixture. Then 5 ml of this solution was drop-cast onto a glassy carbon electrode (GCE) with a diameter of 3 mm, and was left to dry at room temperature. 0.1 mol/L sodium sulfate aqueous solution was acted as electrolyte. The simulated light source was a 500 W xenon lamp equipped
Fig. 1. Schematic of the facile fabrication process for Ag3PO4/In2S3 nanocomposite.
with an AM 1.5 G filter operating at an illumination intensity of 100 mWcm
−2. According to the Nernst equation, the potential vs. reversible hydrogen electrode (RHE) could be obtained from the measured potential vs. Ag/
AgCl. The EIS was implemented at 5 mV amplitude and frequency range of 1,000 kHz to 0.1 Hz.
3. Results and Discussion 3.1 Phase and morphology
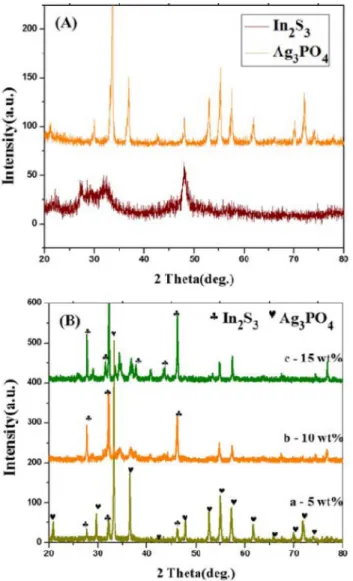
Fig. 2A shows the X-ray diffraction (XRD) patterns of pure Ag
3PO
4nanocrystals and In
2S
3. For pure Ag
3PO
4, all the diffraction peaks could be indexed to the cubic Ag
3PO
4(JCPDS no.06-0505).
22)Diffraction peaks of In
2S
3correspond to tetragonal In
2S
3(JCPDS cards no. 73- 1366).
23)No other miscellaneous peaks appear, suggesting the pure phase nature for the samples. As increasing the
original In
2S
3concentration from 5 wt% to 15 wt%, the Ag
3PO
4/In
2S
3composites exhibits similar diffraction peaks as the pure In
2S
3and Ag
3PO
4as shown in Fig. 2B.
Moreover, it should be noted that the diffraction peaks of Ag
3PO
4in Ag
3PO
4/In
2S
3composites gradually weaken when the In
2S
3content increases, reflecting the decoration of more In
2S
3particles onto Ag
3PO
4surfaces which may prevent photocorrosion of pure Ag
3PO
4.
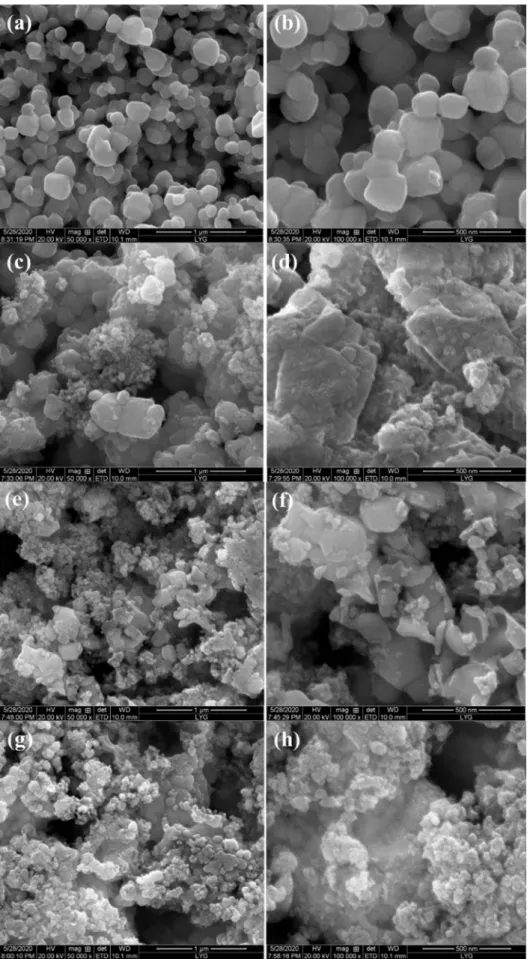
24)SEM was used to investigate the morphology and particle size of the as–prepared samples. As presented in Fig. 3(a,b), Ag
3PO
4particles have an irregular spherical shape, particle size distribution is between 100 to 300 nm.
It is also noticed that most Ag
3PO
4particles have been growth larger after modification with In
2S
3nanoparticles as shown in Fig. 3(c-h), which agreed with the XRD resulsts. After higher temperature treatment, Ag
3PO
4particles were growing into larger size which may provide more substrate for distribution of In
2S
3nanoparticles.
Thus more In
2S
3nanoparticles can be easily dispersed on the surface of Ag
3PO
4. It's worth noting that, while the content of In
2S
3was 10 wt%, the shape of In
2S
3comprises most small particles and some nanosheets as shown in Fig. 3(e, f). The proper morphology was one of the factors that influenced the photoelectric performance of composites under visible light irradiation. These results imply that nanosheet provides considerable effect for enhancing charge transport and visible-light absorption.
25)However, as the content of In
2S
3increases to 15 wt% in Fig. 3(g,h), it clear shows that more nanoparticles of In
2S
3were aggregated together on the surface of Ag
3PO
4. In order to ascertain the detail decoration of In
2S
3on the surface of Ag
3PO
4, a typical Ag
3PO
4/In
2S
3composite (10 wt%) was selected and further investigated by TEM.
Fig. 4a shows that the Ag
3PO
4/In
2S
3composite is special morphology consisting of lager size substrate (Ag
3PO
4), particles and some nanosheets (In
2S
3), in accordance with the SEM results. As shown in Fig. 4(b), it can be clearly observed that some small nanoparticles with size < 25 nm of In
2S
3are highly dispersed on the Ag
3PO
4which size is above 200 nm. Clear observation can find that two phases of In
2S
3and Ag
3PO
4closely contact to form an intimate interface, which favors the charge transfer between In
2S
3and Ag
3PO
4and may promote the separation of photogenerated electron-hole pairs.
3.2 Chemical state
Inder to distinguish the chemical state of Ag
3PO
4/In
2S
3(10 wt%) composite, XPS measurement was performed as shown in Fig. 5. The full XPS spectrum [Fig. 5(a)]
indicates that the Ag
3PO
4/In
2S
3composite is mainly composed of In, S, P, O and Ag elements. The XPS peak of C 1 s at 284.8 eV is assigned to residual carbon from the XPS instrument. There were two individual peaks at
Fig. 2. XRD patterns of as-prepared samples: (A) pure Ag3PO4,pure In2S3 ; (B) (a) Ag3PO4/In2S3 5 wt%, (b) Ag3PO4/In2S3 10 wt%, (c) Ag3PO4/In2S3 15 wt%.
Fig. 3. FE-SEM micrographs of as-preparedsamples: (a, b) pure Ag3PO4, (c, d) Ag3PO4/In2S3 5 wt%, (e, f) Ag3PO4/In2S3 10 wt%, (g, h) Ag3PO4/In2S3 15 wt%.
374.0 and 368.0 eV in Fig. 5(b), which could be assigned to 3d
3/2and 3d
5/2of Ag
+respectively.
26)In Fig. 5(c), the P 2p peak was at 133.0 eV, which corresponds to P
5+coming from Ag
3PO
4.
27)For the O 1s XPS spectra shown
in Fig. 5(d), the binding energy of 530.8 eV was attributed to the O
2−in the Ag
3PO
4, while the peak at 532 eV probably corresponded to the hydroxyl group.
28)The two strong peaks at 445.2 and 452.7 eV can be attributed to
Fig. 4. TEM micrographs of as-prepared Ag3PO4/In2S3 10 wt%samples with different resolution (a) 200 nm, (b) 50 nm.Fig. 5. (a) XPS survey spectrum, XPS spectra of (b) Ag 3d, (c) P 2p and (d) O 1s for as-prepared Ag3PO4/In2S3 nanocomposite.
binding energies of In 3d
5/2and In 3d
3/2, respectively.
The peak at 161.5 eV is assigned to the binding energy of the S
2ptransition. These values agree well with the reported data for In
2S
3.
20,29)3.3 Photoelectrochemical performance
It is well known that semiconductors exhibit unique
photoelectric properties owing to their intrinsic band-gap
structure, which provides a simple and economical light-
to electric conversion approach for various energy-related
applications. Therefore, the PEC activities of samples
were investigated by transient photocurrent responses
(Fig. 6) under visible light illuminations at an applied
potential of -0.20 V vs Ag/AgCl in 0.1 M Na
2SO
4aqueous
Fig. 6. Transient photocurrent response (a-e) and Electrochemical impedance spectroscopy (f) of as-prepared samples: (a) pure Ag3PO4, (b) pure In2S3, (c) Ag3PO4/In2S3 5 wt%, (d) Ag3PO4/In2S3 10 wt%, (e) Ag3PO4/In2S3 15 wt%.solutions. As shown in Fig. 6(a,b), the pure In
2S
3exhibit a higher and stable photoelectric current than pure Ag
3PO
4crystals which possess the lowest photoelectric behavior and obvious photocorrosion characteristics. In addition, the visible light response properties of the as- obtained Ag
3PO
4/In
2S
3(5 ~ 15 wt%) composite samples were fairly improved shown in Fig. 6(c-e). Special for Ag
3PO
4/In
2S
3(10 wt%), it exhibits higher and stable photocurrent response characteristics. To perform the trans- portation of photoelectron, we carried out electrochemical impedance spectrum as shown in Fig. 6(f). In general, the smaller slope of arc represents and Ag
3PO
4/In
2S
3(10 wt%) composite exhibits the lowest charge-transfer resistance about 72.5 W. Therefore, the results of EIS and photocurrent response demonstrated that the introduction of In
2S
3was effective to improve the charge separation and the transfer efficiency of Ag
3PO
4/In
2S
3, resulting in the enhancement of its photoelectric behavior.
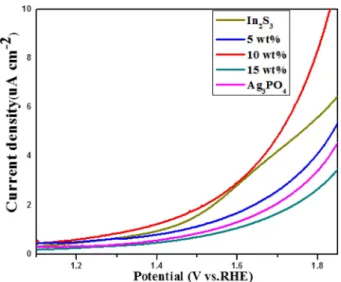
The PEC activities of the as-prepared samples were further investigated by linear sweep voltammetry (LSV) (Fig. 7) under intermittent visible light irradiation with an illumination intensity of 100 mW cm
−2. Apparently, the photocurrents of all the hybrid electrode yield improvement compared with the corresponding pure Ag
3PO
4in a wide potential range of 0 - 1.9 V vs. RHE under visible light irradiation. Compared with Ag
3PO
4nanoparticles, the applied bias photon-tocurrent efficiency of Ag
3PO
4increases efficiently, it achieves sequential improvement by introduction of co-catalyst In
2S
3. On the basis of the above results, we attribute the best PEC performance for Ag
3PO
4/In
2S
3(10 wt%) composite mainly to better electron transport and efficient electron-hole separation.
Above all, it can be clearly seen that the In
2S
3could serve as excellent co-catalyst for Ag
3PO
4to enhance its
photoelectrochemical performance.
4. Conclusion
In summary, a series of novel Ag
3PO
4/In
2S
3composites with different In
2S
3content were successfully prepared.
Most of In
2S
3nanoparticles were grown on surface of Ag
3PO
4through a modified facile solvothermal method.
Ascribed to the good electrical interconnection, exposure of the high-active surface, the Ag
3PO
4/In
2S
3can be directly used as electro and exhibit an excellent response to visible-light, which realized two orders of magnitudes enhancement in PEC activity than pure Ag
3PO
4. In addition, In
2S
3(10 wt%) modified Ag
3PO
4composite exhibits a much higher photocurrent density and stable PEC properties may attribute to its special morphology of In
2S
3which exhibits mixture of nanoparticle and nanosheet.
Acknowledgements
This research was supported by the National Natural Science Foundation of China (11604288) and the Korea Electrotechnology Research Institute (KERI) primary research program through the National Research Council of Science & Technology (NST) funded by the Ministry of Science, ICT (MSIT) (No. 20A01029).
References
1. Z. Fan, H. Razavi, J. W. Do, A. Moriwaki, O. Ergen, Y.
L. Chueh, P. W. Leu, J. C. Ho, T. Takahashi, L. A.
Reichertz, S. Neale, K. Yu, M. Wu, J. W. Ager and A.
Javey, Nat. Mater., 8, 648 (2009).
2. J. S. Chen, J. W. Ren, M. Shalom, T. Fellinger and M.
Antonietti, ACS Appl. Mater. Interfaces, 8, 5509 (2016).
3. X. J. Shi, I. Y. Choi, K. Zhang, J. Kwon, D. Y. Kim, J.
K. Lee, S. H. Oh, J. K. Kim and J. H. Park, Nat.
Commun., 5, 4775 (2014).
4. M. Xu, P. M. Da, H. Y. Wu, D. Y. Zhao and G. F. Zheng, Nano Lett., 12, 1503 (2012).
5. X. G. Ma, B. Lu, D. Li, R. Shi, C. S. Pan and Y. F. Zhu, J. Phys. Chem. C, 115, 4680 (2011).
6. D. J. Martin, N. Umezawa, X. W. Chen, J. H. Ye and J.
W. Tang, Energ. Environ. Sci., 6, 3380 (2013).
7. K. Tennakone, A. H. Jayatissa and W. Wijeratne, J.
Chem. Soc., Chem. Commun., 7, 496 (1988).
8. H. Wang, Y. Bai, J. Yang, X. Lang, J. Li and L. Guo, Chem. Eur. J., 18, 5524 (2012).
9. Y. Bi, S. Ouyang, J. Cao and J. Ye, Phys. Chem. Chem.
Phys., 13, 10071 (2011).
10. Z. M. Yang, G. F. Huang, W. Q. Huang, J. M. Wei, X.
G. Yan, Y. Y. Liu, C. Jiao, Z. Wan and A. Pan, J. Mater.
Chem. A, 2, 1750 (2014).
Fig. 7. Linear sweep voltammetry (LSV) scans for samples in 0.1 mol/L Na2SO4 under illumination with visible light.
11. R. Shao, X. Zeng, Z. Cao, H. Dong, L. Wang, F. Wang, J. Liu, Z. Li and Q. Liang, RSC Adv., 5, 102101 (2015).
12. Q. J. Xiang, D. Lang, T. T. Shen and F. Liu, Appl. Catal., B, 162, 196 (2015).
13. T. J. Yan, J. Tian, W. F. Guan, Z. Qiao, W. J. Li, J. M.
You and B. B. Huang, Appl. Catal., B, 202, 84 (2017).
14. V. G. Rajeshmon, N. Poornima, C. S. Kartha and K. P.
Vijayakumar, J. Alloys Compd., 553, 239 (2013).
15. B. K. Chen, S. Chang, D. Y. Li, L. L. Chen, Y. T. Wang and T. Chen, Chem. Mater., 27, 5949 (2015).
16. X. An, J. C. Yu, F. Wang, C. Li and Y. Li, Appl. Catal., B, 129, 80 (2013).
17. M. A. Ehsan, T. A. Peiris, K. G. Wijayantha, M. M.
Olmstead, Z. Arifin and M. Mazhar, Dalton. Trans., 42, 10919 (2013).
18. L. N. Zhang, W. Zhang, H. B. Yang, W. Y. Fu, M. H. Li and H. Zhao, Appl. Surf. Sci., 258, 9018 (2012).
19. Y. Tian, L. Wang, H. Q. Tang and W. W. Zhou, J. Mater.
Chem. A, 3, 11294 (2015).
20. L. Y. Chen, Z. D. Zhang and W. Z. Wang, J. Phys.
Chem. C, 112, 4117(2008).
21. Y. Li, J. Wang, X. Tian, L. Ma, C. Dai, C. Yang and Z.
Zhou, Nanoscale, 8, 1676 (2016).
22. Y. P. Bi, S. X. Ouyang, J. Y. Cao and J. H. Ye, Phys.
Chem. Chem. Phys., 13, 10071 (2011).
23. Y. Gu, Z. D. Xu, L. Guo and Y. Q. Wan, CrystEngComm, 16, 10997 (2014).
24. L. Cai, H. Jiang and L. X. Wang, Appl. Surf. Sci., 420, 43 (2017).
25. Y. Ma, Z. H. Wang, Y. L. Jia, L. N. Wang, M. Yang, Y.
X. Qi and Y. P. Bi, Carbon, 114, 591 (2017).
26. Y. Y. Chai, L. Wang, J. Ren and W. L. Dai, Appl. Surf.
Sci., 324, 212 (2015).
27. J. Wan, L. Sun, J. Fan, E. Z. Liu, X. Hu, C. N. Tang and Y. C. Yin, Appl. Surf. Sci., 355, 615 (2015).
28. H. Katsumata, T. Sakai, T. Suzuki and S. Kaneco, Ind.
Eng. Chem. Res., 53, 8018 (2014).
29. Y. Liu, H. Xu and Y. Qian, Cryst. Growth Des., 6, 1304 (2006).
Author Information Yi-Kai Zeng
Yancheng Institute of Technolog, Student
Shenyu Bo
Suzhou Taicang Ecological Environment Burea, Assistant Engineer
Jun-hui Wang
Yancheng Institute of Technolog, Student
Bin Cui
Yancheng Institute of Technolog, Student
Hao Gu
Yancheng Institute of Technolog, Student
Lei Zhu
Yancheng Institute of Technology Assistant Professor
Won-Chun Oh
Hanseo University Professor