Nitrogen Isotope Compositions of Synthetic Fertilizer, Raw Livestock Manure Slurry, and Composted Livestock Manure
Sang-Sun Lim1, Sang-Mo Lee2, Seung-Heon Lee3, and Woo-Jung Choi1,4*
1Department of Rural & Biosystems Engineering, Institute of Agricultural Science & Technology, Chonnam National University, Gwangju 500-757, Korea
2National Instrumentation Center for Environmental Management, Seoul National University, Seoul 151-742, Korea
3Rural Research Institute, Korea Rural Community Corporation, Ansan 426-170, Korea
4Environment-Friendly Agriculture Research Center, Chonnam National University, Gwangju 500-757, Korea
To investigate the difference in N isotope ratio (15N/14N, expressed as δ15N) among N sources (synthetic fertilizer, livestock manure, and manure compost), eight synthetic fertilizer, four livestock manure, and thirty-seven compost samples were collected and analyzed for δ15N. The mean δ15N values of N sources were -1.5 ± 0.5‰ (range: -3.9 to +0.5‰) for synthetic fertilizer, +6.3 ± 0.4‰ (+5.3 to +7.2‰) for manure, and +16.0 ± 0.4‰ (+9.3 to +20.9‰) for compost. The lower δ15N of synthetic fertilizer was attributed to its N source, atmospheric N2 of which δ15N is 0‰. Meanwhile, more 15N-enrichment of compost than manure was assumed to be resulted from N isotopic fractionation (faster loss of 14N-bearing compound than 15N) associated with N loss particularly via NH3 volatilization during composting. Therefore, our study shows that δ15N values could successfully serve in discriminating two major N sources (synthetic fertilizer and compost) in agricultural system.
Key words: Livestock manure compost, Nitrogen isotope ratio, Nitrogen isotopic fractionation, Nitrogen source, Synthetic fertilizer
Received : July 14. 2010 Accepted : August 6. 2010
*Corresponding author : Phone: +82625302153 E-mail: [email protected]
Introduction
The N isotope ratio (15N/14N, expressed as δ15N) of nitrogenous compounds have been intensively used in tracing the fate of synthetic fertilizer in soil (Broadbent et al., 1980; Karamanos and Rennie, 1980; Karamanos and Rennie, 1981a, b), plant (Kohl et al., 1973; Meints et al., 1975; Shearer and Legg, 1975; Broadbent et al., 1980), and groundwater (Kreitler, 1979; Flipse and Bonner, 1985; Komor and Anderson, 1993; Feast et al., 1998).
These works are possible due to considerably lower δ15N values of synthetic fertilizer than those of natural soil N.
Since synthetic N fertilizer is produced through the Haber- Bosch process, which uses atmospheric N2 (the δ15N is 0‰) as the reactant, the δ15N values of synthetic fertilizer are close to 0‰. For groundwater, contribution of livestock feedlot to NO3- contamination has been estimated through
δ15N investigation as δ15N values of livestock manure N are higher than those of soil-N via N isotope fractionation (faster reaction of 14N-bearing compounds than 15N-bearing N compounds) during N loss such as ammonia volatilization (Gormly and Spalding, 1979; Heaton, 1984).
More recently, the use of the δ15N of plant tissues as a potential technique to identify the use of synthetic fertilizer in cultivating has been extensively studied in an effort to develop a technique for certification of organic produce that was grown without application of synthetic fertilizers (e.g., Choi et al., 2002; 2003; 2006; Bateman et al., 2005). The principle of this technique is quite similar to that used in identifying NO3- contamination sources of groundwater (Choi et al., 2007); the δ15N of synthetic N fertilizer manufactured from atmospheric N2 using the Haber-Bosch process is usually lower than that of organic source of N fertilizers (e.g. livestock manure and its compost) that can be used in organic farming (Choi et al., 2003). However, up to now, there is limited information on the distribution of δ15N amongst synthetic fertilizer, manure, and compost that is basic data for utilization of δ15N in
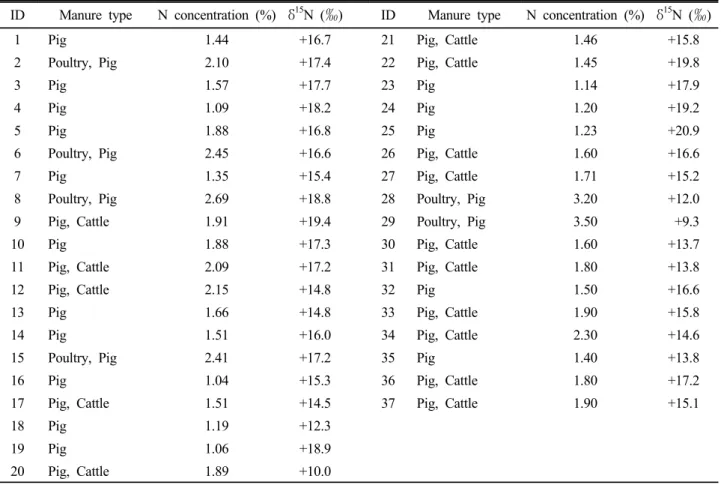
Table 1. Manure type, N concentration, and δ15N of livestock manure composts (n=37).
ID Manure type N concentration (%) δ15N (‰) ID Manure type N concentration (%) δ15N (‰)
1 Pig 1.44 +16.7 21 Pig, Cattle 1.46 +15.8
2 Poultry, Pig 2.10 +17.4 22 Pig, Cattle 1.45 +19.8
3 Pig 1.57 +17.7 23 Pig 1.14 +17.9
4 Pig 1.09 +18.2 24 Pig 1.20 +19.2
5 Pig 1.88 +16.8 25 Pig 1.23 +20.9
6 Poultry, Pig 2.45 +16.6 26 Pig, Cattle 1.60 +16.6
7 Pig 1.35 +15.4 27 Pig, Cattle 1.71 +15.2
8 Poultry, Pig 2.69 +18.8 28 Poultry, Pig 3.20 +12.0
9 Pig, Cattle 1.91 +19.4 29 Poultry, Pig 3.50 +9.3
10 Pig 1.88 +17.3 30 Pig, Cattle 1.60 +13.7
11 Pig, Cattle 2.09 +17.2 31 Pig, Cattle 1.80 +13.8
12 Pig, Cattle 2.15 +14.8 32 Pig 1.50 +16.6
13 Pig 1.66 +14.8 33 Pig, Cattle 1.90 +15.8
14 Pig 1.51 +16.0 34 Pig, Cattle 2.30 +14.6
15 Poultry, Pig 2.41 +17.2 35 Pig 1.40 +13.8
16 Pig 1.04 +15.3 36 Pig, Cattle 1.80 +17.2
17 Pig, Cattle 1.51 +14.5 37 Pig, Cattle 1.90 +15.1
18 Pig 1.19 +12.3
19 Pig 1.06 +18.9
20 Pig, Cattle 1.89 +10.0
identification of N sources (Bateman and Kelly, 2007). In this study, δ15N values of different N sources (synthetic fertilizer, manure, and compost) were investigated to confirm their differences in N isotopic compositions.
Materials and Methods
Sample collection Urea [(NH2)2CO], ammonium sulfate [(NH4)2SO4], and six types of compound fertilizers (N-P2O5-K2O ratio: 11-12-10, 12-8-12, 13-0-13, 15-15-15, 16-0-12, and 21-17-17) were collected. Four livestock manure samples (two pig, one cattle, and one poultry) were taken from the livestock feedlots around Gyonggi and Chonnam Provinces. Thirty-seven samples of commercially available composts were collected from compost manufacturing factories. Manure type of the compost samples are provided with their N concentration and δ15N in Table 1.
Chemical analyses Synthetic fertilizers were digested by permanganate-reduced iron modification of Kjeldahl method to include nitrate and nitrite and steam-distilled with 10 N NaOH (Bremner, 1996). The liberated NH3was
trapped in 0.01 N H2SO4 and titrated with 0.01 N NaOH to determine the amount of NH4+. The pH of the titrated solution was adjusted to 2~3 using 0.1 N H2SO4 or 0.1 N NaOH, and then water in the solution was evaporated to dryness under an infra-red lamp (Hauck, 1982). Nitrogen gas was prepared through the reaction of (NH4)2SO4 and alkaline LiOBr under vacuum (Hauck, 1982). The δ15N values of N2were determined using a stable isotope ratio mass spectrometer of dual inlet type (VG OPTIMA, Micromass, UK).
The manure slurry samples were passed through a Whatman #42 filter paper under suction to remove coarse solid particles. The samples were processed following the same procedure as synthetic fertilizer analysis.
Composts samples were dried with a freeze drier to avoid δ15N changes via N isotopic fractionation associated with NH3 volatilization during drying and the dried samples were ground to a fine powder with a ball mill. The N concentrations and the corresponding δ15N values of the compost samples were determined using a continuous- flow stable isotope ratio mass spectrometer linked with a CN analyzer (IsoPrime-EA, Micromass, UK).
Nitrogen isotope compositions were calculated as
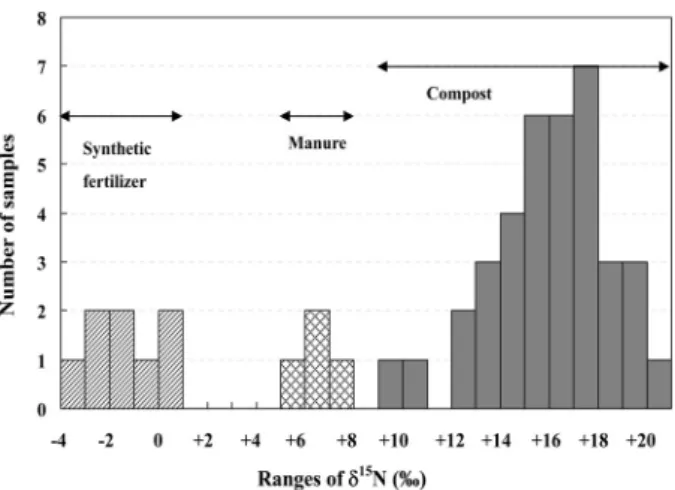
Fig. 1. Histograms of δ15N values of synthetic fertilizer (n=8), manure (n=4), and compost N (n=37). Arrows show the observed range of each N source.
δ15N (‰) = [(Rsample/Rstandard)-1]×1000
where Rsample and Rstandard are the ratio of 15N/14N for sample and standard (atmospheric N2), respectively. The accuracy and reproducibility of measurement checked with a reference material (RM 8548: IAEA-N2) from International Atomic Energy Agency were better than 0.4 and 0.2‰, respectively. All the chemical analyses were triplicated for each sample.
Statistical analysis Statistical analysis was carried out with PASW Statistics (SPSS Inc. Chicago, IL). We report the range, frequency distribution, and means (with standard errors) of δ15N values without statistically based comparison due to the inherent limitation of the study design (pseudo- replicated samples). Pearson correlation analysis was used to examine the relationship between concentration and δ15N of compost N.
Results and Discussion
The mean values of δ15N of synthetic fertilizer, manure, and compost were -1.5 ± 0.5‰ (ranged from -3.9 to +0.
5‰), +6.3 ± 0.4‰ (from +5.3 to +7.2‰), and +16.0 ± 0.
4‰ (from +9.3 to +20.9‰), respectively. Therefore, the δ15N of three sources were clearly separated each other without overlapping; synthetic fertilizers lower than +1.
0‰, manures between +5.0 and +8.0‰, and composts over +9.0‰ (Fig. 1). Around 50% of the 37 compost samples had δ15N between +15.0 and +18.0‰ (Fig. 1).
The δ15N values of synthetic fertilizers (-3.9 ~ +0.5‰) observed in this study were in good agreement with other studies. Overall, the δ15N values for synthetic fertilizer are
between -8.0 and +6.2‰with 90% ranging from –3.0‰ to +2.0‰ (Freyer and Aly, 1974; Kreitler, 1977; Mariotti and Letolle, 1977; Kreitler et al., 1978; Bateman and Kelly, 2007). Such a relatively low δ15N of synthetic fertilizer reflects their N source; atmospheric N2 which has a δ15N value of 0‰, and the differences in δ15N among fertilizers are generally considered a result of fractionation during subsequent processing of the N fixed through the Haber-Bosch process (Flipse and Bonner, 1985).
The δ15N of cattle and pig manure slurry ranging from +5.3 to +7.2‰ suggests that the manure samples have been experienced with N loss (particularly via NH3
volatilization) to some degree that causes N isotopic fractionation as original N excreted from animal is depleted in 15N, while N incorporated into protein retaining in animal body is enriched in 15N (Kreitler, 1975 Gormly and Spalding 1979). For examples, Kreitler (1975) reported that δ15N of the original urea in the excreted N was -3.5‰.
Gormly and Spalding (1979) have also shown that δ15N of fresh animal manure was not different from δ15N of soil- or fertilizer-derived N (<+5.0‰). Because of high urea-N concentration (accounts for up to 50% of total N) in livestock manure, volatilization of NH3 following urea hydrolysis is the predominant pathway of N loss from manure after excretion (Kerley and Jarvis, 1996). It has been shown that the ratio of 14NH3 to 15NH3 volatilization rate is between 1.020 and 1.029, indicating that volatilization of
14NH3 is faster than 15NH3 by 2.0 to 2.9% (adopted from Chang and Choi, 2009). Choi (2002) demonstrated 15N enrichment of manure slurry by NH3volatilization through a laboratory incubation study with human, pig, and cattle manure; δ15N of manure N increased from +11.8 to +16.
7‰ for human manure, +10.3 to +51.4‰ for pig manure, and +7.2 to +33.1‰ for cattle manure with decreasing NH4+ concentration in the manure samples.
Enrichment of 15N in N derived from manure can further progressed during composting as around 50% of N in the manure can be lost mainly via NH3volatilization (Hao et al., 2004; Larney et al., 2006). In our study, the higher δ15N of compost than raw manure could be an indicative of the 15N enrichment resulting from N isotopic fractionation associated with N loss (Fig. 1). Meanwhile, variation in δ15N compost might be due to the different magnitude and extent of NH3 volatilization among composts being affected by composting conditions and materials used. Kim et al. (2008) found that δ15N of N in cattle manure composting mixture increased from +7.8‰
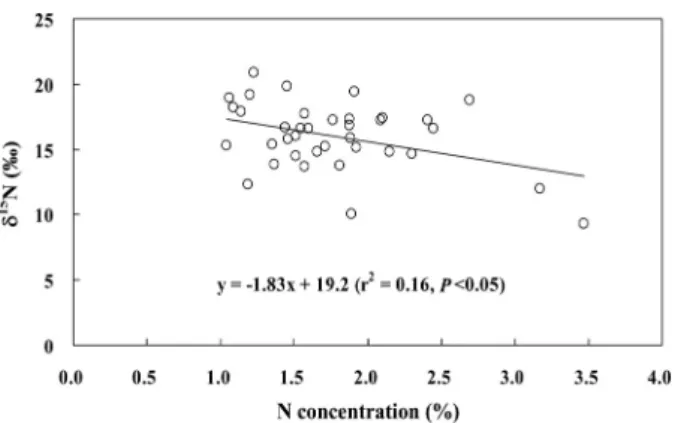
Fig. 2. Relationship between N concentration and corresponding δ15N of livestock manure composts (n=37).
at the initiation of composting to +9.9‰ when rice hull was used as bedding material and from +11.4 to +14.3‰
when saw dust was mixed with the manure. They attributed such different pattern to contrasting characteristics of rice hull and saw dust in terms of their δ15N and decomposability.
The negative correlation between N concentration and the corresponding δ15N of compost N is also notable (Fig. 2).
This relationship suggests that δ15N of compost increases with decreasing N concentration due to 15N enrichment of compost via N loss.
Conclusions
The fact that δ15N values of compost were higher than those of synthetic fertilizer suggests that application of compost to fields may result in different δ15N of nitrogenous compounds in soil-plant-groundwater system, compared with synthetic fertilizer application. Therefore, this study shows the potential use of δ15N technique in discriminating compost-derived N and fertilizer-derived N in agricultural system.
Acknowledgements
This study was funded by the Technology Development Program for Agriculture and Forestry of the Ministry for Food, Agriculture, Forestry and Fisheries, Republic of Korea. Institute of Agricultural Science & Technology, Chonnam National University provided assistance with the samples preparation. Nitrogen isotope analysis was fulfilled with the support by the Ministry of Education, Science and Technology, Republic of Korea (2010) (“The Support Program for the Advancement of National
Research Facilities and Equipment”). The authors thank to Mr. Yong-Se Park at National Instrumentation Center for Environmental Management, Seoul National University for the operation of the Stable Isotope Ratio Mass Spectrometer (IsoPrime-EA, NFEC-1999-07-019779).
References
Bateman, A.S. and S.D. Kelly. 2007. Fertilizer nitrogen isotope signatures. Isot. Environ. Healt. S. 43:237-247.
Bateman, A.S., S.D. Kelly, and T.D. Jickells. 2005. Nitrogen isotope relationships between crops and fertilizer: implications for using nitrogen isotope analysis as an indicator of agricultural regime. J. Agr. Food Chem. 53:5760-5765.
Bremner, J.M. 1996. Nitrogen-total. p. 1085-1121. In D.L.
Sparks et al. (ed.) Methods of Soil Analysis. Part 3. Chemical Methods, American Society for Agronomy, Madison, Wisconsin, USA.
Broadbent, F.E., R.S. Rauschkolb, K.A. Lewis, and G.Y. Chang.
1980. Nitrogen-15 enrichment of soils and soil-derived nitrate. J. Environ. Qual. 2:363-365.
Chang, S.X. and W.J. Choi. 2009. Applications of the stable nitrogen isotope technique in studying ecosystem processes.
p. 148-171. In: Lectures in Modern Ecology (IV): Theory and Applications, Higher Education Press, Bejing, China.
Choi, W.J. 2002. Natural 15N abundances and source identification of nitrogen in soil-plant-groundwater system as affected by chemical fertilizer and composted manure. Ph.D. Thesis, Seoul National University, Suwon, Korea.
Choi, W. J., H.M. Ro, and E.A. Hobbie. 2003. Patterns of natural 15N in soils and plants from chemically and organically fertilized uplands. Soil Biol. Biochem. 35:1493-1500.
Choi, W.J., M.A. Arshad, S.X. Chang, and T.H. Kim. 2006.
Grain 15N of crops applied with organic and chemical fertilizers in a four-year rotation. Plant Soil. 284:165-174.
Choi, W.J., S.M. Lee, H.M. Ro, K.C. Kim, and S.H. Yoo. 2002 Natural 15N abundances of maize and soil amended with urea and composted pig manure. Plant Soil. 245:223-232.
Choi, W.J., G.H. Han, S.M. Lee, G.T. Lee, K.S. Yoon, S.M.
Choi, and H.M. Ro. 2007. Impact of land-use types on nitrate concentration and 15N in unconfined groundwater in rural areas of Korea. Agricul. Ecosyst. Environ. 120:259-268.
Feast, N.A., K.M. Hiscock, P.F. Dennis, and J.N. Andrews.
1998. Nitrogen isotope hydrochemistry and denitrification within the Chalk aquifer system of north Norfolk, UK. J.
Hydrol. 211:233-252.
Flipse, Jr. W.J. and F.T. Bonner. 1985. Nitrogen-isotope ratios of nitrate in ground water under fertilized fields, Long Island, New York. Ground water. 23:59-67.
Freyer, H.D. and A.I.M. Aly. 1974. Nitrogen-15 variations in fertilizer nitrogen. J. Environ. Quality. 3:405-406.
Gormly, J.R. and R.F. Spalding. 1979. Sources and concentrations of nitrate-nitrogen in ground water of the Central Platte Region, Nebraska. Ground Water.3:291-301.
화학비료, 가축분뇨 및 퇴비의 질소동위원소비
임상선1·이상모2·이승헌3·최우정1,4*
1전남대학교 농업생명과학대학 지역바이오시스템공학과, 2서울대학교 농생명과학공동기기원,
3한국농어촌공사 농어촌연구원, 4전남대학교 친환경농업연구사업단
화학비료, 가축분뇨 및 퇴비 등 주요 질소원의 질소동위원소비 (δ15N) 차이를 조사하기 위해 각각 8, 4, 37점의 시료를 채
취하여 δ15N을 분석하였다. 평균 δ15N 값은 화학비료가 -1.5 ± 0.5‰ (범위: -3.9~+0.5‰‰), 가축분뇨가 +6.3 ± 0.4‰
(+5.3~+7.2‰), 가축분퇴비가 +16.0 ± 0.4‰ (+9.3~+20.9‰)였다. 화학비료가 타 질소원에 비해 δ15N 값이 낮은 것은 화학비료 제조시 이용하는 질소원인 대기 N2의 δ15N 값 (0‰)을 반영하기 때문이다. 반면, 가축분에 비해 퇴비의 δ15N 값 이 높은 것은 퇴비화 과정 중 일어나는 질소손실 (특히, 암모니아 휘산)과 관련된 질소동위원소분할효과 (14N의 손실속 도>15N의 손실속도)에 의한 퇴비 중 15N 농축에 의한 결과로 판단된다. 따라서, 본 연구는 δ15N 분석을 통해 현재 우리나라 농업 시스템에서 가장 널리 이용되고 있는 두 가지 질소원 (화학비료와 퇴비)을 구분할 수 있음을 보여준다.
Hao, X., C. Chang, and F.J. Larney. 2004. Carbon, nitrogen balances and greenhouse gas emission during feedlot manure composting. J. Environ. Qual. 33:37-44.
Hauck, R.D. 1982. Nitrogen-isotope ratio analysis. p. 735-779.
In: AL. Page et al. (ed.) Methods of Soil Analysis. Part 2:
Chemical and Microbiological Properties, American Society of Agronomy and Soil Science Society of America, Madison, Wisconsin, USA.
Heaton, T.H.E. 1984. Sources of nitrate in phreatic groundwater in the western Kalihari. J. Hydrol. 67:249-259.
Karamanos, R.E. and D.A. Rennie. 1980. Variations in natural nitrogen-15 abundances as an aid in tracing fertilizer nitrogen transformations. Soil Sci. Soc. Am. J. 44:57-62.
Karamanos, R.E. and D.A. Rennie. 1981a. The isotope composition of residual fertilizer nitrogen in soil column.
Soil Sci. Soc. Am. J. 45:316-321.
Karamanos, R.E. and D.A. Rennie. 1981b. Changes and significance in natural 15N abundance in residual nitrogen fertilizer studies. Can. J. Soil Sci. 61:553-559.
Kerley, S.J. and S.C. Jarvis. 1996.Preliminary studies on the impact of excreted N on cycling and uptake of N in pasture systems using natural abundance stable isotope discrimination.
Plant Soil. 178:287-294.
Kim, J.Y., W.J. Choi, S.S. Lim, J.H. Kwak, S.X. Chang, H.Y.
Kim, K.S. Yoon, and H.M. Ro. 2008. Changes in nitrogen isotopic compositions during composting of cattle feedlot manure: effects of bedding material type. Bioresour. Technol.
99:5452-5458.
Kohl, D.H., G.B. Shearer, and B. Commoner. 1973. Variation of
15N in corn and soil following application of fertilizer
nitrogen. Soil Sci. Soc. Am. Proc. 37:888-892.
Komor, S.C. and Jr. H.W. Anderson. 1993. Nitrogen isotope as indicator of nitrate sources in Minnesota sand-plain aquifers.
Ground water. 31:260-270.
Kreitler, C.W. 1975. Determining the source of nitrate in ground water by nitrogen isotope studies. Report of Investigations No 83. Bureau of Economic Geology, University of Texas, Austin, Texas, USA.
Kreitler, C.W. 1977. Nitrogen isotopes of soil and ground water nitrate, Lockhart and Taylor alluvial fans, central Texas.
Geol. Soc. Am. 96:1058-1059.
Kreitler, C.W. 1979. Nitrogen-isotope ratio studies of soils and ground water nitrate from alluvial fan aquifers in Texas. J.
Hydrol. 42:147-170.
Kreitler, C.W., S.E. Ragone, and B.G. Katz. 1978. N15/N14 ratios of ground-water nitrate, Long Island, New York.
Ground Water. 16:404-409.
Larney, F.J., D.M. Sullivan, K.E. Buckley, and B. Eghball.
2006. The role of composting in recycling manure nutrients.
Can. J. Soil Sci. 86:597-611
Mariotti, A. and R. Letolle. 1977. Application of nitrogen- isotope studies to hydrology and hydrogeology: analysis of the peculiar case of the Melarchez Basin (Seine-et-Marne, France). J. Hydrol. 33:157-172.
Meints, V.W., L.V. Boone, and L.T. Kurtz. 1975. Natural 15N abundance in soil, leaves and gains as influenced by long- term additions of fertilizer N at several rates. J. Environ.
Qual. 4:486-490.
Shearer, G.B. and J.O. Legg. 1975. Variations in the natural abundance of 15N of wheat plants in relation to fertilizer nitrogen application. Soil Sci. Soc. Am. Proc. 39:896-901.