Condensation Heat Transfer Characteristics of Hydrocarbon Refrigerants in Horizontal Tubes of 7.73 mm and 5.80 mm
CHANGHYO SON
†School of Mechanical Engineering, Pukyong National Univ.
San 100 Yongdang-dong Nam-gu Busan-si 608-739, Korea
7.73 mm와 5.80 mm 수평관내 탄화수소 냉매의 응축 열전달 특성
손창효
†부경대학교 기계공학부
ABSTRACT
본 논문은 내경 7.73 mm 와 5.80mm 의 수평관내 프레온계 냉매 R-22 와 탄화수소계 냉매 R-290 과 600a 의 응축 열전달 계수의 실험적 결과를 나타내었다 . 실험장치는 압축기 , 응축기 , 팽창밸브 , 증 발기 등으로 구성된다 . 응축 실험은 질량유속 35.5 ~ 210.4 kg/m2s 이고 , 응축온도 40℃ 인 조건에서 수 행하였다 . 주요 결과를 요약하면 다음과 같다 . 탄화수소계 냉매 R-290 과 R-600a 의 평균 열전달 계수 는 프레온계 냉매 R-22 보다 높게 나타났으며 , R-600a 의 평균 열전달 계수가 모든 관경에 대해 가장 높게 나타났다 . 실험결과와 종래의 상관식을 비교한 결과 , 모든 관경과 냉매에 대해 Haraguchi 등의 상관식이 가장 좋은 일치를 보였다 . 그 중에서 Cavallini-Zecchin 의 상관식은 7.73 mm 관경의 실험데 이터와 , Dobson 등의 상관식은 내경 5.80 mm 관경의 데이터와 좋은 일치를 보였다 .
KEY WORDS : alternative refrigerant( 대체냉매 ), condensation heat transfer coefficient( 응축열전달계 수 ), hydrocarbon refrigerant( 탄화수소냉매 )
†
Corresponding author : [email protected] Nomenclature
Cp : specific heat at constant pressure, kJ/kgK
d : diameter, mm G : mass flux, kg/m
2s
h : heat transfer coefficient, kW/m
2K i : enthalpy, kJ/kg
m : mass flow rate, kg/h n : number of local tube P : Pressure, kPa
q : heat flux, kW/m
2Q : heat capacity, kW
T : temperature, K
x : quality
Subscripts avg : average
c : condenser
cr : refrigerant of condenser cw : cooling water
eq : equivalent
exp : experimental value i : inner
in : inlet loc : local o : outer out : outlet v : vapor phase wi : inside tube wall
1. Introduction
The use of HCFCs in new refrigeration equipments will be banned world wide in the near future. Because developments in technology have gone much faster than expected after the legislation on CFCs and green house gases including HCFCs was passed. And it has already been suggested that HFCs may be decomposed by sunlight in the troposphere and form acid and poisonous substances. Montreal (1987) was followed by London(1990) and Copenhagen(1992), and in Copenhagen not only the termination of the production of CFCs by January 1, 1995, in the industrial countries has been decided, but also a phase-out schedule for the HCFCs
1).
HCs (Hydrocarbons) are well known flammable working fluids with favorable thermodynamics properties and material compatibility. They include propane, butane and their mixtures. The only important disadvantage of hydrocarbon refrigerants is that they are combustible, with a very low ignition concentration limit, and this drawback has been
blown up to unreasonable proportions. In fact, they are popular fuels available everywhere and used with simple precautions even in private home. With reasonably careful design it must be even more simply to ensure safety in a hermetic closed refrigeration circuit. Direct cooling is possible in small systems, when the charge is low enough to avoid any explosion risk in rooms where leakage may occur
2). At present, hydrocarbons are not accepted as substitutes for refrigerants in the United States because of their flammability. However, thermodynamic properties of hydrocarbons, such as propane, are similar to those of R-12 and R-22. Another advantage of hydrocarbons is their solubility in mineral oil, which is traditionally used as a lubricant in the compressors.
This study aims to concentrate in the hydrocarbon refrigerants R-600a, R-290, in order to develop the technology and expand the knowledge based on natural working fluids in compression heat pumping systems. Especially, focusing on the characteristics of condensation, which is the basis for the optimum condenser design for heat pump cycles using R-22 as a natural refrigerant. For the purpose of the study, we made a basic heat pump apparatus with a horizontal tube-in-tube type condensers used smoothed tube. It will confirm applicability of natural refrigerants to regulate refrigerant R-22, support presentation of alternative refrigerant data for optimum design in the refrigeration and air-conditioning systems.
2. Experimental Apparatus and Methods 2.1 Test Facility
Fig. 1 shows the schematics of the experimental
apparatus including basic air-conditioning and
Fig. 1. Schematic diagram of the experimental apparatus
Fig. 2 Schematic diagram of test section
refrigerating system consisting of a compressor, a condenser, an expansion valve, a condenser and a peripheral device such as an oil separator, a receiver, an accumulator and so on. The system
also consists of two main flow loops: a refrigerant loop and a secondary heat source water circuit involving either condensation or condensation loop.
Refrigerant loop : The refrigerant circuit uses an
open-drive, two-cylinder reciprocating compressor
driven by a variable-speed, 1492 W (2 HP)
electric motor. A compressor originally designed
for R-22 was used in the experiments and was
connected by an inverter, which can alter the
revolutions per minute of the compressor. And
digital tacho/ratio meter which can measure the
revolutions per minute and torque, is install in the
compressor. The suction line to the compressor
contains an electrically heated refrigerant
superheater to maintain a constant return gas
temperature to the compressor if required.
Parameters R-22 R-290 R-600a Test section Horizontal smooth copper tube I.D. of test section, mm
(O.D. of test section, mm) 7.73(9.52), 5.80(6.35) Mass flux, (kg/m2s) 50.0~210.4 35.5~165.
1
35.5~178.
8 Condensation
Temperature, (℃) 40
Cooling capacity, (kW) 0.95~10.1 Table 1 Experimental conditions of parameters
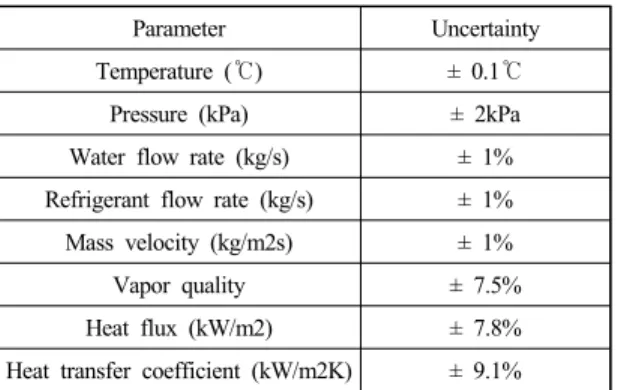
Parameter Uncertainty
Temperature (℃) ± 0.1℃
Pressure (kPa) ± 2kPa
Water flow rate (kg/s) ± 1%
Refrigerant flow rate (kg/s) ± 1%
Mass velocity (kg/m2s) ± 1%
Vapor quality ± 7.5%
Heat flux (kW/m2) ± 7.8%
Heat transfer coefficient (kW/m2K) ± 9.1%
Table 2 Parameters and estimated uncertaintis
Heat source water loop : The source water circuit of condenser also contains a circulating pump, mass flowmeter, and electric heater. The source water temperature is controlled by partial heat rejection to a chilled-water system in a separate heat exchanger. Water flow rates into the condenser can also be regulated by adjusting the by-pass line.
2.2 Test Section
In the test section of the experiment, the condenser is a double-tube type heat exchanger divided into two sections, which are inner tube and annular region. The refrigerant flows through the inside of copper tube and the cooling water flows through the annulus in the counterflow direction. The detail of heat exchanger (test section) is shown in Fig. 2. The tubing of the refrigerant loop is made of smooth copper tube with a nominal I.D. of 7.73 mm and 5.80 mm. The heat exchanger consists of ten subsections of 500 mm length. The shape of the refrigerant tube through the U-bend is double-tube type with identical bending to avoid a detour. As shown in Fig. 2, water flows counter-currently in the annulus test section of the double-tube heat exchanger, while
refrigerant is condensed inside the test tube.
The outer tube is made of a clear polyvinyl chloride (PVC) tube. The test section is insulated by using a rubber to minimize heat exchange to ambient. Temperature, pressure and mass flow rates are measured during the tests as follows :
Temperature : Three types of temperature sensor are used in the experiment. The refrigerant temperatures are measured by T-type thermocouples ( φ 0.5 mm) at the inlet and outlet of each subsection. The temperature of cooling water at the inlet and outlet of subsection are measured using Pt 100 sensors in order to determine the heat transfer rate in the test section. T-type fine thermocouples with a tip diameter 0.1 mm are soldered onto the copper tube’s surface to measure the wall temperature of the top, side and bottom of test tube.
Pressure : The pressure at the inlet and outlet
of each subsection is measured with a pressure
transducer. The pressure drop of the test section
is obtained from the difference of measured
pressure at the inlet and outlet. According to the
calibration before shipment, its divergence with
standard value is found less than 0.001 MPa over the full measurement scale.
2.3 Experimental condition
The test conditions in this study are summarized in Table 1. The mass flux values in Table 1 are different for some of the refrigerants. This is because the system driven by compressor is difficult to control the mass flux of each refrigerant. Especially, because the specific volume of R-600a and R-290 is higher than that of R-22, it is very difficult to control the given mass flux of hydrocarbon refrigerants.
The uncertainties of the measured and calculated parameters are tabulated in Table 2.
2.4 Data Reduction
The thermo-physical properties of R-22, R-290 and R-600a were calculated using REFPROP (version 6.01), a thermo-physical property calculation program developed by NIST. The main equations used in processing the raw data were based on energy balances.
The amount of heat exchanged in the condenser can be given by :
)
(
, ,,cw cout cin p
cw
cw
m c T T
Q = ⋅ ⋅ − (1)
) (
c,in c,outcr
cr
m i i
Q & = & ⋅ − (2)
In case of the condensation process, we needed to calculate a local heat transfer coefficient toward circumferential direction of the tube, since it has many influences on the system, and hc,loc is defined as follows :
cr wi c loc c
c
T T
h q
= −
,
,
(3)
where, Tcr and Tc,wi are refrigerant temperature and the inner wall temperature of the inner tube. qc is heat flux shown in Eq. (4).
z d q Q
i c
= ⋅
cw⋅ ∆
π (4)
3. Results and Discussions 3.1 Flow Pattern Map
Several researchers
3,4)have tried to visualize the flow pattern in horizontal tubes to investigate the flow mechanism. Most of their studies were significant gaps in the understanding of two-phase flow regimes in horizontal round tubes. Specifically, the effect of tube diameter on flow pattern transitions was not well understood, with conflicting trends reported by different investigators. Therefore, to evaluate flow characteristics with the experimental data for the differently smooth and round tubes, the flow pattern maps on various tubes are needed. This study was applied to the representative flow pattern map of Taitel &
Dukler
5). Based on experimental data of Mandhane et al, They investigated theoretically for the flow pattern during condensation process in horizontal tubes. Their flow regime map is adequately considered to the effect of refrigerant properties and tube diameter. It is useful for predicting flow pattern during condensation inside horizontal tubes.
Fig. 3 shows the comparison of the present
data with existing visual study for change flow
plotted on the Taitel & Dukler. As condensation
proceeds, all test runs start from the left side of
the graph and move to the right. With the
Χ
10
-310
-210
-110
010
110
2K
10
010
110
210
310
4T or F
10
-310
-210
-110
010
1 Annular-dropletsflow
Stratified wavy flow
Stratified smooth flow Bubbly
flow
Intermittent flow
a
a d
d
c c
b
b
Gcr increasex increase
di= 5.80 mm di= 7.73 mm
Fig. 3 Comparison of the present data with existing visual study for change flow plotted on the Taitel & Dukler’s flow map
0.0 0.1 0.2 0.3 0.4 0.5 0.6 0.7 0.8 0.9 01.0 1 2 3 4
x h
c,loc[k W/ m
2K]
R-22
7.73 mm (Gcr = 52.5 kg/m2s) 5.80 mm (Gcr = 50.3 kg/m2s)
Fig. 4 Local condensation heat transfer coefficients of R-22 with respect to vapor quality
increase of the mass flux and vapor quality, the flow pattern moved to the annular flow regime.
Most of the experimental data of four tubes were placed in the annular flow regime except for lower quality and mass flux. For the same condition, the experimental data for 5.8 mm show faster annular flow transition than those for 7.73 mm.
From this result mentioned earlier, annular flow is almost dominated the major of condensation flow at the vapor quality of x≥0.3
∼0.4 and it can be considered importantly for heat transfer and pressure drop characteristics in four diameter tubes. Moreover, we detected an earlier transition into the annular flow in smaller tubes. It is believed that flow mechanisms in smaller diameter round tubes are different from those in larger diameter tubes primarily due to the surface tension between liquid and gas phase. The particular flow regime established by a given combination of liquid and gas phase
velocities in horizontal tubes depends upon the interaction of gravity, shear (inertia) and surface tension forces. Particularly, the effect of tube diameter is an important parameter as recognized by Wambsganss et al
6). Therefore, addition works are needed to develop the flow pattern and investigate the flow mechanism in a variety of tube diameters.
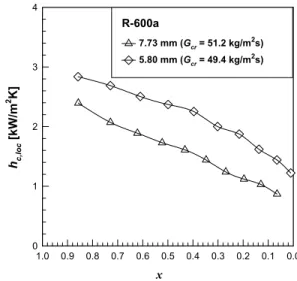
3.2 Local condensation heat transfer Fig. 4∼6 shows the variation of the local condensation heat transfer coefficient with respect to refrigerant qualities and inner diameter tubes. The mass flux values in Fig.
4 ~ 6 are different for some of the refrigerant. As mentioned earlier, the compressor is difficult to control exactly the mass flux of each refrigerant.
As shown in Fig. 4∼6, the local condensation heat transfer coefficients for all refrigerants and diameter tubes decrease as the quality decreases.
In general, in the annular flow regime, the local
condensation heat transfer coefficients gradually
0.0 0.1 0.2 0.3 0.4 0.5 0.6 0.7 0.8 0.9 01.0 1 2 3 4
x h
c,loc[kW/m
2K]
R-290
7.73 mm (Gcr = 62.4 kg/m2s) 5.80 mm (Gcr = 50.0 kg/m2s)
Fig. 5 Local condensation heat transfer coefficients of R-290 with respect to vapor quality
0.0 0.1 0.2 0.3 0.4 0.5 0.6 0.7 0.8 0.9 01.0 1 2 3 4
x h
c,loc[kW/m
2K]
R-600a
7.73 mm (Gcr = 51.2 kg/m2s) 5.80 mm (Gcr = 49.4 kg/m2s)
Fig. 6 Local condensation heat transfer coefficients of R-600a with respect to vapor quality
decrease as the quality decreases, which is the result of the annular film thickness increasing as condensation process. This trend can be explained by the increase in the thermal resistance with increasing liquid film thickness and the reduced velocity due to the change from vapor to liquid. The local condensation heat transfer coefficients of all refrigerants increase as inner diameter tube decreases. It is predicted that this resulted from diminishing of liquid film of annular flow and fast transition from stratified flow or wavy flow to annular flow in small diameter tubes.
As can be seen in Fig. 5, the local condensation heat transfer coefficient of R-290 increases in decrease of inner diameter tube, which is more evident over a wide range of quality. The local condensation heat transfer coefficient of R-290 with the change of vapor quality decreases sharply to that of R-22. As shown in Table 3, this is because the thermal conductivity of R-290 is higher than that of
R-22. As can be seen in Fig. 6, the local condensation heat transfer coefficient of R-600a for all diameter tubes is greatly higher than R-22, and is slightly higher than R-290.
As can be seen in Fig. 4∼6, the local condensation heat transfer coefficients of hydrocarbons refrigerants (R-290 and R-600a) are greatly higher than Freon refrigerants (R-22) as inner diameter tube decreases.
Therefore, it is very advantageous to apply the condenser of refrigeration and air-conditioning applications using hydrocarbon refrigerants to a small diameter tube.
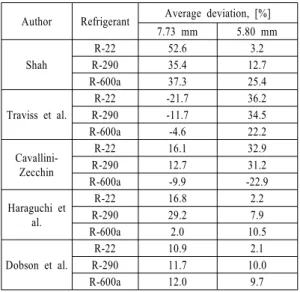
3.3 Comparison with other correlations Several correlations available in research literature have been verified for use with various refrigerants. Some of these correlations are described in this study. They are the correlation by Haraguchi et al.
7), Cavallini-Zecchin
8), Traviss et al.
9), Shah10) and Dobson et al
11).
Table 4 shows the average deviation of
Refrigerant
R-22 R-290 R-600a Thermophysica
l property
Refrigerant phase
Saturation temperature Density,
[kg/m3]
Liquid
40 1129 467.3 554.7
Vapor 66.19 30.21 9.442
Viscosity, [10-6Pa·s]
Liquid
40 139.4 82.49 138.5
Vapor 13.52 9.415 8.070
Thermal conductivity,
[mW/m·K]
Liquid 40
0.0768
8 0.0858 0.1012
Vapor 0.0130
2 0.0215
2 0.01818 Surface
tension, [N/m]
- 40 0.0060
4 0.0052
1
0.00100 9 Table 3 Thermophysical properties of refrigerants used in this study
Author Refrigerant Average deviation, [%]
7.73 mm 5.80 mm Shah
R-22 52.6 3.2
R-290 35.4 12.7
R-600a 37.3 25.4
Traviss et al.
R-22 -21.7 36.2
R-290 -11.7 34.5
R-600a -4.6 22.2
Cavallini- Zecchin
R-22 16.1 32.9
R-290 12.7 31.2
R-600a -9.9 -22.9
Haraguchi et al.
R-22 16.8 2.2
R-290 29.2 7.9
R-600a 2.0 10.5
Dobson et al.
R-22 10.9 2.1
R-290 11.7 10.0
R-600a 12.0 9.7
Table 4 Average deviation of experimental data and some correlations