Article http://dx.doi.org/10.14478/ace.2015.1005
국내 주요도시 주변의 바이오매스 에너지 잠재량 분석
국진우⋅이시훈†
전북대학교 자원에너지공학과
(2015년 1월 16일 접수, 2015년 2월 12일 심사, 2015년 2월 14일 채택)
Analysis of Biomass Energy Potential around Major Cities in South Korea
Jin Woo Kook and See Hoon Lee
†Department of Resources and Energy Engineering, Chonbuk National University, Jeonju, Korea (Received January 16, 2015; Revised February 12, 2015; Accepted February 14, 2015)
초 록
바이오매스 자원은 고체, 액체, 기체 등의 다양한 형태의 에너지 자원으로 전환되어 이용될 수 있기 때문에 필수적인 재생에너지 자원으로 여겨지고 있다. 더불어 바이오매스는 화석 연료의 고갈과 지구 온난화를 해결할 수 있는 방법으 로도 각광을 받고 있다. 바이오매스 에너지 전환 플랜트의 규모를 결정하고 경제성을 분석하기 위해서는 지역 내의 바이오매스 에너지 잠재량과 에너지 밀도에 대한 정보가 유용하게 이용될 수 있다. 농업 폐기물, 임업 폐기물, 축산 폐기물, 도시생활 폐기물 등의 국내 에너지 잠재량과 에너지 밀도를 정부 및 연구 기관들이 발표한 최신 자료를 수집 하여 분석되었다. 바이오매스 자원을 확보하기 위한 지역이 증가할수록 에너지 잠재량은 증가하나 에너지 밀도는 감 소하는 것으로 나타났다.
Abstract
Biomass is recognized as one of important renewable energy sources because it can be converted and used as solid, gaseous and liquid forms. Also, biomass is one of promising ways to solve the depletion of fossil fuels and global warming problems.
The information about local biomass energy potentials and space energy densities can be powerfully utilized to determine the scale of biomass energy conversion plant and to analyze economic effects. The latest data on domestic biomass resources, such as agricultural, forestry, livestock and urban wastes, were collected from various government organizations and institutes and were analyzed to calculate biomass energy potential and space energy density. As local areas in South Korea to collect biomass resources increased, energy potentials increased, but space energy densities of total biomass decreased.
Keywords: Biomass, Energy density, Energy potential, Bio energy
1. Introduction
1)
Energy sources might have been classified in three categories: re- newable sources, fossil fuels and nuclear sources. The energy markets of world depend highly on fossil fuels which consist of coal, petroleum crude and natural gas by sources of power, fuels, and chemicals[1].
However, fossil fuels have severe limit about reserves and millions of years are required to form fossil fuels in the earth. Nuclear sources are relatively abundant, but there are many environmental issues to use nu- clear sources.
The biomass, which is derived from living or recently living organ- isms is similar to fossil fuels because of hydrocarbon contents.
† Corresponding Author: Chonbuk National University, Department of Resources and Energy Engineering, Jeonju, Korea Tel: +82-63-270-2362 e-mail: [email protected]
pISSN: 1225-0112 eISSN: 2288-4505 @ 2014 The Korean Society of Industrial and Engineering Chemistry. All rights reserved.
However, biomass is recognized as one of promising renewable energy sources and is gaining increased public and scientific attention, driven by factors such as oil price spikes and the need for increased energy security. Biomass is potential alternative to fossil fuel, which can be chemically and biochemically treated to convert it to energy. Biomass is often regionally available and conversion into secondary energy car- riers is feasible without high capital investments. Biomass is the most developed renewable energy source providing 35% of the primary en- ergy needs of developing and industrialized countries, respectively[2,3].
Biomass can be used for direct heating in industrial applications, for steam production in power generation sector or for biofuels production.
Direct heating is the most widespread application, but electricity manu- facture and biofuels are currently gaining respectable interest among energy policy makers[4].
Biomass resources can be classified as forestry wastes, produced
from wood products industries; agricultural wastes, generated by crops,
agro-industries and animal farms; energy crops, i.e. crops and trees
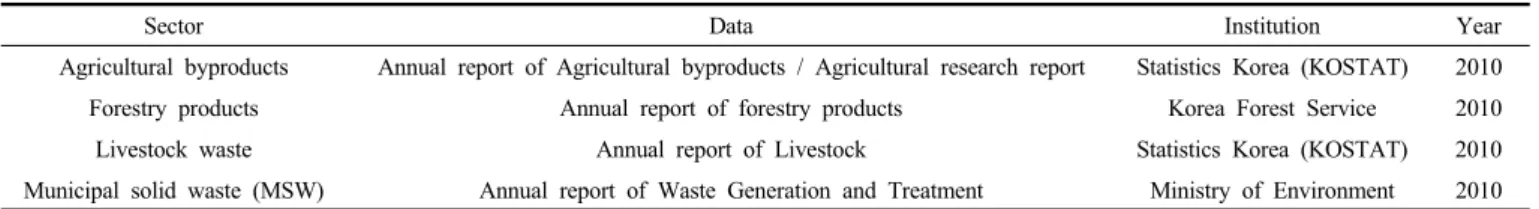
Sector Data Institution Year Agricultural byproducts Annual report of Agricultural byproducts / Agricultural research report Statistics Korea (KOSTAT) 2010 Forestry products Annual report of forestry products Korea Forest Service 2010 Livestock waste Annual report of Livestock Statistics Korea (KOSTAT) 2010 Municipal solid waste (MSW) Annual report of Waste Generation and Treatment Ministry of Environment 2010 Table 1. Basic Data Used in this Study
Sector Key resources Caloric value conversion factor
(kcal/kg) Generation rate conversion factor
Agriculture byproducts
rice straw 3416 65.3 ton/km
2wheat straw 4100 29.8 ton/km
2rice husk 3616 11.8 ton/km
2soybean stem 4069 26.9 ton/km
2sweat potato stem 4534 64.6 ton/km
2apple byproduct 4320 45.9 ton/km
2Forestry products hard wood 5000
4706 4353
0.440 ton/m
3soft wood 0.750 ton/m
3mixed forest 0.595 ton/m
3Livestock waste
cow manure
5158 kcal/m
3281 m
3/dry measure ton
pig manure 649 m
3/ dry measure ton
chicken manure 359 m
3/ dry measure ton
MSW
paper 3177 -
wood kind 2673 -
rubber leather 6510 -
plastics 6510 -
Etc. 3844 -
Table 2. Energy Conversion Factor of Biomass
dedicated to energy production; and urban waste. Given the numerous applications of biomass and the variety of sources, it is not surprising that wide arrays of biomass conversion technologies are under develop- ment and commercialized[5-8]. However, the cost of collecting enough biomass to be used in commercial biomass energy conversion plants is remained as big hurdle for biomass energy conversion. So, the tech- no-economical evaluation of biomass energy resources for energy con- version should be completed before the decision of commercialization.
But there is not enough information about local biomass energy potentials.
In order to estimate the availability of domestic biomass energy po- tential and choice appropriate process, energy potentials and energy densities of biomass resources such as agricultural wastes, forestry wastes, livestock wastes and urban wastes in Korea were collected and analyzed by using the latest database from Korean government organ- izations and institutes. In korea, there are thermal plants in Taean, Seocheon, Boryeong, Honam, Dangjin, Samcheonpo, Yeongdong, Yeongheung, and all thermal plants are located within a radius of 90 km from the major city except Yeongdong plant. In this study, energy densities were calculated and analyzed with the radius of 5 major cities in Korea ranging from 30∼90 km to make useful information about
economical collecting cost of biomass resources.
2. Analysis
2.1. Energy potential
Various non-edible biomass resources were classified in agriculture waste, forestry waste, livestock waste and urban waste in this study.
Databases used in the analysis were summarized in Table 1. forestry wastes contained softwood, hardwoods and mixed and agricultural wastes sorted rice straw, rice husk, wheat straw, soybean stalks, sweet potato stems, apple byproduct. Livestock wastes was distinguished by cow manure, pig manure, chicken manure and Urban wastes was se- lected as food waste, paper, wood kind, rubber leather, plastics[9-12].
Biomass resources potential is analyzed using TOE (ton of oil equiv-
alent) qualities which are calculated by using well proven energy con-
version factor of biomass[13] to easily compare with by regional groups
in Korea (Gangwon-do, Gyeonggi-do, Jeollabuk-do, Jeollanam-do,
Gyeongsangbuk-do, Gyeongsangnam-do, Chungcheongbuk-do, Chung-
cheongnam-do, Jeju Island). Energy conversion factor of biomass was
summarized in Table 2.
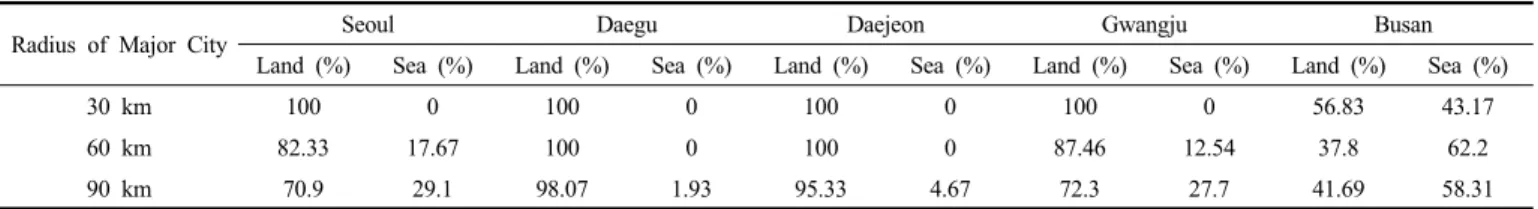
Radius of Major City Seoul Daegu Daejeon Gwangju Busan Land (%) Sea (%) Land (%) Sea (%) Land (%) Sea (%) Land (%) Sea (%) Land (%) Sea (%)
30 km 100 0 100 0 100 0 100 0 56.83 43.17
60 km 82.33 17.67 100 0 100 0 87.46 12.54 37.8 62.2
90 km 70.9 29.1 98.07 1.93 95.33 4.67 72.3 27.7 41.69 58.31
Table 3. Ratio of Land/Sea with Radius of Major Cities
Area Agricultural wastes (TOE/y)
Livestock wastes (TOE/y)
Urban wastes (TOE/y)
Forestry wastes (TOE/y)
Total (TOE/y)
Gangwon-do 27,170 79,364 114,408 2,615,753 2,836,695
Gyeonggi-do 60,502 302,872 495,865 710,409 1,569,649
Jeollabuk-do 75,139 188,904 70,301 713,400 1,047,744
Jeollanam-do 99,852 197,929 127,521 881,102 1,306,404
Gyeongsangbuk-do 109,542 213,268 136,104 1,976,503 2,435,417
Gyeongsangnam-do 54,635 175,691 146,463 929,416 1,306,205
Chungcheongbuk-do 36,206 99,622 73,659 597,685 807,172
Chungcheongnam-do 79,934 300,034 106,579 592,747 1,079,294
Jeju-do 2,538 2,068 11,198 76,760 92,563
Table 4. Available Potential of Total Biomass in Korea
Figure 1. Radius of Metropolitan Cities.
2.2. Space energy density
To compare biomass availabilities with each local area, the term of Space energy density was used in this study. Space energy density (TOE/km
2) is defined as biomass energy potential over areas with radi- us of major cities in Korea. Based on radius of 5 cities in Korea rang- ing from 30∼90 km, Space energy densities were calculated and com- pared in this study. The image of radius (30, 60, 90 km) of cities was
shown in Figure 1. As can be seen in Figure 1, it is indicated that the sea of area is included within radius of area. But in this study, it is considered that biomass resources are only applied to land to calculate Space energy density. The ratio of land/sea with radius was shown in Table 3. Metropolitan cities in Korea, which are including Seoul, Daejoen, Daegu, Gwangju and Busan, are the fiducial points of this study.
3. Results and Discussion
3.1. Available energy potential in Korea
To analyze domestic biomass available potentials, various biomass resource databases were classified as agriculture byproducts, forestry products, livestock waste and urban waste arranged by TOE. Table 4 showed the biomass total available potential in Korea. The biomass to- tal available potential in Gangwon-do and Gyeongsangbuk-do are re- spectively, 2,836,695, 2,435,417 TOE/y.
Also, densely populated and urbanized Gyeonggi-do is occurred about 1,569,649 TOE of urban waste. The energy potential of domestic forestry products are investigated based on softwood, hardwood, mixed forest. It had a large deviation according to the presence of mountain- ous terrain of the corresponding area. The energy potentials of forestry product in Gangwon-do and Gyeonsangbuk-do were 2,615,753, 1,976,503 TOE/y, respectively. The livestock waste resources were generated in most local areas, except metropolitan cities.
The generation and quantities of livestock waste were affected
with/without a large-scale breeding. The energy potential of livestock
waste in Gyeonggi-do and Chungcheongnam-do were 302,872 TOE/y
and 300,034 TOE/y because there are many livestock breeding. In con-
trast, Gangwon-do and Cungcheongbuk-do have lower energy potential
Radius of Major City(km)
30km 60km 90km
Energy potential(TOE/y)
0 106 2x10⁶ 3x10⁶ 4x10⁶
Daejeon Daegu Gwangju Busan Seoul
Figure 2. Accumulated total biomass energy potential (Base year : 2010).
Radius of Major City(km)
30km 60km 90km
Space energy density(TOE/ykm2 )
0 2 4 6 8 10 12 14 16 18 20
Daejeon Daegu Gwangju Busan Seoul
Figure 3. Space energy densities of agricultural byproducts (Base year : 2010).
Radius of Major City(km)
30km 60km 90km
Space energy density(TOE/ykm2 )
20 40 60 80 100 120
Daejeon Daegu Gwangju Busan Seoul
Figure 4. Space energy densities of forestry products (Base year : 2010).
than any other area. In terms of agricultural biomass wastes, local areas which had broad plain areas such as Jeollabuk-do, Jeollanam-do, Chungcheongnam-do, Gyeongsangbuk-do had higher agricultural bio- mass energy potential than other areas. Especially mountainous Gangwon-do had lower agricultural biomass energy potential than any
other regions. Urban waste was influenced by urbanization of local areas, population, industrialization and so on. The energy potential of urban waste in Gyeonggi-do, Jeollanam-do, Gyeongsangbuk-do, and Gyeongsangnam-do were 495,865 TOE/y, 127,521 TOE/y 136,104 TOE/y and 146,463 TOE/y, respectively.
Accumulated total biomass potential according to the distance is shown Figure 2. As shown in Figure 2, Gwangju and Busan has rela- tively lower accumulated total biomass potential at the region around the city than Seoul, Daejeon and Daegu. On the other hand, in Seoul, Daejeon and Daegu, accumulated biomass resources were mesured higher as the distance increase from the city. Especially, Seoul which immensely emits urban waste due to the industrialization shows highest availability of biomass by 3,790,000 TOE/y.
3.2. Space energy density in Korea
Although biomass energy potential is high, it is essential to estimate the cost of collecting biomass for commercial plants because of wide distribution of biomass. Space energy densities of 4 different types of biomass were compared with the bases of 5 megacities in Korea.
Figures. 3∼7 are the resource density of agricultural byproducts, for- estry products, livestock waste, urban waste product according to the radius of metropolis.
Space energy densities of agriculture byproducts were shown in Figure 3. As shown in Figure 3, Space energy densities are decreased sharply with increasing the radius of Gwangju in spite of higher Space energy densities of agricultural byproducts. Since Gwangju region which located in Honam state has well-developed agricultural industry, generation of byproducts for energy from shows higher in the immedi- ate area, while relatively shows lower amount further th the city. Space energy densities increased with increasing distance in Daejeon and Daegu. The area of radius within 90 km of Daejeon and Daegu city are included in Chungcheongnam-do which has well-developed agri- culture shows high density of agricultural by product. Space energy densities of agricultural byproducts in Busan and Seoul areas were sig- nificantly lower than other cities. Seoul and Busan which has a number of large industrial companies and high population density shows rela- tively low agricultural byproduct density. It meant that Busan and Seoul area might be not suitable to establish energy conversion facility for agriculture byproducts.
Space energy densities of domestic forestry products depending on the city were shown in Figure 4. Unlike energy potential evaluation, Space energy densities of forestry in Daegu and Daejeon area were higher than other areas. Because of the perimetric basin topography of Daejeon and Daegu, forest resources are relatively abundant further away from the city. Therefore, Daegu and Daejeon area might be suit- able to develop biomass energy conversion facility using the forestry products. Space energy densities of forestry products in Seoul were lower than other local areas, so it might be unfavorable to set up con- version facility using the forestry products.
Space energy densities of livestock waste were shown in Figure 5.
In case of areas with radius of 30 km and 60 km, Space energy den-
sities of livestock waste in Gwangju were higher than other areas.
Radius of Major City(km)
30km 60km 90km
Space energy density(TOEy/km2 )
6 8 10 12 14 16 18 20 22 24 26
Daejeon Daegu Gwangju Busan Seoul
Figure 5. Space energy densities of livestock waste (Base year : 2010).
Radius of Major City(km)
30km 60km 90km
Space energy density(TOE/ykm2) 0 100 200 300 400 500
Daejeon Daegu Gwangju Busan Seoul
Figure 6. Space energy densities of MSW (Base year : 2010).
Radius of Major City(km)
30km 60km 90km
Space energy density(TOE/ykm2)
0 100 200 300 400 500 600
Daejeon Daegu Gwangju Busan Seoul