The Accuracy of Ultrasonography for the Evaluation of Portal Hypertension in Patients with Cirrhosis:
A Systematic Review
Gaeun Kim, RN, PhD
1, Youn Zoo Cho, MD
2, Soon Koo Baik, MD, PhD
2, Moon Young Kim, MD, PhD
2, Won Ki Hong, MD
2, Sang Ok Kwon, MD, PhD
21College of Nursing, Research Institute for Nursing Science, Keimyung Univercity, Daegu 704-701, Korea; 2Department of Internal Medicine, Wonju Severance Christian Hospital, Yonsei University Wonju College of Medicine, Wonju 220-701, Korea
Objective: Studies have presented conflicting results regarding the accuracy of ultrasonography (US) for diagnosing portal hypertension (PH). We sought to identify evidence in the literature regarding the accuracy of US for assessing PH in patients with liver cirrhosis.
Materials and Methods: We conducted a systematic review by searching databases, including MEDLINE, EMBASE, and the Cochrane Library, for relevant studies.
Results: A total of 14 studies met our inclusion criteria. The US indices were obtained in the portal vein (n = 9), hepatic artery (n = 6), hepatic vein (HV) (n = 4) and other vessels. Using hepatic venous pressure gradient (HVPG) as the reference, the sensitivity (Se) and specificity (Sp) of the portal venous indices were 69–88% and 67–75%, respectively. The correlation coefficients between HVPG and the portal venous indices were approximately 0.296–0.8. No studies assess the Se and Sp of the hepatic arterial indices. The correlation between HVPG and the hepatic arterial indices ranged from 0.01 to 0.83. The Se and Sp of the hepatic venous indices were 75.9–77.8% and 81.8–100%, respectively. In particular, the Se and Sp of HV arrival time for clinically significant PH were 92.7% and 86.7%, respectively. A statistically significant correlation between HVPG and the hepatic venous indices was observed (0.545–0.649).
Conclusion: Some US indices, such as HV, exhibited an increased accuracy for diagnosing PH. These indices may be useful in clinical practice for the detection of significant PH.
Index terms: Ultrasonography; Hepatic venous pressure gradient; Portal hypertension; Cirrhosis
Received August 1, 2014; accepted after revision December 15, 2014.
This work was supported by the Yonsei University Future-leading Research Initiative of 2014 and also by the Yonsei University Wonju College of Medicine Research Fund of 2014.
Corresponding author: Soon Koo Baik, MD, PhD, Department of Internal Medicine, Wonju Severance Christian Hospital, Yonsei University Wonju College of Medicine, 20 Ilsan-ro, Wonju 220-701, Korea.
• Tel: (8233) 741-1223 • Fax: (8233) 741-1228
• E-mail: [email protected]
This is an Open Access article distributed under the terms of the Creative Commons Attribution Non-Commercial License (http://creativecommons.org/licenses/by-nc/3.0) which permits unrestricted non-commercial use, distribution, and reproduction in any medium, provided the original work is properly cited.
Korean J Radiol 2015;16(2):314-324
INTRODUCTION
Portal hypertension (PH) is the result of increased hepatic vascular resistance and portal blood flow. PH leads to serious complications, such as variceal bleeding, portal hypertensive enteropathy, ascites, spontaneous bacterial peritonitis, hepatorenal syndrome, and hepatic encephalopathy. PH is responsible for significant morbidity and mortality in patients with decompensated cirrhosis (1, 2). For patients with compensated cirrhosis, the diagnosis and grading of clinically significant portal hypertension (CSPH) enable the prediction of prognoses such as the possibility of progression to decompensated cirrhosis and mortality (3).
pISSN 1229-6929 · eISSN 2005-8330
Thus, the precise grading of PH is essential for appropriate treatment and follow-up of patients with cirrhosis (3, 4).
The measurement of the hepatic venous pressure gradient (HVPG) has served as the gold standard for assessing the degree of PH (5). This parameter reflects disease severity and has a strong prognostic value with regard to survival and decompensation in patients with compensated cirrhosis (6). However, the widespread routine clinical use of this method has been limited by the procedure’s invasive nature and the requirements for skilled expertise and special equipment (7, 8).
Therefore, many investigators have undertaken efforts to diagnose and grade PH using non-invasive ultrasonography (US) in patients with cirrhosis to replace invasive HVPG measurements (9, 10). US can be used to investigate portal hemodynamics via measurements of the velocity and flow of the portal and splenic veins; the resistance index (RI) and pulsatile index (PI) of the hepatic, splenic, and renal arteries; and the waveform and damping index (DI) of the hepatic vein (HV). However, previous studies on the utility of US for assessing PH have demonstrated conflicting results in patients with cirrhosis, and these studies are regarded as lacking sufficient sensitivity (Se) or specificity (Sp) to replace HVPG in clinical practice (11). In addition, considerable variability has been observed across different investigations, and small sizes of the individual studies have been noted.
Thus, this systematic review aimed to determine the accuracy of US for assessing PH in patients with cirrhosis.
MATERIALS AND METHODS
This study was a systematic review of US versus HVPG for the detection of PH in patients with cirrhosis.
Search Strategy
This study followed the reporting guidelines for systematic reviews suggested by the Preferred Reporting Items for Systematic Reviews and Meta-analyses group and the systematic review handbook of the Cochrane library.
The following databases were primarily used for the literature searches: Ovid MEDLINE (1948 to October 28th, 2013), EMBASE (1947 to October 28th, 2013), and the Cochrane Library (–October 28th, 2013). The patients, index test, comparison test, outcomes search strategy was used to identify studies assessing cirrhosis and PH.
US measurements of blood velocity, blood flow, RI, PI,
HV waveform, and hepatic vein arrival time (HVAT) were used as an index test. Moreover, HVPG was used as the reference standard test. Diagnostic accuracy, concordance of comparison tests, and correlation served as the main outcomes.
The following main search terms were used: ([liver cirrhosis. mp.] OR [cirrhotic liver. mp.]) AND ([portal hypertension. mp. or exp hypertension, portal] OR [PHT.
mp.]) AND ([exp ultrasonography or ultrasonography*. mp.]
OR [ultraso*. mp.] OR [sonograph*. mp.] OR [US]) AND ([hepatic venous pressure gradient. mp.] OR [HVPG. mp.]) (Supplement in the online-only Data Supplement).
Inclusion/Exclusion Criteria
Studies meeting the following inclusion criteria were included in the systematic review: 1) studies examining PH using US in patients with cirrhosis and 2) studies reporting on more than one appropriate outcome, i.e., the diagnostic accuracy of US for PH based on HVPG. The exclusion criteria included 1) preclinical studies, 2) studies not published in English, 3) gray studies, 4) studies that did not examine PH, and 5) studies that did not report more than one appropriate outcome.
To select appropriate studies for the objective of this research, duplicate studies from each database were excluded using Endnote. Two research authors independently screened all potential studies for inclusion according to the eligibility criteria. If the authors could not reach an agreement by discussion, the opinion of a third author was sought for resolution.
Data Collection and Quality Assessment of Selected Studies
The data used to conduct this systematic review included journal year and language of publication; study design; PH cut-off values; duration of the study; period of follow up;
sample size; withdrawal rate; diagnostic method; reference standard; numbers of true positive (Tp), true negative (Tn), false positive (Fp), and false negative (Fn) patients; and other data.
The quality of the selected studies was assessed using 11 Quality Assessment of Diagnostic Accuracy Studies- II (QUADAS-II) items, as recommended by Cochrane. Each item requires a yes, no or unclear answer.
Two review authors independently extracted the data.
The results of the reviewers were compared, and differences were resolved through discussion with a third review author.
Data Analysis
We first attempted to use the Cochrane Library RevMan 5.2 (Cochrane Collaboration, Oxford, UK) program to analyze the accuracy values of the clinical diagnoses; however, we were unable to use the program due to the absence of Tp, Tn, Fp, and Fn values in some studies. Additionally, significant heterogeneity among studies and variation in the cut-off values used in each study were noted. Thus, we were unable to perform a meta-analysis. Therefore, we performed a systematic review and descriptive analysis.
RESULTS
We identified 313 studies using our search process.
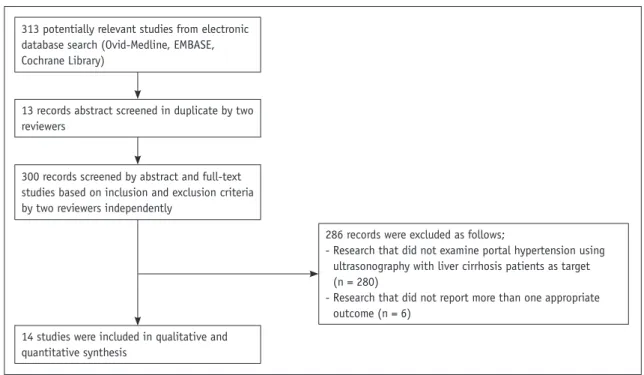
Thirteen duplicate studies from each database were excluded using Endnote. Two authors independently assessed all potential studies for inclusion in our review based on the eligibility criteria. Finally, 14 studies were chosen for analysis. The literature selection process is presented in Figure 1.
General Characteristics of the Studies Included in the Systematic Review
A summary of the characteristics of the 14 studies included in this systematic review is presented in Table 1.
Most of these studies were published from 1998 through 2013. Regarding their regional distribution, the studies
were performed in the Republic of Korea (n = 5), Italy (n
= 4), France (n = 2), Spain (n = 1), Germany (n = 1), and Turkey (n = 1).
The 14 studies included 827 patients with cirrhosis. The average age of the patients was 53.2 ± 9.6 years old. Only two studies (8, 32) included more than 100 patients.
The studies primarily presented the characteristics of the diagnostic performance of US compared with HVPG for assessing PH in patients with cirrhosis. All the US procedures were conducted by trained experts. Contrast- enhanced ultrasonography (CEUS) was only used in one study (8); the remaining 13 studies used Doppler US.
The following US indices were used: portal vein (n = 9), hepatic artery (n = 6), HV (n = 4), renal artery (n = 2), superior mesenteric artery (n = 2), and abdominal porto- systemic collaterals (n = 1).
The average HVPG value for all the patients was 16.4 ± 5.3 mm Hg. Studies used various terms and HVPG thresholds for the target PH to diagnose. Severe PH was used to indicate HVPG > 12 mm Hg (12-16), ≥ 15 mm Hg (17), or ≥ 16 mm Hg (18, 19). One study defined HVPG ≥ 16 mm Hg as values to predict mortality (20). Two studies defined HVPG
≥ 10 mm Hg as CSPH (8, 21). Three studies (22-24) did not propose a PH cut off value (Table 1).
Risk of Bias
The risk of bias for the 14 selected studies was
313 potentially relevant studies from electronic database search (Ovid-Medline, EMBASE, Cochrane Library)
300 records screened by abstract and full-text studies based on inclusion and exclusion criteria by two reviewers independently
13 records abstract screened in duplicate by two reviewers
14 studies were included in qualitative and quantitative synthesis
286 records were excluded as follows;
- Research that did not examine portal hypertension using ultrasonography with liver cirrhosis patients as target (n = 280)
- Research that did not report more than one appropriate outcome (n = 6)
Fig. 1. Flow diagram depicting evaluation process for inclusion of studies reviewed in this study.
Table 1. Characteristics of Included Studies First Author Published YearCountryInclusion CriteriaN (M:F) Mean Age (Years)US TypeHVPG Criteria (mm Hg)HVPG (Mean ± SD) (mm Hg) Berzigotti 2013 (22)SpainLiver cirrhosis50 (33:17) 56 ± 9US-16.6 ± 6.0 Kim 2012 (8)KoreaLiver cirrhosis116 (95:21) 49.4 ± 8.6CEUSCSPH ≥ 10Derivation set/validation set; 11.4 ± 5.0 (2–23)/11.3 ± 5.4 (4–21) Berzigotti 2011 (20)ItalyLiver cirrhosis and untreated CSPH86 (54:32) 57 ± 9USHVPG for predicting mortality ≥ 16 CSPH ≥ 1017.8 ± 5.1 (10–33.5) Kim 2011 (12)KoreaLiver cirrhosis22 (17:5) 52.8 ± 11.0USHigh grade portal hypertension ≥ 12 Low grade portal hypertension ≤ 10≥ 12 (n = 18), median 17.4 (12.6–25.3) < 12 (n = 4), median 10.15 (5–11.4) Ozdogan 2008 (23)TurkeyLiver cirrhosis11 (8:3) 48 ± 11.2US-16.5 ± 6.7 Kim 2007 (13)KoreaLiver cirrhosis76 (69:7) 50.4 ± 9.1USSevere portal hypertension > 1215.4 ± 4.9 (4–33) Baik 2006 (17)KoreaLiver cirrhosis and variceal bleeding78 (70:8) 49.4 ± 9.7USSevere portal hypertension ≥ 1514.6 ± 4.3 (4–26) Berzigotti 2006 (21)ItalyLiver cirrhosis31 (22:9) 57.6 ± 8.8USCSPH ≥ 10 Higher risk of developing complications of portal hypertension ≥ 1619.3 ± 4.7 (11.5–33.5) Choi 2003 (24)KoreaLiver cirrhosis138 (129:9) 50.0 ± 9.3US-15.1 ± 5.4 Tasu 2002 (14)FranceLiver cirrhosis50 (34:16) 53 ± 12USMild portal hypertension = 12 Severe portal hypertension > 12
CPS A; 6.2 ± 3.61 CPS B; 16.56 ± 5.51 CPS C; 28.63 ± 8.6 Bolognesi 2001 (18)ItalyLiver cirrhosis and EV and/or ascites40 (29:11) 58 ± 10USSerious portal hypertension ≥ 16≥ 16 (n = 25), 20.8 ± 4.6 < 16 (n = 15), 13.0 ± 2.7 Schneider 1999 (15)GermanyLiver cirrhosis50 54 ± 11USSevere portal hypertension > 1220.9 ± 6.7 Taourel 1998 (16)FranceAlcoholic cirrhosis40 (35:5) 52 ± 8USSevere portal hypertension > 1217.6 ± 5.5 Merkel 1998 (19)ItalyLiver cirrhosis39 (28:11) 57 ± 7USMarginal portal hypertension ≤ 12 12 < Moderate portal hypertension < 16 Severe portal hypertension ≥ 1618.0 ± 5.7 Note.— CEUS = contrast-enhanced ultrasonography, CPS = Child-Pugh score, CSPH = clinically significant portal hypertension, EV = esophageal varix, HVPG = hepatic venous pressure gradient, M:F = male:female, SD = standard deviation, US = ultrasonography
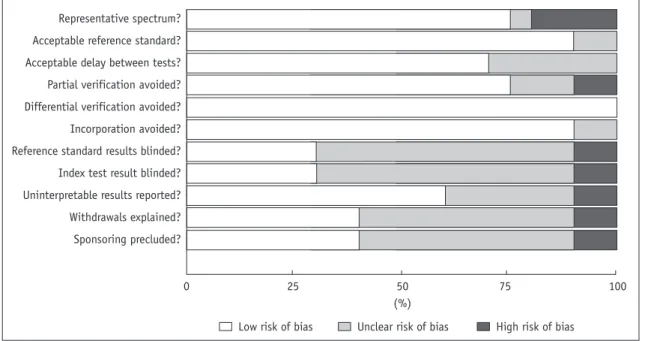
assessed using the QUADAS-II quality assessment tool for diagnostic studies (Fig. 2). Eleven of 14 studies (78.6%) were appropriate in terms of the range of target patients representing the patient group. Moreover, 13 of 14 studies (93%) used an acceptable reference standard, and 10 of 14 studies (71.4%) had an acceptable delay between tests.
Eleven of 14 studies (78.6%) were verified by reference standards, and all 14 studies (100%) were verified by reference standards with no relation to the index test results. In 13 of 14 studies (93%), the reference standard and index test were individually executed. In 5 of 14 studies (35.7%), reference standard results were blinded. This item was uncertain in 8 of 14 studies (57.2%). The index test results were blinded in 10 of 14 studies (71.4%), whereas 6 of 14 studies (42.9%) were reported to have uninterpretable results. Uncertain cases were noted in 7 of 14 studies (50%).
Patient withdrawal was noted in 6 of 14 studies (42.0%), and patient withdrawal was uncertain in 7 of 14 studies (50%).
Overall, less than 10% of the studies in each list were evaluated as having a “high” risk of bias. Between 7% and 50% of studies were regarded as “uncertain”. Thus, it was difficult to determine whether all selected studies were of high-quality with a low risk of bias.
Relevant Indices of the Portal Vein
Measurable indices of the portal vein for assessing PH include portal vein velocity (PVV), portal vein flow (PVF), and congestion index (CI).
Using HVPG as a reference, the Se and Sp of the portal venous indices were 69–88% and 67–75%, respectively.
The correlation coefficient for HVPG and the portal venous indices was 0.296–0.8, and approximately half of the studies reported statistically significant correlations.
Two studies (14, 15) reported the diagnostic accuracy of PVV, indicating a Se and Sp of 69–88% and 67–75%, respectively (Table 2). Nine studies (14-16, 18-20, 22-24) assessed the correlation between HVPG and PVV. PVV ranged from 10.2 to 23.5 cm/s (± 0.2–11.6) in these studies.
However, a significant correlation was only detected in 4 studies (|r| = 0.69–0.8, p < 0.05) (Table 3) (14-16, 23).
Four studies (16, 18, 22, 24) evaluated the correlation between HVPG and PVF. PVF ranged from 325 to 773 mL/
min (± 3.5–464), but only one study (16) reported a statistically significant correlation (|r| = 0.58, p < 0.01) (Table 3).
One study reported the diagnostic accuracy of the CI of the portal vein. The CI of the portal vein was calculated as follows: CI = cross-sectional area of the portal vein (cm2) / portal vein mean flow velocity (cm/s) (22). Merkel et al.
(19) reported a Se and Sp of 68% and 80%, respectively, and a PPV and NPV of 85% and 57%, respectively (Table 2). Five studies (14, 18-20, 22) evaluated the correlation between HVPG and CI. The CI ranged from 0.137 to 0.17 cm/s (± 0.02–0.049). Only two studies (14, 22) identified statistically significant correlations (r = 0.296–0.45, p <
0.05) (Table 3).
Fig. 2. Summary of risk of bias for 14 selected studies.
Representative spectrum?
Acceptable reference standard?
Acceptable delay between tests?
Partial verification avoided?
Differential verification avoided?
Incorporation avoided?
Reference standard results blinded?
Index test result blinded?
Uninterpretable results reported?
Withdrawals explained?
Sponsoring precluded?
0 25 50 75 100 Low risk of bias Unclear risk of bias High risk of bias
(%)
Relevant Indices of the Hepatic Artery
Measurable indices of the hepatic artery for assessing PH included hepatic artery velocity (HAV), hepatic artery flow (HAF), and RI and PI of the hepatic artery.
No studies reported the Se and Sp of the hepatic arterial indices. A wide range of correlations coefficients between HVPG and the hepatic arterial indices (0.01–0.83) were reported, and approximately half of the reports demonstrated statistically significant correlations.
One study (22) reported a correlation between HVPG and HAV, but this correlation was not statistically significant (r
= 0.040, p = 0.769) (Table 3). Two studies (14, 22) reported correlations between HVPG and HAF, but only one study reported a significant correlation (r = 0.83, p < 0.0001) (Table 3).
Three studies (16, 19, 24) reported correlations between HVPG and the RI of the hepatic artery. The RI is calculated as follows: RI = (peak systolic velocity - end diastolic velocity) / peak systolic velocity (15). However, none of these studies found a statistically significant correlation (r
= -0.056–0.01, p = NS–0.553) (Table 3).
Two studies (15, 24) reported correlations between HVPG and the PI of the hepatic artery. The PI of the hepatic artery is calculated as follows: PI = (peak systolic velocity - end diastolic velocity) / mean velocity (15). Only one of these studies identified a statistically significant correlation (r = 0.70, p < 0.001) (Table 3).
Relevant Indices of the Hepatic Vein
The normal triphasic HV waveform by US examination is transformed into a biphasic or monophasic waveform in cirrhosis with PH (3, 13, 17). Abnormal HV wave forms were seen in 66 of 76 patients (86.8%) and 72 of 78 patients (92%) (13, 17). Particularly, the monophasic waveform was associated with severe PH (HVPG > 15 mm Hg) with a Se of 74% and a Sp of 95% (17). In addition, statistically significant correlations were observed between HVPG and the abnormality of HV waveform (correlation coefficient, 0.648) (17).
Other quantitative indices of HV were used for PH analysis, including the DI and HVAT.
Two studies (12, 13) reported the diagnostic accuracy of Table 2. Diagnostic Accuracy of Measurement Index Using HVPG and US
First Author Published Year
HVPG
(mm Hg) US Index Se (%) Sp (%) PPV (%) NPV (%) +LR -LR
Kim
2012 (8) ≥ 10
HVAT ≤ 14 sec
Derivation set 92.7 86.7 90.5 89.7 6.95 0.08
Validation set 90.0 86.7 90.0 86.7 6.77 0.12
Kim
2011 (12) ≥ 12 DI ratio > 0.69 77.8 100
Berzigotti
2011 (20) ≥ 16 APC 57 87 89 52 4.29 0.49
Kim
2007 (13) > 12 DI ratio > 0.6 75.9 81.8 91.1 58.1
Baik
2006 (17) ≥ 15 Hepatic vein wave form 74 95
Berzigotti
2006 (21) ≥ 16
Rt. renal artery RI and PI 52 100 100 33
Lt. renal artery RI 46 86 92 32
Lt. renal artery PI 67 57 84 33
Tasu
2002 (14) > 12 PVV (17 cm/s) 69 67
Schneider
1999 (15) > 12 PVV (12 cm/s) 88 75
HAPI (1.05) 86 64
Merkel
1998 (19) ≥ 16 CI ≥ 0.12 cm x sec 65 80 85 57
Note.— APC = abdominal porto-systemic collaterals, CI = congestion index, DI = damping index, HAPI = hepatic arterial pulsatility index, HVAT = hepatic vein arrival time, HVPG = hepatic venous pressure gradient, NPV = negative predictive value, PI = pulsatility index, PPV = positive predictive value, PVV = portal venous velocity, RI = resistance index, Se = sensitivity, sec = seconds, Sp = specificity, US = ultrasonography, +LR = positive likelihood ratios, -LR = negative likelihood ratios
DI. DI was calculated as the minimum velocity/maximum velocity of the downward HV flow (12, 13). These studies reported that the DI values for PH exhibited a Se of 75.9–
77.8% and a Sp of 81.8–100.0% (Table 2). DI ratio > 0.6 was significantly more likely to be severe PH (odds ratio:
14.19, 95% confidence interval [CI]: 4.04–49.55) (13).
Kim et al. (8) evaluated HVAT, as assessed by CEUS. The Se, Sp, PPV, NPV, positive likelihood ratio, and negative likelihood ratio for CSPH using a HVAT cut-off value of 14 seconds were 92.7% (95% CI: 80.6–97.5), 86.7% (95% CI:
70.3–94.7), 90.5% (95% CI: 83.7–97.3), 89.7% (95% CI:
82.6–96.7), 6.95 (95% CI: 2.78–17.38), and 0.08 (95%
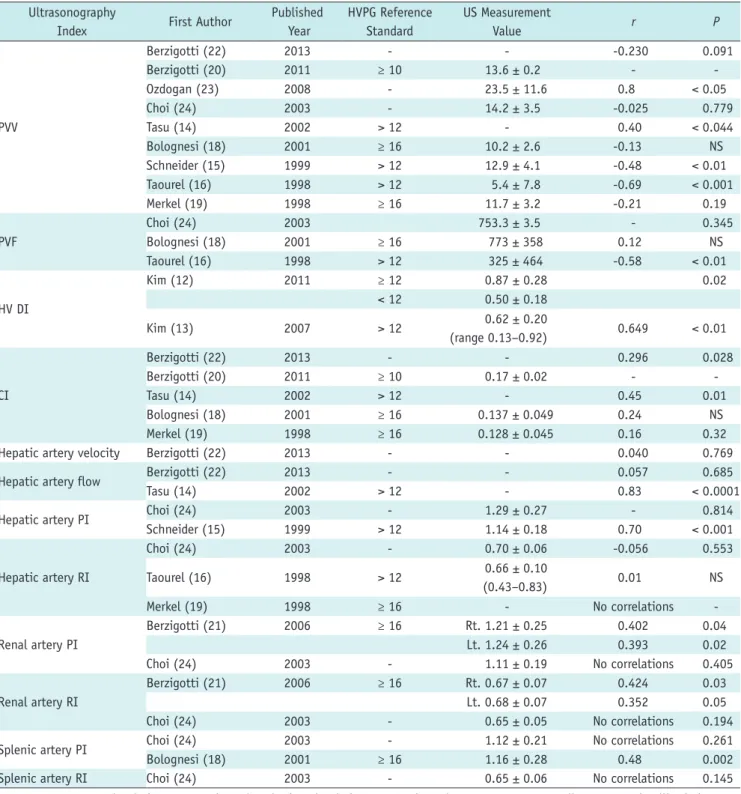
Table 3. Correlation of Measurement Index Using HVPG and US Ultrasonography
Index First Author Published
Year
HVPG Reference Standard
US Measurement
Value r P
PVV
Berzigotti (22) 2013 - - -0.230 0.091
Berzigotti (20) 2011 ≥ 10 13.6 ± 0.2 - -
Ozdogan (23) 2008 - 23.5 ± 11.6 0.8 < 0.05
Choi (24) 2003 - 14.2 ± 3.5 -0.025 0.779
Tasu (14) 2002 > 12 - 0.40 < 0.044
Bolognesi (18) 2001 ≥ 16 10.2 ± 2.6 -0.13 NS
Schneider (15) 1999 > 12 12.9 ± 4.1 -0.48 < 0.01
Taourel (16) 1998 > 12 5.4 ± 7.8 -0.69 < 0.001
Merkel (19) 1998 ≥ 16 11.7 ± 3.2 -0.21 0.19
PVF
Choi (24) 2003 753.3 ± 3.5 - 0.345
Bolognesi (18) 2001 ≥ 16 773 ± 358 0.12 NS
Taourel (16) 1998 > 12 325 ± 464 -0.58 < 0.01
HV DI
Kim (12) 2011 ≥ 12 0.87 ± 0.28 0.02
< 12 0.50 ± 0.18
Kim (13) 2007 > 12 0.62 ± 0.20
(range 0.13–0.92) 0.649 < 0.01
CI
Berzigotti (22) 2013 - - 0.296 0.028
Berzigotti (20) 2011 ≥ 10 0.17 ± 0.02 - -
Tasu (14) 2002 > 12 - 0.45 0.01
Bolognesi (18) 2001 ≥ 16 0.137 ± 0.049 0.24 NS
Merkel (19) 1998 ≥ 16 0.128 ± 0.045 0.16 0.32
Hepatic artery velocity Berzigotti (22) 2013 - - 0.040 0.769
Hepatic artery flow Berzigotti (22) 2013 - - 0.057 0.685
Tasu (14) 2002 > 12 - 0.83 < 0.0001
Hepatic artery PI Choi (24) 2003 - 1.29 ± 0.27 - 0.814
Schneider (15) 1999 > 12 1.14 ± 0.18 0.70 < 0.001
Hepatic artery RI
Choi (24) 2003 - 0.70 ± 0.06 -0.056 0.553
Taourel (16) 1998 > 12 0.66 ± 0.10
(0.43–0.83) 0.01 NS
Merkel (19) 1998 ≥ 16 - No correlations -
Renal artery PI
Berzigotti (21) 2006 ≥ 16 Rt. 1.21 ± 0.25 0.402 0.04
Lt. 1.24 ± 0.26 0.393 0.02
Choi (24) 2003 - 1.11 ± 0.19 No correlations 0.405
Renal artery RI
Berzigotti (21) 2006 ≥ 16 Rt. 0.67 ± 0.07 0.424 0.03
Lt. 0.68 ± 0.07 0.352 0.05
Choi (24) 2003 - 0.65 ± 0.05 No correlations 0.194
Splenic artery PI Choi (24) 2003 - 1.12 ± 0.21 No correlations 0.261
Bolognesi (18) 2001 ≥ 16 1.16 ± 0.28 0.48 0.002
Splenic artery RI Choi (24) 2003 - 0.65 ± 0.06 No correlations 0.145
Note.— CI = congestion index, HV DI = hepatic vein damping index, HVPG = hepatic venous pressure gradient, PI = pulsatility index, PVF
= portal venous flow, PVV = portal venous velocity, RI = resistance index, US = ultrasonography
CI: 0.03–0.25), respectively. The area under the reciever operating characteristic curve was 0.973 (95% CI: 0.944–
0.997) in the derivation set and was reported to be 0.953 (95% CI: 0.888–0.989) in the validation set (Table 3). The correspondence level indicated a statistically significant negative correlation between HVPG and HVAT (R2 = 0.545; p
< 0.001).
DISCUSSION
The objective of this systematic review was to determine the accuracy of US for assessing PH in patients with cirrhosis. This review could help researchers compare, choose, and develop the most appropriate US evaluations for PH in patients with cirrhosis.
Portal hypertension, a frequently presenting clinical syndrome, is defined as a pathological increase in the portal venous pressure between the portal vein and the inferior vena cava that is greater than the normal range (≤ 5 mm
Hg) (25). Initially, PH develops as the result of an increase in intrahepatic resistance to portal blood flow due to the profound morphologic changes characterized by fibrosis.
Increased portal pressure is the main factor determining the clinical course of decompensated cirrhosis (26).
The currently favored method for determining portal venous pressure involves the catheterization of the HV and HVPG measurements (27). HVPG is one of the best surrogate markers for cirrhosis (28). HVPG measurements provide independent prognostic information on survival and the risk of decompensation. CSPH is necessary for esophageal varix formation, bleeding, and initial decompensation (6, 29).
However, although the HVPG measurement procedure is well tolerated, its invasive nature and limited availability have prompted attempts to develop noninvasive alternatives.
There has been great interest in developing and validating non-invasive methods to detect PH among patients with cirrhosis (25). Although non-invasive US appears to be a reliable surrogate for HVPG for identifying PH, the
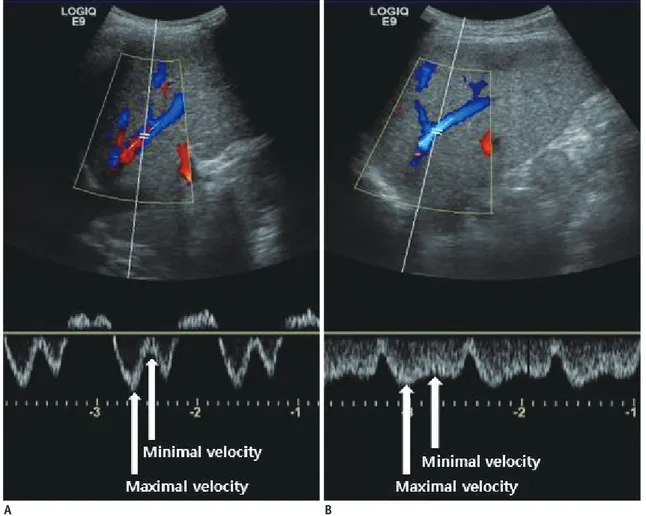
Fig. 3. Measurement of damping index (DI) of hepatic vein wave form.
Damping index is calculated by dividing minimum velocity by maximum velocity of hepatic vein waveform. A. Patient with cirrhosis exhibits DI of 0.27 with 5 mm Hg hepatic venous pressure gradient (HVPG). B. Another patient with cirrhosis exhibits DI of 0.7 with 15 mm Hg of HVPG.
A B
correlation between US and PH remains poorly defined. In this systematic review, we evaluated the clinical utility of non-invasive US for assessing PH in patients with cirrhosis.
This systematic review identified 14 studies that evaluated the diagnostic performance of US for PH in patients with cirrhosis, fulfilled the inclusion criteria, and reported sufficient data.
Numerous studies used the portal vein indices to assess PH. However, these studies did not appear to be sufficiently sensitive for the accurate diagnosis of PH due to conflicting results. In particular, to obtain PVV and PVF, the portal vein is imaged longitudinally in the supine position, and the Doppler sample volume is set at its crossing point with the hepatic artery. The PVV is recorded during suspended expiration and is averaged over a few seconds (3).
Variability in PVV measurements includes equipment-related intra- and inter-observer variance (30-32). Additionally, most cirrhotic patients have porto-systemic shunts arising from PH; the shunt patterns are not unique but vary in complexity in each patient. Portal blood velocity and flow can differ between patients with similar portal pressures due to significant variability in porto-systemic collateral patterns (3). Therefore, portal vein indices exhibit some limitations for replacing HVPG. Resistance in the hepatic, splenic and renal arteries can be evaluated by measuring the RI and PI if the vessel is identified by color Doppler (11, 33). In this review, some studied reported no or weakly significant correlations with PH. The RI and PI offer advantages for measuring vascular resistance regardless of the incidence angle; however, acquiring the same arterial branch by color Doppler in each patient is difficult.
Therefore, it is difficult to evaluate the RI and PI under the same conditions in different patients. The accuracy and reproducibility of arterial RI and PI have been questioned (34).
Our review indicates that measurable parameters of the HV indices exhibited moderate accuracy for the detection of PH; however, only a small number of studies were used in this assessment. The HV can be easily visualized along its longitudinal axis by color flow mapping in the supine position (3). The HV wave could be implicated in an increase in HV inflow from intrahepatic shunts, thereby indicating PH. This action result in hemodynamic blunting of the effects of variations in central venous pressure during the cardiac cycle, rather than a lack of liver compliance (3). The DI is calculated by dividing the minimum velocity by the maximum velocity of the HV waveform (Fig. 3).
Analysis of the transit time from the HV using CEUS was recently reported to be useful for assessing the severity of liver fibrosis (35). HV indices as assessed by CEUS might serve as a supplementary adjunct to US for the diagnosis of PH and cirrhosis (8, 36). However, HV indices could not be measured in patients exhibiting a poor echo window and atrophic changes of the liver. In addition, potential human errors in measurements are also a factor (8, 37).
The present study had the following potential limitations that require further discussion. First, only 14 studies evaluated the performance of US for PH, thus limiting the robustness of the conclusions that could be reached.
The methodological differences and varying diagnostic thresholds among the published investigations indicate that additional studied are required to further establish the precision of this emerging technology. Second, significant heterogeneity of inclusion criteria, HVPG criteria and US indices were also noted. Third, the characteristics of the included studies were not completely consistent, including the patient characteristics, the etiologies of cirrhosis, and the devices used to measure US. Fourth, in our systematic review, we only included English studies, so language bias might have influenced the results. To overcome these discrepancies, it is necessary to conduct a large international study that applies high-quality criteria with regard to study procedures and results reporting.
In conclusion, although the accuracy of US in the detection of PH depends on the skill of the operators and the patients’ characteristics, our results of the meta-analysis indicate that US indices, in particular HV indices, can serve as a useful adjunct for clinicians in the management of patients with cirrhosis.
Supplementary Materials
The online-only Data Supplement is available with this article at http://dx.doi.org/10.3348/kjr.2015.16.2.314.
REFERENCES
1. Kim MY, Baik SK. Hyperdynamic circulation in patients with liver cirrhosis and portal hypertension. Korean J Gastroenterol 2009;54:143-148
2. Kim MY, Baik SK, Suk KT, Yea CJ, Lee IY, Kim JW, et al.
Measurement of hepatic venous pressure gradient in liver cirrhosis: relationship with the status of cirrhosis, varices, and ascites in Korea. Korean J Hepatol 2008;14:150-158 3. Baik SK. Haemodynamic evaluation by Doppler
ultrasonography in patients with portal hypertension: a review. Liver Int 2010;30:1403-1413
4. Baik SK, Park DH, Kim MY, Choi YJ, Kim HS, Lee DK, et al. Captopril reduces portal pressure effectively in portal hypertensive patients with low portal venous velocity. J Gastroenterol 2003;38:1150-1154
5. Lebrec D. Methods to evaluate portal hypertension.
Gastroenterol Clin North Am 1992;21:41-59
6. Ripoll C, Groszmann R, Garcia-Tsao G, Grace N, Burroughs A, Planas R, et al. Hepatic venous pressure gradient predicts clinical decompensation in patients with compensated cirrhosis. Gastroenterology 2007;133:481-488
7. Vizzutti F, Arena U, Rega L, Pinzani M. Non invasive diagnosis of portal hypertension in cirrhotic patients. Gastroenterol Clin Biol 2008;32(6 Suppl 1):80-87
8. Kim MY, Suk KT, Baik SK, Kim HA, Kim YJ, Cha SH, et al. Hepatic vein arrival time as assessed by contrast- enhanced ultrasonography is useful for the assessment of portal hypertension in compensated cirrhosis. Hepatology 2012;56:1053-1062
9. Schepke M, Raab P, Hoppe A, Schiedermaier P, Brensing KA, Sauerbruch T. Comparison of portal vein velocity and the hepatic venous pressure gradient in assessing the acute portal hemodynamic response to propranolol in patients with cirrhosis. Am J Gastroenterol 2000;95:2905-2909
10. Ohnishi K, Saito M, Nakayama T, Iida S, Nomura F, Koen H, et al. Portal venous hemodynamics in chronic liver disease: effects of posture change and exercise. Radiology 1985;155:757-761
11. Vizzutti F, Arena U, Rega L, Romanelli RG, Colagrande S, Cuofano S, et al. Performance of Doppler ultrasound in the prediction of severe portal hypertension in hepatitis C virus- related chronic liver disease. Liver Int 2007;27:1379-1388 12. Kim SY, Jeong WK, Kim Y, Heo JN, Kim MY, Kim TY, et al.
Changing waveform during respiration on hepatic vein Doppler sonography of severe portal hypertension: comparison with the damping index. J Ultrasound Med 2011;30:455-462 13. Kim MY, Baik SK, Park DH, Lim DW, Kim JW, Kim HS, et
al. Damping index of Doppler hepatic vein waveform to assess the severity of portal hypertension and response to propranolol in liver cirrhosis: a prospective nonrandomized study. Liver Int 2007;27:1103-1110
14. Tasu JP, Rocher L, PEletier G, Kuoch V, Kulh E, Miquel A, et al. Hepatic venous pressure gradients measured by duplex ultrasound. Clin Radiol 2002;57:746-752
15. Schneider AW, Kalk JF, Klein CP. Hepatic arterial pulsatility index in cirrhosis: correlation with portal pressure. J Hepatol 1999;30:876-881
16. Taourel P, Blanc P, Dauzat M, Chabre M, Pradel J, Gallix B, et al. Doppler study of mesenteric, hepatic, and portal circulation in alcoholic cirrhosis: relationship between quantitative Doppler measurements and the severity of portal hypertension and hepatic failure. Hepatology 1998;28:932- 936
17. Baik SK, Kim JW, Kim HS, Kwon SO, Kim YJ, Park JW, et al.
Recent variceal bleeding: Doppler US hepatic vein waveform in assessment of severity of portal hypertension and vasoactive drug response. Radiology 2006;240:574-580 18. Bolognesi M, Sacerdoti D, Merkel C, Bombonato G, Gatta A.
Noninvasive grading of the severity of portal hypertension in cirrhotic patients by echo-color-Doppler. Ultrasound Med Biol 2001;27:901-907
19. Merkel C, Sacerdoti D, Bolognesi M, Bombonato G, Gatta A.
Doppler sonography and hepatic vein catheterization in portal hypertension: assessment of agreement in evaluating severity and response to treatment. J Hepatol 1998;28:622-630 20. Berzigotti A, Rossi V, Tiani C, Pierpaoli L, Zappoli P, Riili A,
et al. Prognostic value of a single HVPG measurement and Doppler-ultrasound evaluation in patients with cirrhosis and portal hypertension. J Gastroenterol 2011;46:687-695 21. Berzigotti A, Casadei A, Magalotti D, Castaldini N, Losinno
F, Rossi C, et al. Renovascular impedance correlates with portal pressure in patients with liver cirrhosis. Radiology 2006;240:581-586
22. Berzigotti A, Reverter E, García-Criado A, Abraldes JG, Cerini F, García-Pagán JC, et al. Reliability of the estimation of total hepatic blood flow by Doppler ultrasound in patients with cirrhotic portal hypertension. J Hepatol 2013;59:717-722 23. Ozdogan O, Atalay H, Cimsit C, Tahan V, Tokay S, Giral A, et
al. Role of echo Doppler ultrasonography in the evaluation of postprandial hyperemia in cirrhotic patients. World J Gastroenterol 2008;14:260-264
24. Choi YJ, Baik SK, Park DH, Kim MY, Kim HS, Lee DK, et al.
Comparison of Doppler ultrasonography and the hepatic venous pressure gradient in assessing portal hypertension in liver cirrhosis. J Gastroenterol Hepatol 2003;18:424-429 25. Kim MY, Jeong WK, Baik SK. Invasive and non-invasive diagnosis of cirrhosis and portal hypertension. World J Gastroenterol 2014;20:4300-4315
26. Kim MY, Choi H, Baik SK, Yea CJ, Won CS, Byun JW, et al. Portal hypertensive gastropathy: correlation with portal hypertension and prognosis in cirrhosis. Dig Dis Sci 2010;55:3561-3567
27. Baik SK, Jeong PH, Ji SW, Yoo BS, Kim HS, Lee DK, et al.
Acute hemodynamic effects of octreotide and terlipressin in patients with cirrhosis: a randomized comparison. Am J Gastroenterol 2005;100:631-635
28. Bosch J, Abraldes JG, Berzigotti A, García-Pagan JC. The clinical use of HVPG measurements in chronic liver disease.
Nat Rev Gastroenterol Hepatol 2009;6:573-582
29. D‘Amico G, Garcia-Tsao G, Pagliaro L. Natural history and prognostic indicators of survival in cirrhosis: a systematic review of 118 studies. J Hepatol 2006;44:217-231
30. Kayacetin E, Efe D, Dog˘an C. Portal and splenic hemodynamics in cirrhotic patients: relationship between esophageal variceal bleeding and the severity of hepatic failure. J Gastroenterol 2004;39:661-667
31. Bolondi L, Gaiani S, Barbara L. Accuracy and reproducibility of portal flow measurement by Doppler US. J Hepatol 1991;13:269-273
32. Zoli M, Marchesini G, Brunori A, Cordiani MR, Pisi E.
Portal venous flow in response to acute beta-blocker and vasodilatatory treatment in patients with liver cirrhosis.
Hepatology 1986;6:1248-1251
33. Sato S, Ohnishi K, Sugita S, Okuda K. Splenic artery and superior mesenteric artery blood flow: nonsurgical Doppler US measurement in healthy subjects and patients with chronic liver disease. Radiology 1987;164:347-352
34. Sacerdoti D, Gaiani S, Buonamico P, Merkel C, Zoli M, Bolondi L, et al. Interobserver and interequipment variability of hepatic, splenic, and renal arterial Doppler resistance indices in normal subjects and patients with cirrhosis. J Hepatol 1997;27:986- 992
35. Lim AK, Taylor-Robinson SD, Patel N, Eckersley RJ, Goldin RD, Hamilton G, et al. Hepatic vein transit times using a microbubble agent can predict disease severity non-invasively in patients with hepatitis C. Gut 2005;54:128-133
36. Grier S, Lim AK, Patel N, Cobbold JF, Thomas HC, Cox IJ, et al. Role of microbubble ultrasound contrast agents in the non-invasive assessment of chronic hepatitis C-related liver disease. World J Gastroenterol 2006;12:3461-3465
37. Moon KM, Kim G, Baik SK, Choi E, Kim MY, Kim HA, et al.
Ultrasonographic scoring system score versus liver stiffness measurement in prediction of cirrhosis. Clin Mol Hepatol 2013;19:389-398
Classification Number Search Word(s) No. of Literatures
Patient
1 Liver cirrhosis. mp. or exp liver cirrhosis/ 76820
2 Cirrhotic liver. mp. 2001
3 1 OR 2 77355
4 Portal hypertension. mp. or exp hypertension, portal/ 25645
5 PHT. mp. 1936
6 4 OR 5 27393
7 3 AND 6 8598
Index test
8 Exp ultrasonography/ or ultrasonograph*. mp. 291028
9 Ultraso*. mp. 292118
10 Sonograph*. mp. 41951
11 US 7090511
12 OR 8–11 7397644
P&I 13 7 AND 12 2255
Comparators
14 Hepatic ve* pressure. mp. 960
15 HVPG. mp. 354
16 14 OR 15 993
Patient & Index test & comparators 17 13 AND 16 276
Human, language limitation 18 Limit 17 to (English language and humans) 262
Ovid-MEDLINE 262
Classification Number Search Word(s) No. of Literatures
Patient
1 ‘Liver cirrhosis’/exp 106569
2 ‘Cirrhotic liver’ 2603
3 #1 OR #2 107169
4 ‘Portal hypertension’/exp 23877
5 PHT 2701
6 #4 OR #5 26295
7 #3 AND #6 9906
Index test
8 Ultraso* 388300
9 Sonograph* 57389
10 US 392852
11 #8 OR #9 OR #10 778912
P&I 12 #7 AND #11 1041
Comparators
13 ‘Hepatic venous pressure’ OR ‘hepatic vein pressure’ 1333
14 HVPG 683
15 #13 OR #14 1452
Patient & Index test & comparators 16 #12 AND #15 98
17 #16 AND ‘human’/de AND ‘article’/it 51
EMBASE 51
Ovid-MEDLINE
EMBASE