I. INTRODUCTION
Fatigue is defined by International Civil Aviation Orga- nization (ICAO) [1] as “a physiological condition in which mental or physical performance is reduced due to lack of sleep or prolonged arousal, circadian phase, or workload (mental and physical activity) that may impair the atten- tion of a crew member and the ability to safely operate an aircraft or perform safety-related tasks”. Fatigue among airline pilots is associated with various contributing fac-
tors, including irregular working hours, long duty sched- ules, disruptions of circadian rhythm, and insufficient sleep [2-4]. Along with work-related characteristics, fa- tigue could be associated with a health condition, type of lifestyle, quality of lifestyle, and emotional distress.
Pilot fatigue is a significant problem in airline opera- tions. Fatigue can affect pilots’ performance and produc- tivity in their job, such as decreased attention, memory difficulties, and lower psychomotor speed [5]. Pilot fa- tigue has been analyzed as the cause of many aviation ac-
Fatigue and Associated Factors among Airline Pilots
Hye Jin Kim, M.A.
1, Yun Young Choi, O.H.N.S., M.P.H.
1,21Aeromedical Center, Korean Air, Seoul, 2Department of Nursing, Inha University College of Medicine, Incheon, Korea
Original Article
pISSN: 1738-2548 • eISSN: 2713-9972 https://doi.org/10.46246/KJAsEM.210009
Received: May 20, 2021 Revised: August 9, 2021 Accepted: August 13, 2021 Corresponding Author Yun Young Choi
Aeromedical Center, Korean Air, 260 Haneul- gil, Ganseo-gu, Seoul 07505, Korea Tel: +82-2-2656-3840
Fax: +82-2-2656-8848
E-mail: [email protected] ORCID
https://orcid.org/0000-0002-0626-8986
Purpose: This study aimed to identify the prevalence of fatigue and its associated
factors leading to the fatigue among Korean commercial airline pilots.
Methods: An anonymous, web-based questionnaire collecting data on sleep related
characteristics was completed by airline pilots. The final 1,029 samples of completed questionnaires were analyzed. The association of the risk factors with fatigue was determined using logistic regression analysis.
Results: The prevalence of fatigue was 60% (Fatigue Severity Scale index≥3.2),
disturbed sleep 28% (Pittsburgh Sleep Quality Index≥9), daytime sleepiness 17%
(Epworth Sleepiness Scale≥10), and sleep apnea (Berlin Questionnaire≥2) 11%. The fully adjusted logistic regression showed that quality of life (odds ratio [OR]=0.16, confidence interval [CI]=0.11–0.24), daytime sleepiness (OR=1.26, CI=1.18–1.34), sleep quality (OR=1.44, CI=1.29–1.61), mental workload (OR=1.10, CI=1.05–1.14), vigorous physical activity (OR=0.82, CI=0.72–0.92), late starts (OR=1.25, CI=1.06–
1.46) and average weekly flying hours (OR=1.02, CI=1.00–1.03) were associated with higher levels of fatigue.
Conclusion: Lower quality of life, disturbed sleep, more subjective sleepiness, shorter
sleep duration, higher mental workload, less vigorous physical activity, frequent late starts, and longer flying hour were shown to be risk factors for fatigue in airline pilots.
These findings should be taken into account in the development of sleep and fatigue countermeasures for airline pilots.
Keywords: Fatigue, Quality of life, Pilots, Sleep apnea syndromes, Sleepiness
KJA s EM
THE KOREAN JOURNAL OF AEROSPACE & ENVIRONMENTAL MEDICINE
cidents and continues to be a problem facing flight crews in flight. National Transportation Safety Board (NTSB) [6]
indicates that nearly 20% of the 182 major NTSB investi- gations completed from January 1, 2001 to December 31, 2012, identified fatigue contributing factors, or probable, findings.
The aviation industry has managed pilot fatigue in a prescriptive approach that is flight crew scheduling pro- visions and flight time limitations with minor changes since its inception. However, the traditional way has faced the limitation of effectively managing pilot fatigue from exposure to various risk factors. Therefore in 2011, ICAO Standards and Recommended Practices in various Annexes supported two distinct methods for managing fatigue: one is a prescriptive approach, and the other is a performance-based approach to implement a Fatigue Risk Management System (FRMS), focusing on the man- agement of actual fatigue risk in the operations to which it applies [7]. Korean aviation industry recognizes the need to improve the pilot fatigue management system in line with international trends, but few scientific studies were available to support it.
Therefore, the purpose of this study was to investigate the prevalence of fatigue and sleep problems among Ko- rean commercial airline pilots and determine the risk factors associated with their fatigue. It will be used as the baseline data for establishing FRMS in Korea.
II. MATERIALS AND METHODS
A cross-sectional study was carried out based on data derived from the Fatigue Survey for Korean pilots from commercial airline Korean Air in 2017. Data collection was performed utilizing an anonymous web-based ques- tionnaire applied over July and August 2017. The survey was conducted via the airline’s intranet for all pilots for health care for pilots. Participation was voluntary, and data confidentiality was maintained. The inclusion crite- ria were all Korean pilots from Korean Air on active duty at the time of the investigation, between the ages of 21 and 65 years, who had flown in the last six months. Of the 2,236 questionnaires distributed, 1,091 (48.8%) were returned. Thirty-one trainee pilot data, 29 missing data on major variables (fatigue, sleep), and 2 missing data on demographic information were excluded. The final 1,029 samples with completed data were analyzed. This study
was approved by the Institutional Review Board of Inha University (180329-1A/IRB).
The dependent variable was the perceived level of fa- tigue, obtained using the Fatigue Severity Scale (FSS) [8].
FSS is a self-report questionnaire composed of 9 items, based on the fatigue state in the previous week, rated on a 7-point Likert scale, ranging from “1: strongly disagree”
to “7: strongly agree”. FSS index score was acquired by adding up all items and then dividing the sum by 9. The scale evaluates perceived degree of fatigue in daily situa- tions. Results at or above 3.2 indicate a clinically signifi- cant level of fatigue and led to a sensitivity of 84.1% and specificity of 85.7% for the fatigue and control groups, respectively, in the validation study of the Korean version of FSS. Participants were divided into fatigue and normal group using FSS index 3.2 as the cut-off point.
The independent variables were sociodemographic fac- tors, labor-related characteristics, lifestyle, health-related characteristics, mental workload, quality of life, and sleep-related factors.
Sociodemographic factors considered were age, sex, and living with a preschooler. The information about whether they live with preschoolers was investigated because it might limit their chance of resting when they stay at home. Labor-related characteristics included professional category (captain or first officer), airline tenure, annual flying hours, the flying hour in the previous week, number of early starts (05:00–06:59), late starts (22:00–23:59), and night starts (00:00–04:59), number of sectors flown and number of duty of Window of Circadian Low (WOCL) pe- riod in the previous month.
Lifestyle and health-related characteristics included smoking and alcohol use status, physical activities, and medical treatment in the past year. Two questions ob- tained the information about physical activities: 1) the number of days more than 20 minutes of vigorous physi- cal activity; and 2) the number of days more than 30 min- utes of moderate physical activity in the previous week.
National Aeronautics and Space Administration Task Load Index (NASA-TLX) assessed perceived mental work- load among pilots. Participants were asked to respond about the mental workload across their flight duty. NASA- TLX consists of six questions, rated on a 7-point scale, with the total score ranging from 0 to 42. Higher scores indicate more mental workload.
The quality of life was measured using the Korean ver-
sion of the World Health Organization Quality of Life Instruments-Brief (WHOQOL-BREF) scale [9]. WHOQOL- BREF is an abbreviated version of the Quality of Life Scale developed by the World Health Organization. It contains 26 questions, consisting of 4 domains; physical health, psychological health, social relationship, and environ- ment, rated on a 5-point scale. The QOL score is obtained by putting in all items and dividing the sum by 26.
The sleep characteristics were assessed using validated psychological instruments: the Pittsburgh Sleep Quality Index (PSQI) for sleep complaints, Berlin Questionnaire (BQ) for symptoms of obstructive sleep apnea (OSA), and Epworth Sleepiness Scale (ESS) for daytime sleepiness.
PSQI [10] is a self-report questionnaire that measures sleep quality. It consists of 18 questions, and it yields 7 component scores: sleep quality, sleep duration, sleep induced latency, sleep efficiency, sleep disorder, use of sleeping pills, and daytime dysfunction—the score of each component is 0 to 3. The total score on PSQI is from 0 to 21, and the score of ≥9 is associated with poor sleep quality.
BQ [11] is a validated questionnaire containing ten questions that search for known symptoms and charac- teristics of OSA. The BQ allows for the categorization of respondents into high and low-risk categories for OSA.
ESS [12] is a self-report questionnaire composed of 8 items, which assess the likelihood of dozing in daily liv- ing situations. Items are rated on a 4-point Likert scale ranging from 0 (no probability of falling asleep) to 3 (high probability of falling asleep). The full scale ranges from 0 to 24, and if an individual has a score at or above 10, it indicates excessive daytime sleepiness.
1. Statistical Analysis
The data were summarized using descriptive statistics;
quantitative variables were presented as means and stan- dard deviations, and categorical variables as frequencies and proportions. Student t-test and chi-squared tests were used to compare all fatigued and normal groups’ vari- ables. For all tests, statistical significance was defined at the 0.05 level. Multiple logistic regression was carried out to identify factors related to fatigue. Results are presented as odds ratios and 95% confidence intervals. Data were analyzed using IBM SPSS statistics, version 22.0 (IBM Co., Armonk, NY, USA).
III. RESULTS
1. Participants' Demographic, Labor, and Health/
Lifestyle Characteristics
The sample of 1,029 pilots comprised 98.9% males, and the proportion of the captain and the first officer was similar (49.8% captains and 50.2% first officers). The mean age of the participants was 45.4±8.3 years, and the mean duration of airline tenure was 12.9±9.1 years. The mean number of days more than 20 minutes of vigorous physi- cal activity per week was 2.0±1.5 (Table 1).
Table 1. Participants’ characteristics
Category Variable Participant
(n=1,029)
Socio-demographic Age (yr) 45.4±8.3
Sex
Male 1,018 (98.9)
Female 11 (1.1)
Preschooler living together
Yes 199 (19.3)
No 830 (80.7)
Labor Professional category
Captain 512 (49.8)
First officer 517 (50.2) Airline tenure (yr) 12.9±9.1 Flight time (hr)/yr 712.5±242.4 Flight time (hr)/wk 22.5±11.8 Early starts (05:00–06:59) /mo 2.2±2.6 Night starts (00:00–04:59) /mo 0.8±1.3 Late starts (22:00–23:59) /mo 0.9±1.2
Flown sectors/mo 12.8±11.0
WOCL duty (02:00–05:59) /mo 3.6±2.6 Lifestyle/Health Smoker
Yes 197 (19.1)
No 832 (80.9)
Alcohol consumption
Yes 804 (78.1)
No 225 (21.9)
Vigorous physical activity/wk 2.0±1.5 Medical treatment/last yr
Yes 393 (38.2)
No 636 (61.8)
WHOQOL score 3.5±0.6
NASA TLX total 30.9±4.8
Values are presented as mean±standard deviation or number (%).
WOCL: Window of Circadian Low, WHOQOL: WHO Quality of Life Score,
2. Sleep and Fatigue-Related Characteristics
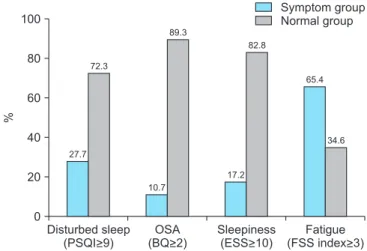
The FSS results showed that 617 (60.0%) participants had significant fatigue (FSS index≥3.2), while the ESS score showed that 177 (17.2%) participants had excessive daytime sleepiness (score≥10).
Although the average sleep duration of the pilots was 6.9±1.2 hours a day, 27.7% participants reported severe sleep disturbance (PSQI≥9.0). The participants who re- sponded that they had experience using sleeping medica- tion were 6.3% of the total. According to the BQ results, 110 (10.7%) pilots displayed a high risk of OSA (BQ≥2.0), requiring further assessment (Fig. 1).
3. Comparison between All the Variables of the Fatigued Group and the Normal Group
When comparing the fatigued group (FSS index≥3.2) with the normal group (FSS index<3.2), the pilots with fatigue were significantly younger (44.4±8.0 vs. 46.8±8.4 years, P<0.001), and the mean duration of airline tenure was significantly shorter in the fatigued group (12.2±8.8 vs. 14.0±9.5 years, P<0.01). There was no significant dif- ference in the frequency of living with a preschooler.
For the fatigued group, the number of night starts (0.9±
1.4 vs. 0.7±1.1, P<0.01), the number of late starts (1.1±
1.3 vs. 0.8±1.1, P<0.001), the number of WOCL duty pe- riod (4.0±2.8 vs. 2.9±2.0, P<0.001), and average weekly fiying hours (24.2±12.5 vs. 20.0±10.3, P<0.001) were significantly higher than in the normal group. However,
the number of early starts, annual flying time, and the number of flown sectors were not significantly different between the fatigued and normal groups.
The frequency of vigorous physical activity was sig- nificantly lower (1.8±1.4 vs. 2.2±1.6, P<0.001) in the fatigued group than in the normal group, while the pro- portion of outpatient treatment during the last year was higher (42.6% vs. 31.6%, P<0.001). On the other hand, there was no significant difference in the alcohol con- sumption and smoking between fatigue and the normal group.
Fatigued pilots were also more likely to have disturbed sleep (PSQI 8.1±2.8 vs. 5.1±2.2, P<0.001), shorter sleep duration (6.7±1.2 vs. 7.1±1.0, P<0.001), and higher use of sleep medication (8.9% vs. 2.4%). Furthermore, the fa- tigue group was shown to be at high risk of OSA (15.7%
vs. 3.2%, P<0.001), excessive daytime sleepiness (7.6±4.0 vs. 4.0±2.6, P<0.001), lower quality of life (3.2±0.5 vs. 3.9
±0.5, P<0.001), and higher mental workload (31.8±4.6 vs. 29.5±4.7, P<0.001).
The fully adjusted logistic regression showed that qual- ity of life (odds ratio [OR]=0.16 95%, confidence inter- val [CI] 0.11–0.24), daytime sleepiness (OR=1.26, 95%
CI=1.18–1.34), sleep quality (OR=1.44, 95% CI=1.29–1.61), mental workload (OR=1.10, 95% CI=1.05–1.14), vigorous physical activity (OR=0.82, 95% CI=0.72–0.92), late starts (OR=1.25, 95% CI=1.06–1.46) and average weekly flying hours (OR=1.02, 95% CI=1.00–1.03) were associated with all higher fatigue (Table 2).
IV. DISCUSSION
This is the first study to scrutinize the prevalence of fatigue and associated factors among Korean pilots of a Full-Service Carrier. Of 2,236 questionnaires distributed to Korean pilots, almost half of the pilots (48.8%) partici- pated in this study voluntarily. We found that 60% of the respondents were suffering from fatigue. Similar findings have been reported in previous studies, with 60% (739 air- line pilots/Long Haul flights in 2003 [13]), 68.3 % (among Gulf Cooperation Council commercial airline pilots in 2017 [14]), and the participating pilots being classified fa- tigued. Recently a significant barometer study performed by the European Cockpit Association on over 6,000 pilots in 8 European countries [15] showed pilots more than 50% of investigated pilots experience fatigue as impairing
Disturbed sleep(PSQI>9) 100
80
60
40
20
%
0
Symptom group Normal group
OSA (BQ>2)
Sleepiness (ESS>10)
Fatigue (FSS index>3) 27.7
72.3
10.7 89.3
17.2 82.8
65.4
34.6
Fig. 1.
Sleep and fatigue-related characteristic of the par-
ticipants (n=1,029). PSQI: Pittsburgh Sleep Quality Index,
OSA: Obstructive Sleep Apnea, BQ: Berlin Questionnaire,
ESS: Epworth Sleepiness Scale, FSS: Fatigue Severity
Scale.
their ability to perform well in flight.
We also found that the average sleep duration of the pi- lots was 6.9±1.2 hours a day, while the mean PSQI score was 6.9±3.0. If the PSQI score is 9.0 or more, the qual- ity of sleep is deemed clinically significant. Participants’
overall sleep quality was not very good, similar to that of people with OSA (PSQI score: 6.8±3.1) [16]. However, in our study, 17.2% of participants had excessive daytime sleepiness, while according to the European Cockpit As- sociation pilots in the UK (43%), Denmark (50%), Norway (53%), and Sweden (54%) of the surveyed pilots described falling asleep involuntarily in the cockpit during flying.[15].
The prevalence of excessive daytime sleepiness, which could interfere with flying, was reported lower in our study than among other national pilots. Hence, it might be considered under-reported in our pilot sample.
Our results showed that 10.7% of pilots indicated a high
risk of OSA requiring further evaluation, while Gulf Coop- eration Council commercial airline pilots in 2017 showed that 29.3% of pilots were categorized as having a high risk of OSA assessed using the BQ. OSA varies in epidemiol- ogy from 2% to 17%, depending on the severity and racial ethnicity. Untreated OSA might result in sudden inca- pacitation and even death due to cardiovascular or cere- brovascular events. Considering that a higher probability of being an OSA was found in the fatigue group than the normal group (15.7% vs. 3.2%, P<0.001), the proper man- agement for OSA will lower their fatigue level. From this perspective, the Korean government has recommended that OSA screening be carried out for annual aviation medical examinations since 2018 according to the new guideline.
When dividing the fatigued and normal group on the captain and first officer, we found that fatigued group
Table 2. Comparison between all the variables of the fatigued group and the normal group (n=1,029)Variable Normal (n=412) Fatigued (n=617) F/χ2 (P-value) OR (95% CI)
Age (yr) 46.8±8.4 44.4±8.0 21.7 (<0.001) NS
Professional category
Captain 236 (57.3) 276 (44.7) 15.6 (<0.001) NS
First officer 176 (42.7) 341 (55.3)
Preschooler living together
Yes 73 (17.7) 126 (20.4) 1.16 (>0.05)
No 399 (82.3) 491 (79.6)
Airline tenure 14.0±9.5 12.2±8.8 9.7 (<0.01) NS
Early starts/mo 2.1±2.6 2.4±2.5 3.2 (>0.05)
Night starts/mo 0.7±1.1 0.9±1.4 9.1 (<0.01) NS
Late starts/mo 0.8±1.1 1.1±1.3 11.1 (<0.001) 1.25 (1.06–1.46)
Flown sectors/mo 12.6±11.7 13.0±10.6 0.4 (>0.05)
WOCL duty/mo 2.9±2.0 4.0±2.8 45.6 (<0.001) NS
Flying hr/yr 695.4±252.9 724.0±234.6 3.4 (>0.05)
Flying hr/wk 20.0±10.3 24.2±12.5 31.4 (<0.001) 1.02 (1.00–1.03)
Vigorous physical activity 2.2±1.6 1.8±1.4 25.1 (<0.001) 0.82 (0.72–0.92)
Smoker 76 (18.4) 121 (19.6) 0.2 (>0.05)
Drinker 321 (77.9) 483 (78.3) 0.2 (>0.05)
Medical treatment 130 (31.6) 263 (42.6) 12.8 (<0.001) NS
WHOQOL score 3.9±0.5 3.2±0.5 355.9 (<0.001) 0.16 (0.11–0.24)
NASA TLX total 29.5±4.7 31.8±4.6 61.3 (<0.001) 1.10 (1.05–1.14)
PSQI total 5.1±2.2 8.1±2.8 305.0 (<0.001) 1.44 (1.29–1.61)
Sleep duration 7.1±1.0 6.7±1.2 25.6 (<0.001) 1.43 (1.14–1.80)
Sleep medication 10 (2.4) 55 (8.9) 17.6 (<0.001) NS
High risk of OSA 13 (3.2) 97 (15.7) 40.9 (<0.001) NS
ESS total 4.0±2.6 7.6±4.0 261.6 (<0.001) 1.26 (1.18–1.34)
Values are presented as mean±standard deviation or number (%).
WOCL: Window of Circadian Low, WHOQOL: WHO Quality of Life Score, NASA TLX: NASA Task Load Index, PSQI: Pittsburgh Sleep Quality Index, OSA:
Obstructive Sleep Apnea, ESS: Epworth Sleepiness Scale, NS: not significant.
pilots were more likely to be first officers (55.3% vs.
42.7%, P<0.001). A similar finding has been reported in a previous study, with more first officers (50.4% vs. 38.5%, P=0.043; among Gulf Cooperation Council commercial airline pilots in 2017 [14]) among the participating pilots being classified as fatigued. Captains are more experi- enced and thus, better adapted to stress subjects, as they have reached the peak of their career. Having the power of seniority, they have a certain power to control some of the stressors (via schedule/shift assignment). First pilots are less experienced, and they have less time to adapt to and control their environment. Financial factors play a significant role as well.
When comparing the fatigued group with the normal group, we found that fatigue in airline pilots was associ- ated with several sociodemographic-, labor-, health and life-, and sleep-related factors.
After total adjustment, our results showed that disturbed sleep was associated with a 44% increase in fatigue odds, while shorter sleep duration was associated with a 43%
increase of the odds. More subjective sleepiness was as- sociated with a 26% increase in odds of fatigue. These results support the internationally observed trends in air- line pilot fatigue [2,17-19]. Laberge et al. [20] in a survey of 1,566 pilots, found that more inferior subjective sleep quality, more significant sleep disturbances, greater sleep needs, and higher day time dysfunction on the PSQI were associated with higher fatigue levels. These findings are consistent with our outcomes.
Our results showed that quality of life and vigorous physical activity were critical preventive factors to con- sider. Higher quality of life was associated with an 84%
decrease in fatigue odds, while frequent vigorous physical activity was associated with an 18% decrease in the odds.
Quality of life includes physical health-, psychological-, social relationships-, environment- domains.
Steptoe and Bostock [21] found low self-assessed gener- al health related to a higher risk for fatigue, and fatigued pilots were less likely to exercise during leisure time, in- dicating the reciprocity of the association between these factors. van Drongelen et al. [22] also found that pilots scored higher on work-life balance disturbance, scored lower on general health perception, were less physically active, and were at higher risk for fatigue. It might be helpful to consider how to improve pilots' quality of life in general, focusing on their work environment and their
personal life. Moreover, the ICAO guidelines, “Fitness to Fly – A medical guide for pilots” [23] also highlighted the importance of physical activity, citing “GET ACTIVE”, a program to promote pilots' physical activity and mental health as a way to decrease pilot’s fatigue level. It will be helpful to inform pilots about the usefulness of exercise in managing physical fitness and fatigue and encourage them to improve physical activity.
We also found that late starts (22:00–23:59) were asso- ciated with a 25% increase in fatigue odds, and average flying hours per week were associated with a 2% increase in odds of that. Also, the mental workload was associ- ated with a 10% increase in the odds. The previously mentioned study [21] among airline pilots found that the prevalence of fatigue was significantly higher among pi- lots who described high job demands and low social sup- port. Interestingly, the labor-related factors except for late starts and average flying hour per week were not as- sociated with fatigue in logistic regression analyses of this study.
Our study has a few limitations. Limitations in the study design and cross-sectional surveys do not demonstrate a causal relationship between the identified factors and fatigue. Longitudinal studies are required to examine the relationship between risk factors for and consequences of fatigue. Furthermore, our labor-related information may not be consistent with actual flight patterns because it is self-reported. In addition, we did not consider duty rosters and sleep patterns in detail. PSQI was limited in assessing the quality of sleep of pilots working in shifts and irregular work hours. However, finding an appropri- ate metric to assess the pilot’s irregular sleep condition at the aviation physical examination site was difficult. The development of a tool that can assess pilots' sleep in the field setting is desired.
V. CONCLUSION
The present study showed that the risk factors for sub-
jective fatigue among airline pilots included person-,
health-, lifestyle-and work-related characteristics. It was
shown that lower quality of life, disturbed sleep, more
subjective sleepiness, shorter sleep time, higher mental
workload, less vigorous physical activity, frequent late
starts, and more extended flying hours were associated
with fatigue. These results should be taken into account
during development of sleep and fatigue countermeasures for airline pilots.
CONFLICTS OF INTEREST
No potential conflict of interest relevant to this article was reported.
ORCID
Hye Jin Kim, https://orcid.org/0000-0002-9939-6361 Yun Young Choi, https://orcid.org/0000-0002-0626-8986
AUTHOR CONTRIBUTIONS
Conceptualization: YYC, HJK. Data curation: HJK.
Analysis and interpretation: HJK, YYC. Writing the origi- nal draft: YYC. Critical revision of the article: YYC, HJK.
Final approval of the article: YYC.
REFERENCES
1. International Civil Aviation Organization. Manual of civil aviation medicine. 3rd ed. Montréal: International Civil Aviation Organization; 2012. pp. II-1-1-II-1-18.
2. Caldwell JA. Fatigue in aviation. Travel Med Infect Dis 2005;3:85-96. https://doi.org/10.1016/j.tmaid.2004.07.008 3. Rosekind MR, Gander PH, Gregory KB, Smith RM, Miller
DL, Oyung R, et al. Managing fatigue in operational set- tings 2: An integrated approach. Behav Med 1996;21:166- 170. https://doi.org/10.1080/08964289.1996.9933754 4. Sack RL. Clinical practice. Jet lag. N Engl J Med 2010;362:
440-447. https://doi.org/10.1056/NEJMcp0909838
5. Neu D, Kajosch H, Peigneux P, Verbanck P, Linkowski P, Le Bon O. Cognitive impairment in fatigue and sleepiness associated conditions. Psychiatry Res 2011;189:128-134.
https://doi.org/10.1016/j.psychres.2010.12.005
6. National Transportation Safety Board. Reduce fatigue-relat- ed accidents [Internet]. Washington, D.C.: National Trans- portation Safety Board; 2016 [cited 2021 Mar 15]. Available from: https://www.ntsb.gov/safety/mwl/Documents/2017- 18/2017MWL-FctSht-Fatigue-A.pdf.
7. International Civil Aviation Organization. FRMS: fatigue risk management systems — manual for regulators. Mon- tréal: International Civil Aviation Organization; 2012.
8. Chung KI, Song CH. Clinical usefulness of fatigue severity scale for patients with fatigue, and anxiety or depression.
Korean J Psychosom Med 2001;9:164-173.
9. Min SK, Lee CI, Kim KI, Suh SY, Kim DK. Development of Korean version of WHO quality of life scale abbreviated
2000;39:571-579.
10. Sohn SI, Kim DH, Lee MY, Cho YW. The reliability and validity of the Korean version of the Pittsburgh Sleep Quality Index. Sleep Breath 2012;16:803-812. https://doi.
org/10.1007/s11325-011-0579-9
11. Kang K, Park KS, Kim JE, Kim SW, Kim YT, Kim JS, et al.
Usefulness of the Berlin Questionnaire to identify patients at high risk for obstructive sleep apnea: a population-based door-to-door study. Sleep Breath 2013;17:803-810. https://
doi.org/10.1007/s11325-012-0767-2
12. Cho YW, Lee JH, Son HK, Lee SH, Shin C, Johns MW. The reliability and validity of the Korean version of the Epworth sleepiness scale. Sleep Breath 2011;15:377-384. https://doi.
org/10.1007/s11325-010-0343-6
13. Bourgeois-Bougrine S, Carbon P, Gounelle C, Mollard R, Coblentz A. Perceived fatigue for short- and long-haul flights: a survey of 739 airline pilots. Aviat Space Environ Med 2003;74:1072-1077.
14. Aljurf TM, Olaish AH, BaHammam AS. Assessment of sleepi- ness, fatigue, and depression among Gulf Cooperation Council commercial airline pilots. Sleep Breath 2018;22:411- 419. https://doi.org/10.1007/s11325-017-1565-7
15. European Cockpit Association. Barometer on pilot fatigue [Internet]. Brussels: European Cockpit Association; 2012 [cited 2021 Mar 15]. Available from: https://www.eurocock- pit.be/positions-publications/barometer-pilot-fatigue.
16. Woo SM, Jeon JY, Kim DE, Hwang SH, Cho YW. Quality of life in Korean patients with obstructive sleep apnea. J Ko- rean Neurol Assoc 2014;32:240-245.
17. Caldwell JA, Mallis MM, Caldwell JL, Paul MA, Miller JC, Neri DF; Aerospace Medical Association Fatigue Countermeasures Subcommittee of the Aerospace Human Factors Committee.
Fatigue countermeasures in aviation. Aviat Space Environ Med 2009;80:29-59. https://doi.org/10.3357/asem.2435.2009 18. Petrilli RM, Roach GD, Dawson D, Lamond N. The sleep, subjec-
tive fatigue, and sustained attention of commercial airline pilots during an international pattern. Chronobiol Int 2006;23:1357- 1362. https://doi.org/10.1080/07420520601085925
19. Reis C, Mestre C, Canhão H, Gradwell D, Paiva T. Sleep complaints and fatigue of airline pilots. Sleep Sci 2016;9:73- 77. https://doi.org/10.1016/j.slsci.2016.05.003
20. Laberge L, Gaudreault M, Boudreau P, Dumont G, Boivin DB. 0708 Predictors of perceived fatigue: a survey of 1,566 commercial airline pilots. Sleep 2017;40(Suppl 1):A262.
https://doi.org/10.1093/sleepj/zsx050.707
21. Steptoe A, Bostock S. A survey of fatigue and well-being among commercial airline pilots. London: UCL Psychobiol- ogy Group; 2012.
22. van Drongelen A, Boot CR, Hlobil H, Smid T, van der Beek AJ. Risk factors for fatigue among airline pilots. Int Arch Occup Environ Health 2017;90:39-47. https://doi.
org/10.1007/s00420-016-1170-2
23. International Civil Aviation Organization. Fitness to fly - a medical guide for pilots. Montréal: International Civil Avia-