INTRODUCTION
Routine lake and reservoir monitoring pro- grams often include a limited suite of physical, chemical (and sometimes biological) attributes,
due to constraints of funding, trained staff, and research equipment. Some of the most commonly measured attributes are TP, TN, CHL and SD.
The methods for collection of these samples are relatively simple, and most research laboratories have the capability to perform the necessary ana-
* Corresponding author: Tel: +561-682-6534, Fax: +561-682-6442, E-mail: [email protected]
─
─ 187 ──
Using Trophic State Index (TSI) Values to Draw Inferences Regarding Phytoplankton Limiting Factors and Seston Composition from Routine Water Quality Monitoring Data
Karl E. Havens
(South Florida Water Management District, West Palm Beach, Florida 33416, USA)
영양상태지수(trophic state index)를 이용한 수체 내 식물플랑크톤 제한요인 및 seston조 성의 유추. Karl E. Havens (South Florida Water management District, West Palm Beach, Florida 33416, USA)
호수 내seston조성 및 식물플랑크톤 성장을 제한하는 요인들을 평가하기 위해서는 일반적으로 시
료가 담긴 용기 내에 영양물질을 투입하는 생물검정(bioassay) 방법이나, 섭식(grazing) 실험, seston의 size 분석 등과 같은 직접적이고 시간적 노력이 필요한 방법을 이용한다. 그러나 이 논문 에서는 동일한 목적을 위하여, 총인(TP), 엽록소(CHL), 투명도(Secchi depth, SD) 자료에 의해 계 산한 Carlson의 영양상태지수(TSI)들의 상호편차(deviation)를 이용하는 보다 간편한 방법을 소개 하였다. 본 연구에서 TSI 편차분석을 위하여 아열대지역의 대형호수(Lake Okeechobee, 미국 플로 리다)의 수질자료와 다른 많은 호수들로부터 수집된 자료를 이용하였다. 일단 연구자가 일상적인 수질자료를 수집하여 총인, Chl-a, 투명도 값을 기초로 TSI값을 얻었다면, 이로부터 여러 가지 해 석이 도출될 수 있다. 한편, 총질소의 자료도 총인과 마찬가지로 영양물질에 대한 자료로 중요하게 이용될 수 있다. TSI (CHL) 값이 TSI (TP) 값보다 훨씬 작다면, 인(P)이 아닌 다른 요인이 조류의 성장을 제한한다고 유추할 수 있다. 만약 TSI (CHL) 값이 TSI (SD) 값보다 훨씬 작다면 호수 내 seston 중 아주 작은 무생물적 입자들의 구성비가 높다고 추정할 수 있으며, 이 경우 빛이 제한 요 소가 될 것이다. 반대로, TSI (CHL) 값이 TSI (TP) 값보다는 작지만TSI (SD) 값보다 크다면, 수중의 빛을 산란시키는 입자들이 크기가 크다고(예를 들면, 큰 사상성 또는 군체성 조류) 추정할 수 있고, 이 경우 조류의 성장은 동물플랑크톤의 섭식에 의해 제한을 받을 가능성이 크다. 이러한 분석의 결 과는 신뢰성과 일관성이 매우 높으며, 일반적으로 상기한 다른 직접적인 방법들에 의해 얻어진 결 과들과도 잘 일치한다. TSI의 편차를 이용한 방법으로부터 도출된 결과를 위의 직접적인 방법을 통해 주기적으로 검증할 필요는 있지만, 호수관리를 위해 수질과 생태학적 반응 요인들을 모니터 링하고, 나아가 장기적으로 호수의 변화를 이해하는데 보다 효율적이고 경제적인 방법을 제공할 수 있어 이용가치가 매우 높다고 사료된다.
Key words : Phytoplankton, Limiting factors, Trophic state index, Seston, Particle size
lytical procedures. Once the data are processed, scientists and managers often use the informa- tion to infer trends in lake eutrophication. A com- mon approach is to transform the data into ‘troph- ic state index’ (TSI) values, using equations from the published literature. The best known TSI values are those of Carlson (1977), which involve natural log transformations of TP ( µ g/L), CHL ( µ g/L) and SD (m) data in a manner that produces index values having equivalent numerical scales ranging from 0 to 100. Each 10-fold increase of an index value then represents an approximate doubling of algal biomass. Kratzer and Brezonik (1981) developed an analogous TSI for TN ( µ g/L).
Taken together the equations are as follows:
TSI (CHL) = 10 * [6-(2.04-0.68 lnCHL)/ln2] (1) TSI (TP) = 10 * [6-ln (48/TP)/ln2] (2) TSI (SD) = 10 * [6-lnSD/ln2] (3) TSI (TN) = 10 * [6-ln (1.47/TN) ln2] (4) It is important to recognize that Carlson (1977) developed his TSI equations based on relation- ships between TP, CHL, and SD in a set of tem- perate lakes where plankton were P-limited and where phytoplankton dominated underwater light attenuation. Under these circumstances one can expect good agreement between the three index values, and in fact, many investigators simply average the values to obtain a single index score (e.g., Kratzer and Brezonik 1981, Osgood 1982).
This averaging is a concern because it results in the loss of important information about the planktonic system in cases where there are large differences between the individual TSI values.
Carlson (1977) made note of this, saying that “All parameters when transformed to the trophic scale should have the same value. Any divergence from this value by one or more parameters demands investigation.” Carlson (1991) formalized this concept by describing a method to quantify dif- ferences among TSI values and displayed them graphically in order to infer conditions including nutrient limitation status and seston composi- tion.
This invited synthesis paper provides a general introduction to the concept of TSI differences, and illustrates by example how this approach has been used to infer seasonal and spatial patterns in the plankton of Lake Okeechobee, a large shal- low lake in south Florida, USA. Information also is provided to illustrate how the TSI approach can be used for inter-lake comparisons, and for
identifying lake responses to management ac- tions (e.g., biomanipulation of f ish stocks).
The Concept of TSI Differences
When there is good agreement between calcu- lated values of TSI (CHL) and TSI (SD), one may infer that algae dominate light attenuation (Carl- son, 1991). In contrast, when TSI (CHL) is sub- stantially lower than TSI (SD), this provides evi- dence that something other than algae, perhaps color or non-algal seston, is contributing to the light attenuation. Although not specifically noted by Carlson (1991), dominance by pico-plankton might also give rise to a negative difference bet- ween TSI (CHL) and TSI (SD), because the large surface area per unit biomass of small cells at- tenuates more light than larger nano- or mico- plankton (Edmondson 1980). There is evidence of this phenomenon in hypereutrophic Lake Apop- ka, Florida. The phytoplankton is dominated by the cyanobacterial picoplankter Synecococcus, light attenuation is largely due to algae, but TSI (CHL)< <TSI (SD) (Havens et al., 1999). In con- trast, when one encounters a large positive dif- ference between the index values, i.e. TSI (CHL)
> >TSI (SD), this suggests that the algae may be dominated by large particles (e.g., Aphanizomenon
‘flakes’) that have a smaller surface area per unit biomass, and therefore attenuate less light.
Edmondson (1980) noted that in Lake Washing- ton (USA), there sometimes are very great Secchi depths associated with high CHL concentrations when the water contains large visible aggregates of cyanobacteria. In summary, we can draw infer- ences regarding the composition of seston from TSI differences. The data necessary to draw the inference can be obtained at a low cost, and can be periodically validated using more costly direct methods (Table 1).
In the same manner, the deviation between TSI
(CHL) and TSI (TP) can be used to infer whether
or not P limitation occurs. When TSI (CHL) is
equal to or greater than TSI (TP), P generally is
limiting to algal growth. When TSI (CHL) is sub-
stantially lower than TSI (TP), this indicates
that there is less algal material present than ex-
pected based on TP, and that some other factor
may be limiting. This can be validated against
direct measurements of nutrient limitation (Table
1). Kratzer and Brezonik (1981) noted that in
tropical and subtropical regions the plankton
often is limited by N rather than P. They com-
pared results of standard nutrient-addition bioas- says with differences between TSI (TP) and TSI (TN) and found that the lesser of the two indices was the limiting nutrient.
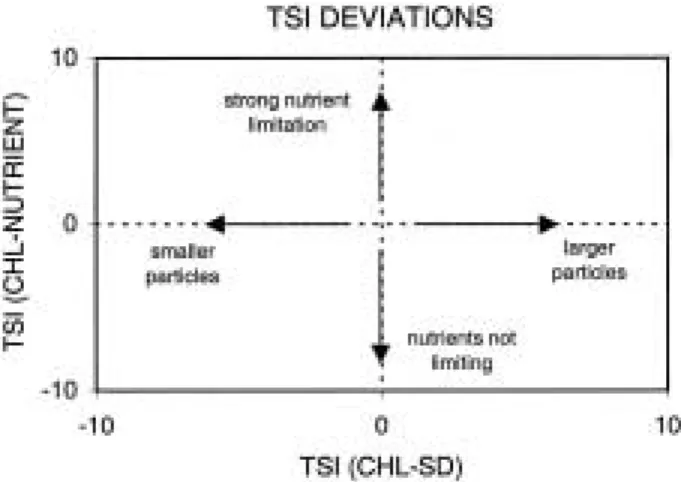
Carlson (1991) expanded on the concept of TSI differences by providing a two-dimensional gra- phical approach for assessing lakes. A slightly modif ied version is represented here (Fig. 1). If one simultaneously considers the TSI differences between CHL and SD (on the X-axis) and CHL
and TP or TN (on the Y-axis), four conditions are identified. Lakes in the upper right quadrant, in which TSI (CHL)> >TSI (SD) and TSI (CHL) > >
TSI (nutrient), are inferred to be nutrient-limit- ed with relatively large algae. Lakes in the lower left quadrant, in which TSI (CHL)<<TSI (SD) and TSI (CHL)< <TSI (nutrient), are inferred to have a high color or abiotic seston and light- limited algae. In the upper left quadrant, where TSI (nutrient)<<[TSI (CHL)]<<TSI (SD), the algae are inferred to be nutrient limited but small in size, whereas in the lower right quadrant, where TSI (nutrient)> >[TSI (CHL)]> >TSI (SD), algae are large in size and controlled by grazing.
Direct measurements of grazing impacts require time-intensive experiments, but they could be done periodically to validate the TSI results (Table 1). The concept of validation is an impor- tant one, because other lake-specif ic conditions might further inf luence the relationships bet- ween TSI values. As one example, Hosper (1997) noted that in lakes with Oscillatoria blooms, the amount of CHL per unit of TP is very high. Where this situation occurs, one might over-estimate the degree of P limitation based on the TSI approach.
RESULTS AND DISCUSSION
Inferences Regarding Plankton Seasonality in Lake Okeechobee
I have used TSI differences to develop hypothe-
Fig. 1. Differences among trophic state index (TSI) values indicate both the degree of nutrient limitation and the composition of seston, as described in the text.
Axes represent differences between TSI values based on chlorophyll a (CHL), nutrients, and Secchi depths (SD), and labels in the four quad- rants of the graph indicate the inferred conditions.
Table 1. A description of the data requirements and inferences that can be obtained by calculating and comparing trophic state index (TSI) values.
Data Sampling Frequency Inferences
Primary Data :
Total phosphorus (TP) These data can be collected at a high Potential limiting factors Total nitrogen (TN) frequency and at many sampling (nitrogen, phosphorus, light, Chlorophyll a (CHL) locations for a relatively low cost. of seston particles can be Secchi depth (SD) The number of sites that are sampled inferred.
will depend on the spatial and temporal heterogeneity of the lake.
Validation Data :
Nutrient addition bioassays These data require a greater expenditure These data validate the hypotheses Grazer removal experiments of time and money, and might only be derived from TSI analysis of Seston size structure data collected during a preliminary study a particular lake ecosystem.
Nutrient stoichiometry to “validate” the TSI approach, and on latter dates if conditions in the lake are observed to dramatically change.
ses regarding the seasonality of phytoplankton limiting factors (Havens, 1994) and the contribu- tion of algae and abiotic seston to underwater light attenuation (Havens, 1995a) in Lake Okee- chobee. The hypotheses subsequently have been tested and supported by controlled experiments (Havens et al., 1996, Phlips et al., 1997) and eco- logical process studies (Havens et al., 1996, Havens et al., 2000). Even prior to the first use of TSI differences in Lake Okeechobee, the method was validated by comparison of results with infor- mation from whole-community nutrient-addi- tion bioassays (Havens, 1994). During 1990 to 1992, Aldridge et al. (1995) performed nutrient assays at monthly intervals, using water from f ive pelagic locations. Three locations (north, central, and west pelagic) corresponded to sites where the South Florida Water Management District (SFWMD) also collected monthly data on TP, TN, CHL, and SD. I used the data to develop TSI dif- ferences, and compared these with the assay results on a seasonal basis. There generally was good agreement between the two methods (Table 2), in that the same major limiting factors were identif ied in each season at the three sites.
Similar validations performed in the late 1990s also indicate good agreement between methods.
With this information in mind, I now will des- cribe some of the seasonal patterns that can be inferred for the lake. The long-term monitoring program of the SFWMD includes eight pelagic stations that have been sampled on a monthly or semi-monthly basis since 1973 (see James et al.,
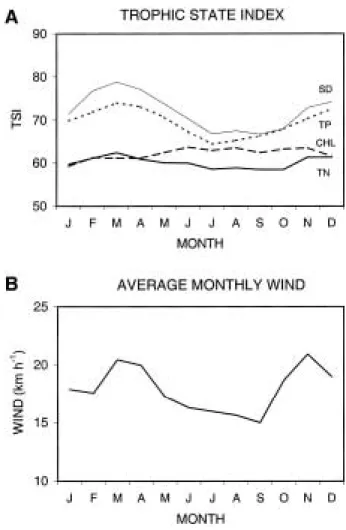
1995). Here I present trends based on the last 10 full years of data (1987~1998) where TSI values are calculated for each station and date, and then averaged to provide monthly lake-wide means (Fig. 2A). The results indicate little seasonal variation in TSI (TN), a small summer-autumn increase in TSI (CHL), and strong seasonal vari- ation in TSI (SD) and TSI (TP). The seasonal pat- terns of SD and TP correlate with variations in wind velocity over the lake (Fig. 2B), a relation- ship that has previously been noted (Maceina and Soballe, 1990; Havens, 1995a). During spring and autumn, when wind velocities are highest,
Table 2. A summary of validation results for using the TSI method to estimate phytoplankton limiting factors in Lake Okeechobee, Florida, USA. Data are presented from three pelagic stations in four seasons, when nutrient-addition bioassays were performed (Aldridge et al., 1995) coincident with regular water quality monitoring. The symbols indicate limiting factors inferred from the bioas- says (N = nitrogen, P = phosphorus, NP = co-limi- tation, U = unlimited by nutrients, most likely limited by light) and from the TSI method (sym- bols in parentheses).
Season
Station
North Central West
Winter U, N (U) U, N (U) N, NP (N, NP) Spring N, U (N,U) U, N (U) N, U (U, N) Summer N, U (N,U) N, U (N) N, NP (NP) Fall N, U (N,U) N, U (N) N, NP (NP)
Fig. 2. A. Trophic state index (TSI) values based on ten years of monthly averaged data from an 8 station pelagic monitoring network in Lake Okeechobee, Florida, USA. Data labels are SD = Secchi depth, TP = total phosphorus, TN = total nitrogen, and CHL = chlorophyll a. B. Average monthly wind velocities over the lake, recorded during the same time period.
TSI (SD) and TSI (TP) are very high. During sum- mer, when wind velocities are lowest, these TSI values also are low, and they deviate less from TSI (CHL).
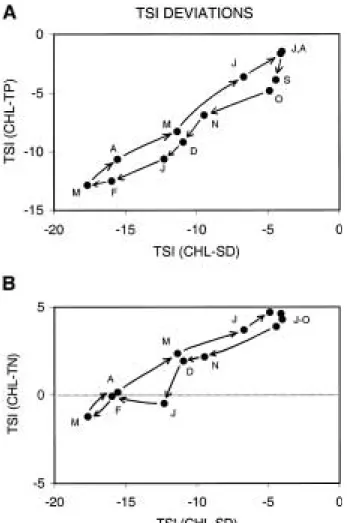
A second approach for evaluating TSI differ- ences is to use the two-dimensional graph shown in Fig. 1. I re-plotted the data in this format (Fig.
3A-B), labeled the points according to months of sampling, and connected the time series with ar- rows. Two important results emerge. First, using this graphical approach, a seasonal cycle is read- ily apparent. Second, the cycle carries the data into the nutrient-limited region of the graph on the TSI (TN) plot, but not on the TSI (TP) plot.
This indicates that the plankton cycle between
limitation by non-nutrient factors (light) in win- ter and N during summer. Phosphorus limitation never is observed according to Fig. 3B. The win- ter light-limiting conditions most likely are due to abiotic particles in the water column. Routine water quality data collected on the lake indicate that both total suspended solids (TSS) and non- volatile suspended solids (NVSS) are 2-3 fold higher during winter months (South Florida Wa- ter Management District, unpublished data).
Inferences Regarding Spatial Variation in Lake Okeechobee
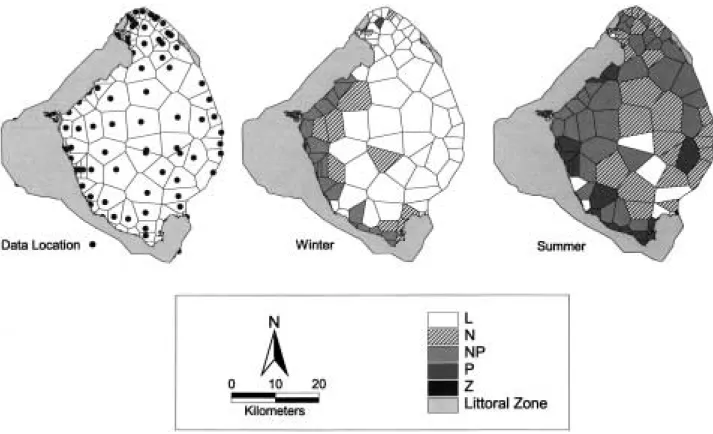
TSI differences also have been used to map the spatial variation in the factors that may limit phytoplankton growth in the lake (Havens et al., 1995). This was done using results from a five- year 80-station survey (Phlips et al., 1995), TSI differences, and geographic information systems (GIS) methods. The f irst step in this process was to use GIS to divide the pelagic region of the lake into Thiessan polygons (Fig. 4). Then for each region data were evaluated for winter (December -March) and summer (June-September) condi- tions, according to the following rules.
Where TSI (TP)<TSI (CHL), P is limiting;
TSI (TN)<TSI (CHL), N is limiting;
TSI (TP) and TSI (TN)<TSI (CHL), P and N are co-limiting; and
TSI (TP) and TSI (TN)>TSI (CHL), neither P nor N are limiting.
In the last case, light is limiting where TSI (CHL)<TSI (SD), and zooplankton grazing is limiting where TSI (CHL)>TSI (SD).
The limiting factors were averaged by season over the f ive years of the analysis and the results we are mapped onto the Thiessan polygons. Du- ring winter, the results (Fig. 4) indicate a large pelagic region where the limiting factor is light, and a narrow band along the western interface between pelagic and littoral zones where the lim- iting factor is N or N
+P. During summer, nutri- ent limitation is more wide-spread. In the cen- tral pelagic region, N limitation predominates, but there is a large peripheral area of N
+P co- limitation, and some areas along the south and west shoreline where there is evidence of P limi- tation. The f inding of P limitation represents one result that does not agree with nutrient-addi- tion bioassays, and I have concluded (Havens et al., 1995) that in this case the TSI approach may
Fig. 3. Seasonal trajectories of TSI differences based on the data presented in Fig. 2, with data points la- belled by month and arrows connecting consecut- ive monthly means. A. TSI differences with CHL vs. TP on the y-axis. B. TSI differences with CHL vs. TN on the y-axis.
be biased. The actual limiting condition appears to be N
+P co-limitation. High levels of organic N in the south and west regions may cause N limitation of algal growth to occur at higher TN : TP ratios than is commonly observed in temper- ate lakes (Walker and Havens 1995). Neverthe- less, the information provided here indicates regions of the lake (south and west) that are most strongly nutrient-limited and therefore most likely to respond to management actions that reduce external nutrient loads.
TSI Results in an Ecosystem Context
The TSI results provide considerable insight into the processes influencing the planktonic
community in Lake Okeechobee. Because this ecosystem has been intensively studied and mod- eled in the last decade (e.g., Aumen and Wetzel, 1995), it is possible to provide a mechanistic ex- planation for the results presented here. First it is important to recognize that in this subtropical lake, three physical features largely control the seasonal and spatial variation in ecosystem dy- namics-water depth, wind fetch, and sediment type. The pelagic region is very shallow, with a mean depth of <4 m, but its surface area is large, at over 1,400 km
2. The long wind fetch (up to 40 km) over the lake and shallow depth allow energy from wind-driven waves to frequently reach the lake bottom (Sheng, 1993). Unconsoli-
Fig. 4. Spatial distribution of limiting factors in Lake Okeechobee based on TSI differences, an 80 station monitoring network, and GIS methods. The left-hand panel shows the location of sampling sites and the grid of Thiessan polygons used to sub-divide the lake surface for mapping purposes. The center panel shows the average (5-yr) classification of limiting factors in winter, and the right-hand panel shows limiting conditions in summer.
dated mud sediments (Olila and Reddy, 1993) underlie much of the central pelagic region, and when this material is entrained into the water column it creates high turbidity. Phytoplankton is mixed throughout the water column, and spends a large percentage of its time in the apho- tic zone. As a result, light limited production has been observed in the central region of the lake (Phlips et al., 1997). The low light conditions also favor certain species of cyanobacteria (Lyngbya and Oscillatoria) that are adapted to this envi- ronment (Havens et al., 1998). The mud sedi- ments are very rich in total and dissolved P (Olila and Reddy, 1993), and as a result, sedi- ment-water interactions also serve to maintain P-replete conditions at mid-lake, even during periods when external inputs are low. Because south Florida experiences strong seasonality in wind velocities (Fig. 3B), light limiting condit- ions, inferred here from negative TSI (CHL)-TSI (SD) and TSI (CHL)-TSI (nutrient) differences, occur primarily in the winter (Figs. 4 and 5). Wi- nd resuspension also explains the high winter values of TSI (TP).
Some areas of Lake Okeechobee have sedi- ments comprised of sand (in the west) and peat (in the south). These near-shore areas, which also have shallower water (2~3 m), are removed from the central mud-bottomed zone to the ex- tent that they are not so heavily inf luenced by wind. Even under complete mixing, phytoplank- ton experience conditions that allow net growth.
Therefore, the western and southern near-shore regions of the lake often display nutrient limita- tion (Aldridge et al., 1995; Phlips et al., 1997), as indicated here by the positive TSI differences (Figs. 4 and 5).
Multi-Lake Comparisons and other Useful Applications
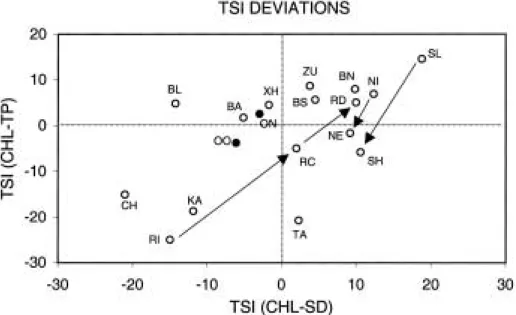
TSI differences also can be used to compare con- ditions among lakes. When selected lakes from around the world are plotted on a two-dimen- sional TSI deviation graph (Fig. 5), their posi- tions agree quite well with results of more direct measurements. Only a few of the lakes will be discussed here, as examples. In the lower left quadrant of the graph, where light-limited plankton and a strong influence of abiotic seston are indicated, are Lakes Chapala (Mexico) and Kalksee (Germany). Lake Chapala (CH) is well- known for its high concentrations of inorganic P
(>500 µ g/L), high total dissolved solids (>380 µ g/
L) and low transparency (Secchi depths 0.2 to 0.5 m). Phytoplankton in the lake have been report- ed (Limon and Lind, 1990) to be strongly light- limited and despite the high concentrations of P, the annual mean concentration of CHL is just 5 µ g L
-1. Similarly, Weithoff and Behrendt (1995) describe Lake Kalksee (KA) as a system with
“very low phytoplankton content at a high phos- phorus level.” In this case the authors conclude that N limitation is responsible for the low amount of CHL per unit of TP, and support this with results from nutrient-addition bioassays.
Although not shown here, a TSI plot with TSI (CHL)-TSI (TN) places this lake in the upper left quadrat of the graph (the CHL vs. TN deviation is
+4.1), just as expected for a N-limited lake.
Another well-known N-limited lake, Lake Tahoe (TA) also occurs in the lower region of the TSI deviation graph, however in this case (a very deep oligotrophic lake), light attenuation by phyto- plankton is indicated. In contrast, a small olig- otrophic lake (Lake Balsom, BL) in the Adiron- dack Mountain region of the USA ref lects the strongly P-limited conditions that typify many high elevation lakes that have been acidified by precipitation (Havens and Carlson, 1998).
Another interesting case is Lake Rockwell, an elongated reservoir in Ohio, USA. As document- ed by Carlson (1991), this lake undergoes a dra- matic change in its trophic state and TSI differ- ences from the upstream to downstream direc- tion. Where water enters from the major tribu- tary inf low, turbidity is high and algal biomass is low. The inf low end of the lake (RI) is located in the lower left quadrant of Fig. 5, indicating a considerable amount of abiotic seston and light- limited conditions. As water moves to mid-lake (RM) and then to the dam (RD), there is a pro- gressive transition towards P-limited conditions and large algae (f ilamentous cyanobacteria) dom- inance. This spatial pattern is typical of reser- voir ecosystems, which often have distinct “river- ine,” “transitional,” and “lacustrine” zones (Lind et al., 1993), and it is nicely illustrated using TSI differences.
Lakes that have been dramatically modif ied by
management actions (e.g., f ish removal, dredg-
ing, drawdown) also display signif icant trajecto-
ries in TSI space, further conf irming the utility
of this approach for illustrating complex respons-
es with simple, low cost information. Two exam-
ples are provided (Fig. 5). In Lake Sobygaard (Denmark), there was a transition from a turbid state with low zooplankton grazing (SL) in the late 1970s to a less turbid state with large Daph- nia and higher grazing (SH) in the late 1980s (Jeppesen et al., 1998). A pronounced change in the value of TSI (CHL)-TSI (TP) is evidenced here, consistent with transition of the lake into a region where zooplankton grazing exerts greater control over phytoplankton biomass. The same trajectory, although not as pronounced, is obser- ved for Lake Norrviken (Sweden), studied by Ahlgren (1978). In this lake there was a pro- nounced decline of CHL in 1970, even though TP was not substantially different than in the previ- ous year. The authors attributed the change to increased zooplankton grazing, noting that the phytoplankton community shifted in the previ- ous year from inedible cyanobacteria to edible diatoms, chlorophytes, and cryptophytes. It also was noted, however, that unusual spring f loods resulted in lower TN : TP ratios, and this may have resulted in N-limited conditions. In other words, it is not possible to conclusively identify
what factor, other than P, may have become more limiting to phytoplankton production in this lake.
If data had been available regarding TN, it may have been possible to identify the limiting factor using TSI differences.
In closing it is important to note that the strong TSI differences described here for Lake Okeecho- bee and other lakes indicate that serious pro- blems could arise if just one index value, in par- ticular TSI (SD), was used. In the USA many regions have “citizen monitoring programs” that enable scientists and managers to obtain infor- mation from thousands of lakes by having per- sons living on the lake shore take simple mea- surements.
In some cases the only data collected are Sec- chi transparencies. As Carlson (1991) states,
“trophic classif ications based on transparency should be considered as suspect until corroborat- Red by chlorophyll measurements.” Thus by over-simplifying a study program, one could draw incorrect inferences about a lake. However, a relatively low-cost yet complete program that measures just TP, TN, CHL and SD has been
Fig. 5. Trophic state index (TSI) differences for a number of international lakes, and trajectories in time (arrows) for a subset of the lake systems. CH = L. Chapala (Mexico), RI = L. Rockwell inlet (USA), RC = L. Rockwell middle, RD = Lake Rockwell dam, KA = L. Kalksee (Germany), OO = L. Okeechobee offshore, ON = L. Okeechobee near-shore, BL
= L. Balsom L. (USA), BA = L. Balaton (Hungary), XH = L. Xi Hu (P.R. China), ZU = Zurichsee (Switzerland), BS = Biwako south basin (Japan), BN = Biwako north basin, TA = L. Tahoe (USA), NI = L. Norriviken with inedible algae (Sweden), LE = L. Norriviken with edible algae, SL = L. Sobygaard with low grazing, SH = L. Sobygaard with high grazing. The axes labels are as identif ied in Fig. 1. Sources for data from Lakes Chapala, Rockwell, Kalksee, Okeechobee, Balsom, Norriviken and Sobygaard are in the text; for other lakes, information was obtained from the World Lakes Database of the International Lake Environment Committee (www.ilec.or.jp).
shown here to yield a wealth of information not only about standards of water qualzity, but also about the structure and function of the pelagic system.
ACKNOWLEDGMENTS
The author is grateful to Mark Brady, for car- rying out the GIS analysis and producing the maps in Fig. 4, and to Alan Steinman, R. Thomas James, Soon-Jin Hwang, Garth Redfield, and an anonymous reviewer for constructive comments on a draft version of this manuscript.
ABSTRACT
This paper describes a simple method that uses differences among Carlson’s (1977) trophic state index (TSI) values based on total phosphorus (TP), chlorophyll a (CHL) and Secchi depth (SD) to draw inferences regarding the factors that are limiting to phytoplankton growth and the compo- sition of lake seston. Examples are provided re- garding seasonal and spatial patterns in a large subtropical lake (Lake Okeechobee, Florida, USA) and inter- and intra-lake variations from a mul- tilake data set developed from published stud- ies. Once an investigator has collected routine water quality data and established TSI values based on TP, CHL, and SD, a number of infer- ences can be made.
Additional information can be provided where it also is possible to calculate a TSI based on total nitrogen (TN). Where TSI (CHL)<<TSI (TP), some factor other than P is inferred to limit algal growth. If one also finds that TSI (CHL)< <TSI (SD), this is evidence that seston is dominated by very small (abiotic) particles, and that light may be limiting. In contrast, if TSI (CHL)< <TSI (TP) but TSI (CHL)> >TSI (SD), light attenuating par- ticles are large (large f ilaments or colonies of algae), and the phytoplankton may be limited by zooplankton grazing. Other limiting conditions are inferred by different relationships between the TSI values. Results of this study indicate that the analysis is quite robust, and that it gen- erally gives good agreement with conclusions based on more direct methods (e.g., nutrient- addition bioassays, zooplankton size data, zoo- plankton removal experiments). The TSI ap- proach, when validated periodically with these more costly and time-intensive methods, pro-
vides an effective, low cost method for tracking long-term changes in pelagic structure and func- tion with potential value in monitoring lake ecol- ogy and responses to management.
REFERENCES
Ahlgren, G. 1978. Response of phytoplankton and primary production to reduced nutrient loading in Lake Norrviken. Verhandungen, Internationale Vereinigung fur Theoretische und Angewandte Limnologie 20: 840-845.
Aldridge, F.J., E.J. Phlips and C.L. Schelske. 1995.
The use of nutrient enrichment bioassays to test for spatial and temporal distribution of limiting factors affecting phytoplankton dynamics in Lake Okeechobee, Florida. Archiv fur Hydrobiologie, Ergebnisse der Limnologie 45: 177-190.
Aumen, N.G. and R.G. Wetzel. 1995. Ecological stud- ies on the littoral and pelagic systems of Lake Okeechobee, Florida (USA). Archiv fur Hydrobio- logie, Ergebnisse der Limnologie, Vol. 45, 356 pp.
Carlson, R.E. 1977. A trophic state index for lakes.
Limnology and Oceanography 22: 361-369.
Carlson, R.E. 1991. Expanding the trophic state con- cept to identify non-nutrient limited lakes and reservoirs. Enhancing the State’s Lake Manage- ment Programs 1991: 59-71.
Edmondson, W.T. 1980. Secchi disk and chlorophyll.
Limnology and Oceanography 25: 378-379.
Havens, K.E. 1994. Seasonal and spatial variation in nutrient limitation in a shallow subtropical lake (Lake Okeechobee, Florida) as evidenced by troph- ic state index differences. Archiv fur Hydrobiolo- gie 131: 39-53.
Havens, K.E. 1995a. Particulate light attenuation in a large subtropical lake. Canadian Journal of Fisheries and Aquatic Sciences 52: 1803-1811.
Havens, K.E. 1995b. Secondary nitrogen limitation in a subtropical lake impacted by non-point source agricultural pollution. Environmental Pollution 89: 241-246.
Havens, K.E., M. Brady and R.T. James. 1995. Spa- tial patterns of phytoplankton limiting factors in a subtropical lake undergoing cultural eutroph- ication. Proceedings of the 6th International Con- ference on the Conservation and Management of Lakes. International Lake Environment Commit- tee, pp. 709-712.
Havens, K.E. and R.E. Carlson. 1998. Functional complementarity in plankton communities along a gradient of acid stress. Environmental Pollution 101: 427-436.
Havens, K.E., T.L. East and J.R. Beaver. 1996. Ex- perimental studies of zooplankton-phytoplank- ton-nutrient interactions in a large subtropical lake (Lake Okeechobee, Florida, USA). Fresh- water Biology 36: 579-597.
Havens, K.E., E.J. Phlips, M.F. Cichra and B-L. Li.
1998. Light availability as a possible regulator of cyanobacteria species composition in a shallow subtropical lake. Freshwater Biology 39: 547-556.
Havens, K.E., H.J. Carrick, E.F. Lowe and M.F.
Coveney. 1999. Contrasting relationships between nutrients, chlorophyll a and Secchi transparency in two shallow eutrophic lakes: Lakes Okeechobee and Apopka (Florida, USA). Lake and Reservoir Management 15: 298-309.
Havens, K.E., K.A. Work and T.L. East. 2000. Rela- tive eff iciencies of carbon transfer from bacteria and algae to zooplankton in a subtropical lake.
Journal of Plankton Research 22, in press.
Hosper, H. 1997. Clearing lakes: an ecosystem ap- proach to the restoration and management of shal- low lakes in the Netherlands. Ministry of Trans- port, Public Works and Water Management, Lely- stad, the Netherlands.
James, R.T., V.H. Smith and B.L. Jones. 1995. Histo- rical trends in the Lake Okeechobee ecosystem III. water quality. Archiv fur Hydrobiologie, Mono- graphische Beitrage 107: 49-69.
Jeppesen, E., M. Sondergaard, J.P. Jensen, E. Mor- tensen, A-M Hansen and T. Jorgensen. 1998.
Cascading trophic interactions from fish to bacte- ria and nutrients after reduced sewage loading:
and 18-year study of a shallow hypereutrophic lake. Ecosystems 1: 250-267.
Kratzer, C.R. and P.L. Brezonik, 1981. A Carlson- type trophic state index for nitrogen in Florida lakes. Water Resources Bulletin 17: 713-715.
Limon, J.G.M. and O.T. Lind. 1990. The manage- ment of Lake Chapala (Mexico): considerations after significant changes in the water regime.
Lake and Reservoir Management 6: 61-70.
Lind, O.T., T.T. Terrell and B.L. Kimmel. 1993. Pro- blems in reservoir trophic state classification and implications for reservoir management. In: Stra- skraba, M., J.G. Tundisi and Duncan, A. (eds.),
Comparative Reservoir Limnology and Water Qu- ality Management. Kluwer Academic Publishers, the Netherlands, pp. 57-67.
Maceina, M.J. and D.M. Soballe. 1990. Wind-related limnological variation in Lake Okeechobee, Flori- da. Lake and Reservoir Management 6: 93-100.
Olila, O.G. and K.R. Reddy. 1993. Phosphorus sorp- tion characteristics of sediments in shallow eu- trophic lakes of Florida. Archiv fur Hydrobiologie 129: 45-65.
Osgood, R.A. 1982. Discussion: a Carlson-type tro- phic state index for Nitrogen in Florida lakes. Wa- ter Resources Bulletin 18: 343.
Phlips, E.J., F.J. Aldridge and P. Hansen. 1995. Pat- terns of water chemistry, physical and biological parameters in a shallow subtropical lake (Lake Okeechobee, Florida, USA). Archiv fur Hydrobio- logie, Ergebnisse der Limnologie 45: 117-135.
Phlips, E.J., M. Cichra, K.E. Havens, C. Hanlon, S.
Badylak, B. Rueter, M. Randall and P. Hansen.
1997. Relationships between phytoplankton dyna- mics and the availability of light and nutrients in a shallow subtropical lake. Journal of Plankton Research 19: 319-342.
Sheng, Y.P. 1993. Lake Okeechobee phosphorus dy- namics study : hydrodynamics and sediment dyna- mics-a f ield modeling study. Technical Report, South Florida Water Management District, West Palm Beach, FL 33416, USA.
Walker, W.W. and K.E. Havens. 1995. Relating algal blooms to total phosphorus concentrations in Lake Okeechobee. Lake and Reservoir Management 10:
77-83.
Weithoff, G. and H. Behrendt. 1995. Phosphorus rich but clear lakes-a try to explain this phenomenon.
Proceedings of the 6thInternational Conference on the Conservation and Management of Lakes. In- ternational Lake Environment Committee, pp. 743 -746.