J. Miner. Soc. Korea, 31(4), 235-248 (December, 2018) http://dx.doi.org/10.9727/jmsk.2018.31.4.235
제올라이트 Y (Si/Al = 1.56) 골격 내의 Ca
2+
과 Cs+
이온의 자리 경쟁 및 그들의 결정학적 연구Site Competition of Ca
2+and Cs
+Ions in the Framework of Zeolite Y (Si/Al = 1.56) and Their Crystallographic Studies
김후식(Hu Sik Kim)1⋅박종삼(Jong Sam Park)2⋅임우택(Woo Taik Lim)1,*
1안동대학교 응용화학과
(Department of Applied Chemistry, Andong National University)
2대구보건대학교 방사선과
(Department of Radiologic Technology, Daegu Health College)
요약 : 본 연구는 제올라이트 Y (Si/Al = 1.56)에서 Cs+ 이온 교환에 Ca2+ 이온의 경쟁 양이온 효과를
연구하기 위해 수행되었다. 완전히 탈수되고 부분적으로 Cs+ 이온으로 교환된 3개의 제올라이트 Y
(Si/Al = 1.56)의 단결정은 혼합이온교환 용액을 사용하여 흐름법으로 제조되었으며, 전체 농도가 0.05 M인 이온교환용액의 CsNO3 : Ca(NO3)2 몰비는 1 : 1 (Crystal 1), 1 : 100 (Crystal 2) 및 1 : 250 (Crystal 3)이다. 이온교환된 단결정을 723 K에서 2일 동안 1 × 10⁻⁴ Pa로 진공 탈수시켰으며, 결정구조는 100(1) K에서 입방공간군 Fd3̅m을 사용하여 단결정 싱크트론 X선 회절법으로 해석하고 구조를 정밀화하였다.
Crystal 1, 2 및 3의 단위세포당 화학식은 |Cs21Ca27|[Si117Al75O384]-FAU, |Cs2Ca36.5|[Si117Al75O384]-FAU 및
|Cs1Ca37|[Si117Al75O384]-FAU이다. 3개의 결정 모두에서, Ca2+ 이온은 D6Rs 내의 site I을 우선적으로 점 유하고 있으며 나머지는 site I’, II’ 및 II를 점유하고 있다. 한편 주어진 이온교환용액의 초기 Cs+ 이온 의 농도에 따라 Cs+ 이온의 분포에 중요한 차이가 관찰되었다. Crystal 1에서는 Cs+ 이온이 site II’, II, III와 III’에 위치하고 있으며, Crystal 2에서는 site II, IIIa, IIIb에 위치하고 있다. Crystal 3에서는 Cs+ 이온은 site IIIa 및 IIIb에만 위치하고 있다. 초기 Ca2+ 이온의 농도가 증가하고 Cs+ 이온의 농도가 감소 에 따라 Cs+ 이온의 교환정도는 28.0에서 2.7과 1.3 %로 급격히 감소하였다.
주요어 : 세슘, 경쟁 양이온, 제올라이트, 이온교환, 방사성 폐기물
ABSTRACT : The present work was performed in order to study the effect of competing cation of Ca
2+ion on ion exchange of Cs+ on zeolite Y (Si/Al = 1.56). Three single-crystals of fully dehydrated and partially Cs+-exchanged zeolites Y (Si/Al = 1.56) were prepared by the flow method using mixed ion-exchange solutions. The CsNO3 : Ca(NO3)2 molar ratios of the ion exchange solution were 1 : 1 (crystal 1), 1 : 100 (crystal 2), and 1 : 250 (crystal 3) with a total concentration of 0.05 M. The single-crystals were then vacuum dehydrated at 723 K and 1 × 10⁻⁴ Pa for 2 days. The structures of the crystals were determined by single-crystal synchrotron X-ray diffraction technique in the cubic space group
Fd3̅m, at 100(1) K. The unit-cell formulas of crystals 1, 2, and 3 were |Cs
21Ca27|[Si117Al75O384]-FAU,|Cs2Ca36.5|[Si117Al75O384]-FAU, and |Cs1Ca37|[Si117Al75O384]-FAU, respectively. In all three crystals, the Ca2+
ions preferred to occupy site I in the D6Rs, with the remainder occupying sites I’, II’, and II. On the
*Corresponding author: +82-54-820-5454, E-mail: [email protected]
Introduction
Among various radioactive nuclides, 137Cs is the main fission product typically present in nuclear wastes that are routinely or accidentally released (Nilchi et al., 2012; Abusafa and Yucel, 2002; Willms et al., 2004; Parab and Sudersanan, 2010). It is considered as one of the most dangerous radiotoxic element to human health due to relatively long half-life, high transfer- ability, high solubility, and easy assimilation in living organisms (Ma et al., 2011; Wu et al., 2009; Nilchi et al., 2012; Valsala et al., 2009;
Kotvitskyy et al., 2005; Shakir et al., 2007; Datta
et al., 2014).
When accidentally released without treatment to the ground and sea, it may has an adverse impact on the human health and environment (Datta et al., 2014). Therefore, cesium-containing radioactive wastes must be adequately treated prior to discharge into environment.
Various methods such as ion exchange/sorption, chemical precipitation, evaporation, reverse osmosis, filtration, and solvent extraction for removing cesium from radioactive waste solutions have been widely studied by many researchers (EI-Kamash, 2008; EI-Naggar et al., 2008). Among them, ion exchange using inorganic ion-exchangers is one of the most promising technologies for the removal of Cs+ ions from radioactive wastewater (Abusafa and Yucel, 2002; Smiciklas et al., 2007). Especially, zeolites are proven ion- exchange materials, where the balancing cations can be easily exchanged with other cations in the solution (Ostroski et al., 2012). Various natural and synthetic zeolites have been studied and successfully used in the removal of Cs+ ions due
to its high exchange capacity, attractive selectivity, simplicity, efficiency, and excellent stability to radiation (Song et al., 1997; Mimura and Kanno, 1984; Howery and Thomas, 1965;
Ryu et al., 2004; Bae, 2007; Seo et al., 2009).
They have exhibited good selective removal ability for Cs+ ions in aqueous solution (Song et al., 1997; Mimura and Kanno, 1984; Howery and Thomas, 1965; Ryu et al., 2004; Bae, 2007).
However, when the Cs+ ions are present with competing cations in mixed cation-exchange solution, these materials generally exhibited the relatively poor removal of Cs+ ions because the concentrations of the Cs+ ions are usually incomparably lower than those of the co-existing competing cations (Na+, Ca2+, Mg2+, K+, and others) (Abusafa and Yucel, 2002; Datta et al., 2014; Seo et al., 2009).
In the case of accidentally released radioactive wastewater to the ground and sea, it typically contains many different metal ions as a mixture (Datta et al., 2014). These ions have the potential to affect the effectiveness of the removal of Cs+ ions in treating the radioactive wastewater and that is based on their competition for exchange sites on and in the zeolite. Therefore, it is important to investigate the impact of competing cations on the removal of Cs+ ions from aqueous solution. Thus, in order to the development of highly effective ion-exchange materials for the removal of Cs+ ions from radioactive wastewater, the more information about the selectivity, distribution, and coordination geometry of Cs+ ion in zeolites under co-existing competing cations is required. Accordingly, many researchers have been explored. However, despite the great efforts in ion exchange with zeolite, there is very little other hand, the significant differences in the fractional distribution of Cs+ ions are observed depending on the intial Cs+ concentrations in given ion exchange solution. In Crystal 1, Cs+ ion are located at sites II’, II, III, and III’, and in crystal 2, at sites II, IIIa, and IIIb. In crystal 3, Cs+ ions are only located at sites IIIa and IIIb. The degree of Cs+ ion exchange decreased sharply from 28.0 to 2.7 to 1.3 % as the initial Ca2+ concentration increases and the Cs+ content decreases.
Key words : Cesium, competing cation, zeolite, ion exchange, radioactive wastes
literature published on the influence of competing cations on the removal of Cs+ ions from mixed solutions by zeolites (Jang et al., 1996; Kim et
al., 2014; Kim et al., 2017a; Lee et al., 2017).
The present work was performed in order to determine the effect of competing cation of Ca2+
ion on ion exchange of Cs+ on zeolite Y (Si/Al = 1.56). The Cs+-ion exchange with zeolite Y (Si/Al = 1.56) was achieved from aqueous solution using a mixed cation-exchange solution of Cs+ and Ca2+. The aim of present work is to investigate the Cs+ ion exchange tendency and site selectivity with the change in the con- centration of Cs+ and Ca2+ in ion exchange solution by single-crystal synchrotron X-ray diffraction techniques.
Materials and Method
Ion exchange and dehydration
Large single crystals of zeolite Y (FAU), stoichiometry Na75Si117Al75O384 per unit cell, were previously synthesized by Lim et al. (Lim et al., 2010). Each single crystal, with colorless octahedra and a cross-section of ~0.20 mm, was lodged in its own fine Pyrex capillary. To prepare Cs+- and Ca2+-exchanged zeolite Y (Cs, Ca-Y), ion exchange was accomplished by the flow method using an exchange aqueous solution of CsNO3 : Ca(NO3)2 in the mole ratios of 1 : 1, 1 : 100, and 1 : 250 at a total concentration of 0.05 M. The capillary containing the clear colorless crystal was attached to a vacuum system.
To prepare the fully dehydrated crystal, its temperature was cautiously raised at a heating rate of 20 K/h to 673 K under dynamic vacuum and kept at this temperature under a dynamic vacuum of 1 × 10⁻⁴ Pa for 2 days. While these conditions were maintained, the hot adjacent downstream lengths of the vacuum system, including a sequential 17-cm U-tube of zeolite 5A beads fully activated in situ, were allowed to cool to ambient temperature to prevent the
movement of water molecules from more distant parts of the vacuum system to the crystal. Still under vacuum in its capillary, the crystal was then allowed to cool to room temperature and then sealed in its capillary using a torch. The color of all the single crystals was pale yellow.
Additional details are given in Table 1.
X-ray diffraction
The diffraction data for three single crystals measured at 100(1) K with synchrotron radiation (λ = 0.70000 Å) on a ADSC Quantum 210 detector at 2D SMC with a silicon (111) double crystal monochromator (DCM) at the Pohang Accelerator Laboratory, Korea. The ADSC Q210 ADX program was used for data collection (detector distance is 63 mm, omega scan: ∆ω = 5 °, exposure time is 1 sec per frame) and the HKL 3000 sm (Ver. 703r) was used for cell refinement, reduction, and absorption correction (Minor et al., 2006). The space group Fd3̅m, the standard for zeolite Y, was determined by the program XPREP (Bruker-AXS, 2001). A summary of the experimental and crystallographic data is presented in Table 1.
Structure Determination
Full-matrix least-squares refinement (SHELXL97) (Sheldrick, 1997) was performed on F2 using all data for each crystal. The refinement was initiated with the atomic parameters of the framework atoms [(Si, Al), O(1), O(2), O(3), and O(4)] in dehydrated |Tl75|[Si117Al75O384]-FAU (Lim
et al., 2010). Each initial refinement used
anisotropic thermal parameters and converged to the high error indices. The further steps of structure determination and refinement as new atomic positions were found on successive difference Fourier electron density functions are presented in Table 2. Considering the cationic charge per unit cell, the occupancies of Cs+ and Ca2+ ions for all positions were fixed at the values shown in Table 2.Fixed weights were used initially; the final weighting function with their refined parameters is given in Table 1. The atomic scattering factors for the Cs+, Ca2+, O- and (Si, Al)1.80+ were used (Doyle and Turner, 1968; Ibers and Hamilton, 1974a). The function describing (Si, Al)1.80+ is the weighted mean of the Si4+, Si0, Al3+, and Al0 functions, assuming half formal charges. All scattering factors were modified to account for anomalous dispersion (Cromer, 1965; Ibers and Hamilton, 1974b). All the shifts in the final cycles of refinements were less than 0.1 % of their corresponding estimated standard deviations (esds). The final error indices and structural parameters are listed in Tables 1 and 3, respectively. The selected interatomic distances
and angles are listed in Table 4.
Results
General Information of Framework of Zeolite Y
The framework structures of zeolite Y (FAU) are characterized by the double 6-ring (D6R, hexagonal prism), the sodalite cavity (a cubooc- tahedron), and the supercage (Fig. 1). Each unit cell has 8 supercages, 8 sodalite cavities, 16 D6Rs, 16 12-rings, and 32 single 6-rings (S6Rs) (Loewenstein, 1954).
The exchangeable cations, which balance the negative charge of the zeolite Y framework,
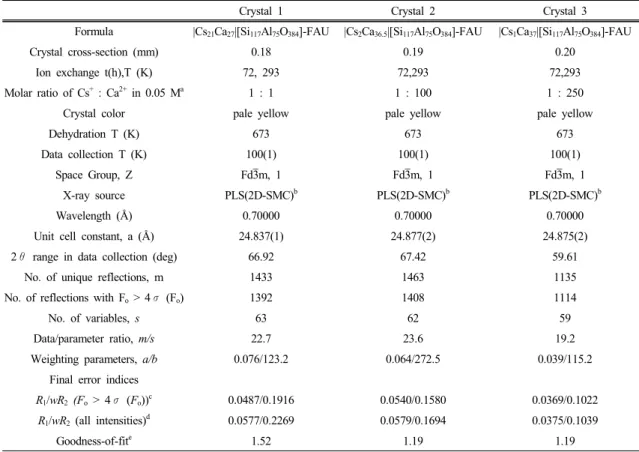
Crystal 1 Crystal 2 Crystal 3
Formula |Cs21Ca27|[Si117Al75O384]-FAU |Cs2Ca36.5|[Si117Al75O384]-FAU |Cs1Ca37|[Si117Al75O384]-FAU
Crystal cross-section (mm) 0.18 0.19 0.20
Ion exchange t(h),T (K) 72, 293 72,293 72,293
Molar ratio of Cs+ : Ca2+ in 0.05 Ma 1 : 1 1 : 100 1 : 250
Crystal color pale yellow pale yellow pale yellow
Dehydration T (K) 673 673 673
Data collection T (K) 100(1) 100(1) 100(1)
Space Group, Z Fd3̅m, 1 Fd3̅m, 1 Fd3̅m, 1
X-ray source PLS(2D-SMC)b PLS(2D-SMC)b PLS(2D-SMC)b
Wavelength (Å) 0.70000 0.70000 0.70000
Unit cell constant, a (Å) 24.837(1) 24.877(2) 24.875(2)
2θ range in data collection (deg) 66.92 67.42 59.61
No. of unique reflections, m 1433 1463 1135
No. of reflections with Fo > 4σ (Fo) 1392 1408 1114
No. of variables, s 63 62 59
Data/parameter ratio, m/s 22.7 23.6 19.2
Weighting parameters, a/b 0.076/123.2 0.064/272.5 0.039/115.2
Final error indices
R1/wR2 (Fo > 4σ (Fo))c 0.0487/0.1916 0.0540/0.1580 0.0369/0.1022 R1/wR2 (all intensities)d 0.0577/0.2269 0.0579/0.1694 0.0375/0.1039
Goodness-of-fite 1.52 1.19 1.19
aCsNO3 : Ca(NO3)2mol ratio in the exchange solution. bBeamline 2D-SMC at the Pohang Light Source, Korea. cR1 = ∑|Fo-|Fc||/∑Fo and R2 = [∑w(Fo2
-Fc2
)2/∑w(Fo2
)2]1/2; R1 and wR2 are calculated using only the reflections for which Fo > 4σ (Fo). dR1 and wR2 are calculated using all unique reflections measured. eGoodness-of-fit = (∑w(Fo2
-Fc2
)2/(m-s))1/2, where m and s are the number of unique reflections and variables, respectively.
Table 1. Summary of experimental and crystallographic data
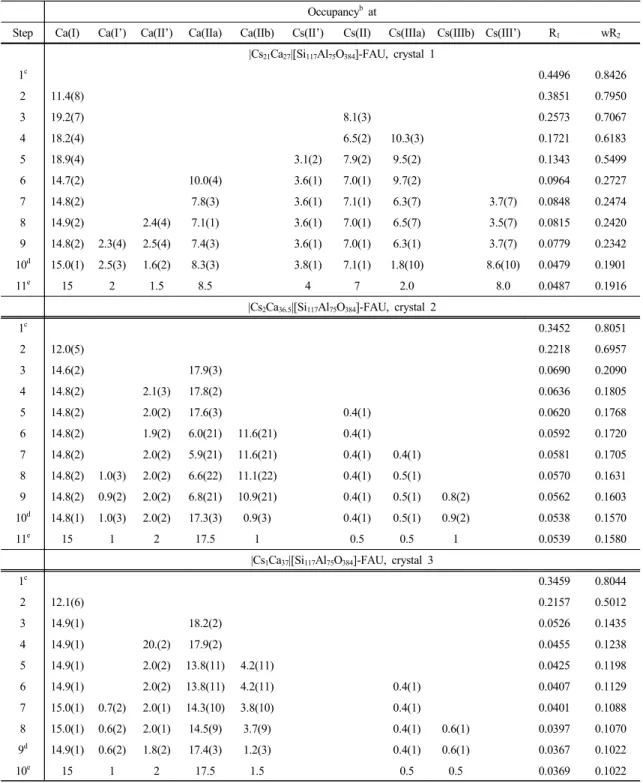
Occupancyb at
Step Ca(I) Ca(I’) Ca(II’) Ca(IIa) Ca(IIb) Cs(II’) Cs(II) Cs(IIIa) Cs(IIIb) Cs(III’) R1 wR2
|Cs21Ca27|[Si117Al75O384]-FAU, crystal 1
1c 0.4496 0.8426
2 11.4(8) 0.3851 0.7950
3 19.2(7) 8.1(3) 0.2573 0.7067
4 18.2(4) 6.5(2) 10.3(3) 0.1721 0.6183
5 18.9(4) 3.1(2) 7.9(2) 9.5(2) 0.1343 0.5499
6 14.7(2) 10.0(4) 3.6(1) 7.0(1) 9.7(2) 0.0964 0.2727
7 14.8(2) 7.8(3) 3.6(1) 7.1(1) 6.3(7) 3.7(7) 0.0848 0.2474
8 14.9(2) 2.4(4) 7.1(1) 3.6(1) 7.0(1) 6.5(7) 3.5(7) 0.0815 0.2420
9 14.8(2) 2.3(4) 2.5(4) 7.4(3) 3.6(1) 7.0(1) 6.3(1) 3.7(7) 0.0779 0.2342
10d 15.0(1) 2.5(3) 1.6(2) 8.3(3) 3.8(1) 7.1(1) 1.8(10) 8.6(10) 0.0479 0.1901
11e 15 2 1.5 8.5 4 7 2.0 8.0 0.0487 0.1916
|Cs2Ca36.5|[Si117Al75O384]-FAU, crystal 2
1c 0.3452 0.8051
2 12.0(5) 0.2218 0.6957
3 14.6(2) 17.9(3) 0.0690 0.2090
4 14.8(2) 2.1(3) 17.8(2) 0.0636 0.1805
5 14.8(2) 2.0(2) 17.6(3) 0.4(1) 0.0620 0.1768
6 14.8(2) 1.9(2) 6.0(21) 11.6(21) 0.4(1) 0.0592 0.1720
7 14.8(2) 2.0(2) 5.9(21) 11.6(21) 0.4(1) 0.4(1) 0.0581 0.1705
8 14.8(2) 1.0(3) 2.0(2) 6.6(22) 11.1(22) 0.4(1) 0.5(1) 0.0570 0.1631
9 14.8(2) 0.9(2) 2.0(2) 6.8(21) 10.9(21) 0.4(1) 0.5(1) 0.8(2) 0.0562 0.1603 10d 14.8(1) 1.0(3) 2.0(2) 17.3(3) 0.9(3) 0.4(1) 0.5(1) 0.9(2) 0.0538 0.1570
11e 15 1 2 17.5 1 0.5 0.5 1 0.0539 0.1580
|Cs1Ca37|[Si117Al75O384]-FAU, crystal 3
1c 0.3459 0.8044
2 12.1(6) 0.2157 0.5012
3 14.9(1) 18.2(2) 0.0526 0.1435
4 14.9(1) 20.(2) 17.9(2) 0.0455 0.1238
5 14.9(1) 2.0(2) 13.8(11) 4.2(11) 0.0425 0.1198
6 14.9(1) 2.0(2) 13.8(11) 4.2(11) 0.4(1) 0.0407 0.1129
7 15.0(1) 0.7(2) 2.0(1) 14.3(10) 3.8(10) 0.4(1) 0.0401 0.1088
8 15.0(1) 0.6(2) 2.0(1) 14.5(9) 3.7(9) 0.4(1) 0.6(1) 0.0397 0.1070
9d 14.9(1) 0.6(2) 1.8(2) 17.4(3) 1.2(3) 0.4(1) 0.6(1) 0.0367 0.1022
10e 15 1 2 17.5 1.5 0.5 0.5 0.0369 0.1022
aIsotropic temperature factors were used for all Cs+ , and Ca2+ positions except for the last step. bThe occupancy is given as the number of Cs+ and Ca2+ ions per unit cell. The numbers in parentheses are their esds in the units of the least significant digit given for the corresponding parameter.
cOnly the atoms of zeolite framework were included in the initial structure model. dCs+ and Ca2+ ions were refined anisotropically, except Ca(IIb) in crystals 2 and 3. eThese integral values were used only in the presentation of this work, to facilitate reasonability.
Table 2. Steps of structure refinement
ausually occupy some or all of the sites shown with Roman numerals in Fig. 1. The maximum occupancies at the cation sites I, I’, II’, II, and III are 16, 32, 32, 32, and 48, respectively. Site III’ in zeolite Y is a 192-fold position. Further description is available in previous works (Breck, 1974; Bekkum et al., 2001).
Structure of |Cs21Ca27|[Si117Al75O384]-FAU, crystal 1 About 21 Cs+ and 27 Ca2+ ions per unit cell occupy the eight different sites in the structure of
|Cs21Ca27|[Si117Al75O384]-FAU (crystal 1)(Table 3).
In this structure, ca. 28 % of the total cations are exchanged by Cs+ ions.
Site I: Of the 27 Ca2+ ions within the unit cell, the 15 Ca2+ ions at Ca(I) , nearly completely fill
the 16-fold site I positions (at the centers of the D6Rs, Fig. 2 (a)). Each Ca2+ ion at Ca(I) coordinates to the six O(3) framework oxygen atoms of the D6R at a distance of 2.417(2) Å, which is somewhat longer than the sum of the conventional ionic radii of Ca2+ and O2-, 0.99 +
Fig. 1. Stylized drawing of the framework structure
of zeolite Y. Near the center of the each line segment is an oxygen atom. The nonequivalent oxygen atoms are indicated by the numbers 1 to 4.
There is no evidence in this work of any ordering of the silicon and aluminum atoms among the tetrahedral positions, although it is expected that Loewenstein’s rule (Loewenstein, 1954) would be obeyed. Extraframework cation positions are labeled with Roman numerals.
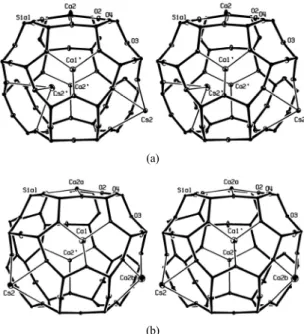
(a)
(b)
(c)
Fig. 2. Stereoviews of the four and two possible ways that cations occupy D6Rs in crystals 1, 2, and 3, respectively. For crystal 1, Ca
2+ions are occupied as shown in (a) and (b). For crystals 2 and 3, Ca
2+ions are occupied as shown in (a) and (c). The zeolite Y framework is drawn with heavy bonds. The coordination of the exchangeable cations to oxygens of the zeolite framework is indicated by light bonds.
Ellipsoids of 25 % probability are shown.
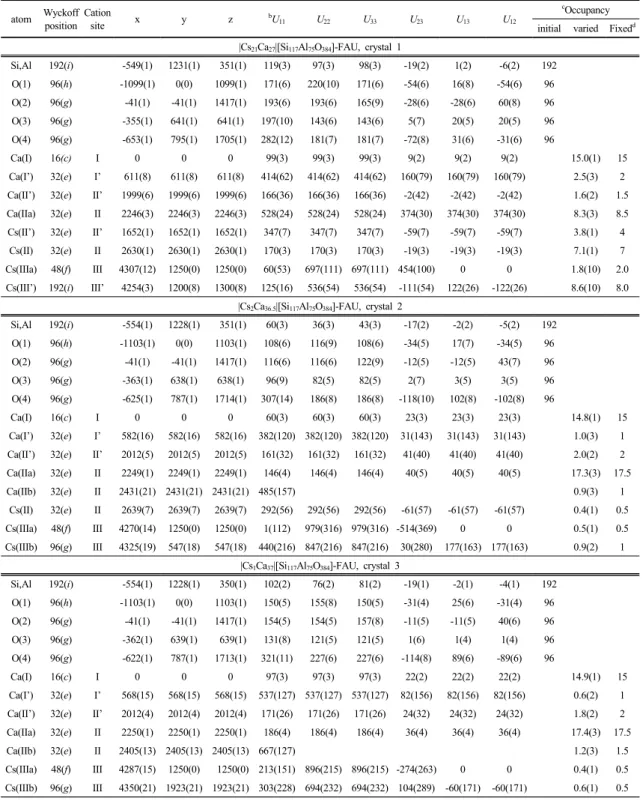
atom Wyckoff position
Cation
site x y z bU11 U22 U33 U23 U13 U12
cOccupancy initial varied Fixedd
|Cs21Ca27|[Si117Al75O384]-FAU, crystal 1
Si,Al 192(i) -549(1) 1231(1) 351(1) 119(3) 97(3) 98(3) -19(2) 1(2) -6(2) 192
O(1) 96(h) -1099(1) 0(0) 1099(1) 171(6) 220(10) 171(6) -54(6) 16(8) -54(6) 96
O(2) 96(g) -41(1) -41(1) 1417(1) 193(6) 193(6) 165(9) -28(6) -28(6) 60(8) 96
O(3) 96(g) -355(1) 641(1) 641(1) 197(10) 143(6) 143(6) 5(7) 20(5) 20(5) 96
O(4) 96(g) -653(1) 795(1) 1705(1) 282(12) 181(7) 181(7) -72(8) 31(6) -31(6) 96
Ca(I) 16(c) I 0 0 0 99(3) 99(3) 99(3) 9(2) 9(2) 9(2) 15.0(1) 15
Ca(I’) 32(e) I’ 611(8) 611(8) 611(8) 414(62) 414(62) 414(62) 160(79) 160(79) 160(79) 2.5(3) 2 Ca(II’) 32(e) II’ 1999(6) 1999(6) 1999(6) 166(36) 166(36) 166(36) -2(42) -2(42) -2(42) 1.6(2) 1.5 Ca(IIa) 32(e) II 2246(3) 2246(3) 2246(3) 528(24) 528(24) 528(24) 374(30) 374(30) 374(30) 8.3(3) 8.5 Cs(II’) 32(e) II’ 1652(1) 1652(1) 1652(1) 347(7) 347(7) 347(7) -59(7) -59(7) -59(7) 3.8(1) 4
Cs(II) 32(e) II 2630(1) 2630(1) 2630(1) 170(3) 170(3) 170(3) -19(3) -19(3) -19(3) 7.1(1) 7
Cs(IIIa) 48(f) III 4307(12) 1250(0) 1250(0) 60(53) 697(111) 697(111) 454(100) 0 0 1.8(10) 2.0 Cs(III’) 192(i) III’ 4254(3) 1200(8) 1300(8) 125(16) 536(54) 536(54) -111(54) 122(26) -122(26) 8.6(10) 8.0
|Cs2Ca36.5|[Si117Al75O384]-FAU, crystal 2
Si,Al 192(i) -554(1) 1228(1) 351(1) 60(3) 36(3) 43(3) -17(2) -2(2) -5(2) 192
O(1) 96(h) -1103(1) 0(0) 1103(1) 108(6) 116(9) 108(6) -34(5) 17(7) -34(5) 96
O(2) 96(g) -41(1) -41(1) 1417(1) 116(6) 116(6) 122(9) -12(5) -12(5) 43(7) 96
O(3) 96(g) -363(1) 638(1) 638(1) 96(9) 82(5) 82(5) 2(7) 3(5) 3(5) 96
O(4) 96(g) -625(1) 787(1) 1714(1) 307(14) 186(8) 186(8) -118(10) 102(8) -102(8) 96
Ca(I) 16(c) I 0 0 0 60(3) 60(3) 60(3) 23(3) 23(3) 23(3) 14.8(1) 15
Ca(I’) 32(e) I’ 582(16) 582(16) 582(16) 382(120) 382(120) 382(120) 31(143) 31(143) 31(143) 1.0(3) 1 Ca(II’) 32(e) II’ 2012(5) 2012(5) 2012(5) 161(32) 161(32) 161(32) 41(40) 41(40) 41(40) 2.0(2) 2 Ca(IIa) 32(e) II 2249(1) 2249(1) 2249(1) 146(4) 146(4) 146(4) 40(5) 40(5) 40(5) 17.3(3) 17.5
Ca(IIb) 32(e) II 2431(21) 2431(21) 2431(21) 485(157) 0.9(3) 1
Cs(II) 32(e) II 2639(7) 2639(7) 2639(7) 292(56) 292(56) 292(56) -61(57) -61(57) -61(57) 0.4(1) 0.5 Cs(IIIa) 48(f) III 4270(14) 1250(0) 1250(0) 1(112) 979(316) 979(316) -514(369) 0 0 0.5(1) 0.5 Cs(IIIb) 96(g) III 4325(19) 547(18) 547(18) 440(216) 847(216) 847(216) 30(280) 177(163) 177(163) 0.9(2) 1
|Cs1Ca37|[Si117Al75O384]-FAU, crystal 3
Si,Al 192(i) -554(1) 1228(1) 350(1) 102(2) 76(2) 81(2) -19(1) -2(1) -4(1) 192
O(1) 96(h) -1103(1) 0(0) 1103(1) 150(5) 155(8) 150(5) -31(4) 25(6) -31(4) 96
O(2) 96(g) -41(1) -41(1) 1417(1) 154(5) 154(5) 157(8) -11(5) -11(5) 40(6) 96
O(3) 96(g) -362(1) 639(1) 639(1) 131(8) 121(5) 121(5) 1(6) 1(4) 1(4) 96
O(4) 96(g) -622(1) 787(1) 1713(1) 321(11) 227(6) 227(6) -114(8) 89(6) -89(6) 96
Ca(I) 16(c) I 0 0 0 97(3) 97(3) 97(3) 22(2) 22(2) 22(2) 14.9(1) 15
Ca(I’) 32(e) I’ 568(15) 568(15) 568(15) 537(127) 537(127) 537(127) 82(156) 82(156) 82(156) 0.6(2) 1 Ca(II’) 32(e) II’ 2012(4) 2012(4) 2012(4) 171(26) 171(26) 171(26) 24(32) 24(32) 24(32) 1.8(2) 2 Ca(IIa) 32(e) II 2250(1) 2250(1) 2250(1) 186(4) 186(4) 186(4) 36(4) 36(4) 36(4) 17.4(3) 17.5
Ca(IIb) 32(e) II 2405(13) 2405(13) 2405(13) 667(127) 1.2(3) 1.5
Cs(IIIa) 48(f) III 4287(15) 1250(0) 1250(0) 213(151) 896(215) 896(215) -274(263) 0 0 0.4(1) 0.5 Cs(IIIb) 96(g) III 4350(21) 1923(21) 1923(21) 303(228) 694(232) 694(232) 104(289) -60(171) -60(171) 0.6(1) 0.5
aPositional parameters × 104 and thermal parameters × 104 are given. Numbers in parentheses are the estimated standard deviations in the units of the least significant figure given for the corresponding parameter. bThe anisotropic temperature factor is exp[-2π2a-2(U11h2 + U22k2 + U33l2 + 2U23kl + 2U13hl + 2U12hk)]. cOccupancy factors are given as the number of atoms or ions per unit cell. dThese integral values were used only in the presentation of this work, to facilitate reasonability.
Table 3. Positional, thermal, and occupancy parameters
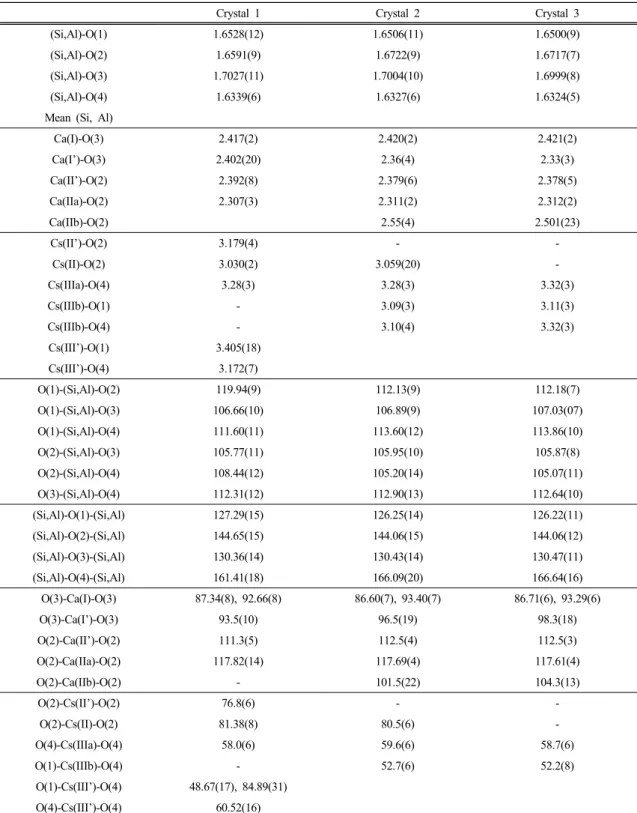
aCrystal 1 Crystal 2 Crystal 3
(Si,Al)-O(1) 1.6528(12) 1.6506(11) 1.6500(9)
(Si,Al)-O(2) 1.6591(9) 1.6722(9) 1.6717(7)
(Si,Al)-O(3) 1.7027(11) 1.7004(10) 1.6999(8)
(Si,Al)-O(4) 1.6339(6) 1.6327(6) 1.6324(5)
Mean (Si, Al)
Ca(I)-O(3) 2.417(2) 2.420(2) 2.421(2)
Ca(I’)-O(3) 2.402(20) 2.36(4) 2.33(3)
Ca(II’)-O(2) 2.392(8) 2.379(6) 2.378(5)
Ca(IIa)-O(2) 2.307(3) 2.311(2) 2.312(2)
Ca(IIb)-O(2) 2.55(4) 2.501(23)
Cs(II’)-O(2) 3.179(4) - -
Cs(II)-O(2) 3.030(2) 3.059(20) -
Cs(IIIa)-O(4) 3.28(3) 3.28(3) 3.32(3)
Cs(IIIb)-O(1) - 3.09(3) 3.11(3)
Cs(IIIb)-O(4) - 3.10(4) 3.32(3)
Cs(III’)-O(1) 3.405(18)
Cs(III’)-O(4) 3.172(7)
O(1)-(Si,Al)-O(2) 119.94(9) 112.13(9) 112.18(7)
O(1)-(Si,Al)-O(3) 106.66(10) 106.89(9) 107.03(07)
O(1)-(Si,Al)-O(4) 111.60(11) 113.60(12) 113.86(10)
O(2)-(Si,Al)-O(3) 105.77(11) 105.95(10) 105.87(8)
O(2)-(Si,Al)-O(4) 108.44(12) 105.20(14) 105.07(11)
O(3)-(Si,Al)-O(4) 112.31(12) 112.90(13) 112.64(10)
(Si,Al)-O(1)-(Si,Al) 127.29(15) 126.25(14) 126.22(11)
(Si,Al)-O(2)-(Si,Al) 144.65(15) 144.06(15) 144.06(12)
(Si,Al)-O(3)-(Si,Al) 130.36(14) 130.43(14) 130.47(11)
(Si,Al)-O(4)-(Si,Al) 161.41(18) 166.09(20) 166.64(16)
O(3)-Ca(I)-O(3) 87.34(8), 92.66(8) 86.60(7), 93.40(7) 86.71(6), 93.29(6)
O(3)-Ca(I’)-O(3) 93.5(10) 96.5(19) 98.3(18)
O(2)-Ca(II’)-O(2) 111.3(5) 112.5(4) 112.5(3)
O(2)-Ca(IIa)-O(2) 117.82(14) 117.69(4) 117.61(4)
O(2)-Ca(IIb)-O(2) - 101.5(22) 104.3(13)
O(2)-Cs(II’)-O(2) 76.8(6) - -
O(2)-Cs(II)-O(2) 81.38(8) 80.5(6) -
O(4)-Cs(IIIa)-O(4) 58.0(6) 59.6(6) 58.7(6)
O(1)-Cs(IIIb)-O(4) - 52.7(6) 52.2(8)
O(1)-Cs(III’)-O(4) 48.67(17), 84.89(31) O(4)-Cs(III’)-O(4) 60.52(16)
aThe numbers in parentheses are the estimated standard deviations in the units of the least significant digit given for the corresponding parameter.
Table 4. Selected interatomic distances (Å) and angles (deg)
a1.32 = 2.31 Å (Robert, 1989/1990), indicating a reasonably good fit, and this was observed before in the structures of |Ca23K29|[Si117Al75O384]-FAU,
|Ca18.5K38|[Si117Al75O384]-FAU, |Ca27Rb21|[Si117Al75O384]- FAU, and |Ca18Rb39|[Si117Al75O384]-FAU(Kim et
al., 2017b). The O(3)-Ca(I)-O(3) bond angles are
87.34(8) ° and 92.66(8) ° (see Table 4), indicating a nearly perfect octahedral arrangement. No Cs+ ions are found at site I.Site I’: At the one site-I’ position, 2 Ca2+ ions occupy the Ca(I’) position (opposite D6Rs in the sodalite cavity, Fig. 2(b)). Each Ca2+ ion at Ca(I’) is located inside the sodalite cavity of ca.
1.29 Å, from its three O(3) planes (Table 5). The Ca2+ ion at site I’ is coordinated by three framework O(3) oxygens at the distance of 2.402(20) Å.
Site II’: 1.5 Ca2+ and 4 Cs+ ions per unit cell at Ca(II’) and Cs(II’), respectively, are found at site II’ (opposite S6Rs in the sodalite cavity). Each of these ions corrdinates to three framework O(2) oxygens at 2.392(8) and 3.179(4) Å, respectively, which are in close agreement with the sum of the ionic radii of Ca2+ and O2-, 2.31 Å and Cs+ and O2-, 2.99 Å (Robert, 1989/1990). While Ca(II’) extends ca. 0.72 Å into the sodalite unit from its three O(2) plane, Cs(II’) extends ca. 2.21 Å, which is ca. 1.49 Å much further than Ca(II’) due to the ion size (Fig. 3(a) and Table 5).
Because, Ca2+ ion is smaller than Cs+ ion, it must
pull the oxygen atoms of the 6-rings that it occupies in toward the 6-ring centers. Corres- pondingly, the O(2)-Ca(II’)-O(2) and O(2)-Cs(II)-O(2) angles are 111.3(5) ° and 76.8(6) °, respectively (Table 4).
Site II: 8.5 Ca2+ and 7 Cs+ ions per unit cell are located at Ca(II) and Cs(II), respectively, (opposite S6Rs in the supercage). Each of these ions is
crystal 1 crystal 2 crystal 3
positions sites at O(3)a at O(2)b at O(3)a at O(2)b at O(3)a at O(2)b
Ca(I) I -1.46 - -1.48 - -1.48 -
Ca(I’) I’ 1.29 - 1.20 - 1.13 -
Ca(II’) II’ - -0.72 - -0.66 - -0.66
Cs(II’) II’ - -2.21 - - - -
Ca(IIa) II - 0.34 - 0.35 - 0.36
Ca(IIb) II - - - 1.14 - 1.02
Cs(II) II - 1.99 - 2.03 - -
aA positive displacement indicates that the cation lies in a sodalite cavity; a negative deviation indicates that the cation lies in a D6R (Ca(I) lies at the center of D6Rs). bA positive displacement indicates that the cation lies in a supercage; a negative displacement indicates that the cation lies in a sodalite cavity.
Table 5. Displacement of atoms (Å) from 6-ring plane
(a)
(b)
Fig. 3. Stereoviews of representive sodalite units in
crystals 1, 2, and 3; (a) crystal 1, (b) crystals 2 and
3. See the caption to Fig. 2 for other details.
located inside the supercage, ca. 0.34 and 1.99 Å, respectively, from the plane of their three O(2) framework oxygen atoms (Fig. 3(a) and Table 5).
Cs+ ions are exclusively found at site II deep into supercage because of the large ion size corre- sponding to the O(2)-Cs(II)-O(2) and O(2)-Ca(II)-O(2) angles of 81.38(8) ° and 117.82(14) °, respectively (Table 4). The Cs(II)-O(2) and Ca(II)-O(2) bond lengths are 3.030(2) and 2.307(3) Å, respectively, and are almost identical with the sum of the ionic radii, 2.99 and 2.31 Å, respectively (Robert, 1989/1990).
Site III: The 2 Cs+ ions are located at site III in the supercage on a 2-fold axis opposite a
4-ring between two 12-rings (Fig. 4(a). These Cs+ ions bind to two oxygens atoms, O(4), at 3.28(3) Å. These positions and distances are similar to those previously reported(Kim et al., 2014; Kim
et al., 2017a). The O(4)-Cs(IIIa)-O(4) angle,
58.0(6) °, is quite small (Table 5).Site III’: The remaining 8 Cs+ ions are located at site III’ near the triple 4-rings in the supercage (Fig. 4(a)). These Cs+ ions bind loosely to two O(4) oxygen atoms at 3.172(7) Å and two O(1) atom at 3.405(18) Å, which are much longer than the sum of the ionic radii of Cs+ and O2- (Table 4) (Robert, 1989/1990). However, this long distance was also seen in fully dehydrated Sr29Cs17-FAU (Kim et al., 2014).
Structure of |Cs2Ca36.5|[Si117Al75O384]-FAU, crystal 2 In this structure of |Cs2Ca36.5|[Si117Al75O384]-FAU (crystal 2), 2 Cs+ ions occupy three crystallo- graphic sites and 36.5 Ca2+ ions occupy five different sites. Unlike crystal 1, no Cs+ ions are found at site II’. In this structure, ca. 2.7 % of the total cations are exchanged with Cs+ ions.
Site I: 15 Ca2+ ions at Ca(I) are located at site I at the centers of the D6Rs (Fig. 2(a) and Table 3).
The octahedral Ca(I)-O(3) distance, 2.420(2) Å, is slightly longer than the sum of the conventional ionic radii of Ca2+ and O2-, 2.31 Å (Robert, 1989/1990), indicating a reasonably good fit.
Site I’: The one Ca2+ ion at Ca(I’) is located at site I’ opposite D6Rs in the sodalite (Fig. 2(c)).
Each Ca2+ ion at Ca(I’) is located inside the sodalite cavity ca. 1.20 Å from the plane of the three O(3) framework oxygens of the D6R, to which each atom is bonded (Table 5). The
Crystal no. Site I Site I’ Site II’ Site II Site III Site III’ %IEa
Ca2+ Ca2+ Ca2+ Cs+ Ca2+ Ca2+ Cs+ Cs+ Cs+ Cs+
1 15 2 1.5 4 8.5 - 7 2.0 - 8.0 28.0
2 15 1 2 - 17.5 1 0.5 0.5 1 - 2.7
3 15 1 2 - 17.5 1.5 - 0.5 0.5 - 1.3
aPercent ion exchange of Cs+ ion. Cs+ ions/M ×100, M is required to balance the negative charge of framework per unit cell, 75.
Table 6. Occupancy of Cs
+and Ca
2+ions per unit cell at their sites
(a)
(b)
Fig. 4. Stereoviews of representive supercages in
crystals 1, 2, and 3; (a) crystal 1, (b) crystals 2 and
3. See the caption to Fig. 2 for other details.
Ca(I’)-O(3) distance is 2.36(4) Å, slightly longer than the sum of the corresponding ionic radii, 2.31 Å.
Site II’: Unlike crystal 1, no Cs+ ions are found at site II’. Only 2 Ca2+ ions are found at site II’(opposite S6Rs in the sodalite cavity). The Ca(II’)-O(2) distance is 2.379(6) Å and is somewhat longer than the sum of the ionic radii, 2.31 Å, similar to that in crystal 1.
Site II: 17.5, 1 Ca2+ and 0.5 Cs+ ions at Ca(IIa), Ca(IIb), and Cs(II), respectively, are located at site II (Figs. 3(b) and 4(b)). Each of these ions lie inside the supercages, ca. 0.35, 1.14, and 2.03 Å, respectively, from the plane of their three O(2) framework oxygen atoms (Table 5). The Ca(IIa)-O(2), Ca(IIb)-O(2), and Cs(II)-O(2) dis- tances are 2.311(2), 2.55(4), and 3.059(20) Å, respectively. The bonding angles are 117.69(4) °, 101.5(22) °, and 80.5(6) °, respectively.
Site III : The 0.5 Cs+ ion at Cs(IIIa) is found at the 48-fold site III (see Fig. 4(b)). This Cs+ ion bind loosely to two O(4) oxygen atoms at 3.28(3) Å. This distance is much like that described for crystal 1. The remaining one Cs+ ion at site IIIb coordinated by framework oxygen atoms, two O(1) atoms at 3.09(3) Å and one O(4) atoms at 3.10(4) Å, which is slightly longer than the sum of ionic radii of Cs+ and O2- (see Fig. 4(b)). These positions and distances are similar to those previously reported(Kim et al., 2014).
Structure of |Cs1Ca37|[Si117Al75O384]-FAU, crystal 3 In the structure of |Cs1Ca37|[Si117Al75O384]-FAU (crystal 3), about one Cs+ ion per unit cell occupy sites IIIa and IIIb with the occupancies of 0.5 and 0.5, respectively. The 15, 1, 2, 17.5, and 1.5 Ca2+ ions at sites I, I’, II’, IIa, and IIb, respectively, are found per unit cell (Table 3).
Therefore, the extent of Cs+-ion exchange is
ca.1.3 %. In this structure, most Cs
+ and Ca2+positions are very similar to those in crystal 2.
The bonding distances of Cs(IIIa) and Cs(IIIb) to the framework oxygens at O(4) and O(1) of
3.32(3), 3.32(3), and 3.11(3) Å, respectively, and of Ca(I), Ca(I’), Ca(II’), Ca(IIa), and Ca(IIb) to O(3) and O(2) of 2.421(2), 2.33(3), 2.378(5), 2.312(2), and 2.501(23) Å, respectively, are almost the same as those in crystal 2 (Table 4).
Their locations shown in Figs. 2(a), 2(c), 3(b), and 4(b). Their geometry is reasonable, and is similar to that described in crystal 2.
Discussion
In this work, three single crystals were prepared identically, except the molar concentration ratio of Cs+ and Ca2+ in the given aqueous exchange solution in order to determine the effect of competing cation as Ca2+ on Cs+ ion-exchange by zeolite Y (Si/Al = 1.56). In all three crystals, all of the Na+ ions in zeolite Y were can readily be replaced by Cs+ and Ca2+ ions. However, significant differences in both the fractional distribution and total number of Cs+ and Ca2+
ions were observed as the initial Ca2+ concen- tration increase and the initial Cs+ concentration decrease in given ion exchange solution. In table 6, the occupancy of Cs+ and Ca2+ ion per unit cell is presented.
In all three crystals, Ca2+ ions nearly fill site I in the D6Rs, but Cs+ ions are not found at this site. It can be explained in terms of both the relative ionic size and charge of the Ca2+ and Cs+ ions. The smaller and more highly charged Ca2+
ions prefer site I in the D6Rs, because they can approach the framework oxygens more closely as seen in previous works (Jang et al., 1996; Kim et
al., 2017b). On the other hand, Cs
+ ion is apparently too large to occupy the center of hexagonal prism at site I, when they are competing with smaller cation like as Ca2+ ions.The remaining Ca2+ ions partially occupy sites I, II’, and II in three crystals. The smaller and more highly charged Ca2+ ions are located near the plane of single six ring (inside the sodalite cavity and supercage). In the present work, no Ca2+ ions are found at sites III or III’, which is clearly unfavorable for small Ca2+ ion. On the
other hand, the larger Cs+ ions, which are less able to balance the anionic charge of the zeolite framework because of their size, lie farther to framework oxygens than smaller Ca2+ ions. In crystal 1, the Cs+ ions occupy sites II’, II, III and III’. Unlike crystal 1, in crystal 2, Cs+ ions occupy sites II, IIIa and IIIb, in crystal 3, Cs+ ions are only found at sites IIIa and IIIb because of the relatively vely low level of Cs+ exchange.
The number of Cs+ ions at Cs(II’), Cs(II), Cs(IIIa), Cs(IIIb), and Cs(III’) decrease readily from 4.0 to 0, from 7.0 to 0, from 2.0 to 0.5, from 1.0 to 0.5 and from 8.0 to 0, respectively, as the intial Ca2+ concentration increase and the initial Cs+ concentration decrease. Some of the Cs+ ions at sites II’ and II are exchanged by Ca2+
ion by increasing Ca2+ ion exchange. However, despite the increasing Ca2+ ion exchange, Ca2+
ions are not found at sites III or III’ in crystals 2 and 3, which are cleary unfavorable for small Ca2+ ion in this site. Accordingly, the smaller and more highly charged Ca2+ ions are energetically preferred and filed at near the plane of single six ring (inside the sodalite cavity and supercage) as the intial Ca2+ concentration increase and the initial Cs+ concentration decrease. On the other hand, the larger Cs+ ions are located the least suitable cation site in sites III or III’.
Consequently, the degree of Cs+ ion exchange decreased sharply from 28.0 % to 2.7 % to 1.3
%, as the molar concentration ratio of Cs+ : Ca2+
increased from 1 : 1 (crystal 1) to 1 : 100 (crystal 2) to 1 : 250 (crystal 3). In particular, crystal 2 and 3 show very low Cs+ ion exchange rates, because the concentration of the Cs+ ions are incomparably lower than that of the Ca2+
ions.
This result shows that the Cs+ ion exchange is strongly affected by the change in the initial concentration of the Cs+ and Ca2+ ions in a given exchange solution. When the molar concentration of Cs+ in the given exchange solution is extremely low, it becomes more prominent.
Summary
Three single-crystals of fully dehydrated Cs+- and Ca2+-exchanged zeolites Y (Si/Al = 1.56) were prepared from an aqueous solution using a mixed ion-exchange solution and their structures were determined by single-crystal X-ray synchrotron diffraction techniques. The smaller and more highly charged Ca2+ ions are energetically preferred and the first to occupy site I, with the remainder occupying sites I’, II’, and II in the three crystals. They approach the framework oxygens more closely. On the other hand, the larger Cs+ ions finish filling in sodalite cavity with some occupancy at site II’ and finish filling site II, with the remainder going to the least suitable cation site in sites IIIa, IIIb, and III’.
With increasing the molar concentration of Ca2+
in the given exchange solution, the occupancies of the Cs+ ions at sites II’, II, IIIa, IIIb, and III’
decreased, whereas the occupancies of the Ca2+
ions at sites II’, and II increased. Consequently, the presence of Ca2+ ions in the solutions of Cs+ ion is reducing the degree of Cs+ ion exchange due to simultaneous exchange of positively charged cations, which occupy available exchange sites in the zeolite’s structure. With increasing the initial Ca2+ concentration, the degree of Cs+ ion exchange decreased sharply from 28.0 % to 2.7 % to 1.3 %, as the molar concentration ratio of Cs+ : Ca2+ increased from 1 : 1 (crystal 1) to 1 : 100 (crystal 2) to 1 : 250 (crystal 3).
Acknowledgements
The authors wish to thank the staff at Beamline 2D SMC at the Pohang Light Source, Korea, for assistance during data collection. This research was supported by Basic Science Research Program through the National Research Foundation of Korea (NRF) Funded by the Ministry of Education (NRF-2017R1D1A1B03029558).
REFERENCES
Abusafa, A. and Yucel, H. (2002) Removal of 137Cs
from aqueous solutions using different cationic forms of a natural zeolite: clinoptilolite. Separation and Purification Technology, 28, 103-116.
Bae, M.N. (2007) Crystal structure of fully dehydrated partially Cs+-exchanged zeolite X, Cs52Na40-X(The highest Cs+-exchanged level achieved by conven- tional method and confirmation of special site se- lectivity). Bulletin of the Korean Chemical Society, 28, 251-256.
Bekkum, H.V., Flanigen, E.M., Jacobs, P.A., and Jansen, J.C. (2001) Introductions to Zeolite Science and Practice. Elsevier. 44p.
Breck, D.W. (1974) Zeolite Molecular Sieves. John Wiley & Sons, New York, 93-103.
Bruker-AXS (ver. 6.12), XPREP, Program for the Automatic Space Group Determination. Bruker AXS Inc., Madison, WI (2001).
Cromer, D.T. (1965) Anomalous dispersion corrections computed from self-consistent field relativistic Dirac-Slater wave functions. Acta Crystallographica, 18, 17-23.
Datta, S.J., Moon, W.K., Choi, D.Y., Hwang, I.C., and Yoon, K.B. (2014) A Novel Vanadosilicate with Hexadeca-Coordinated Cs+ Ions as a Highly Effective Cs+ Remover. Angewandte Chemie International Edition, 53, 1-7.
Doyle, P.A. and Turner, P.S. (1968) Relativistic Hartree-Fock X-ray and electron scattering factors.
Acta Crystallographica A, 24, 390-397.
El-Kamash, A.M. (2008) Evaluation of zeolite A for the sorptive removal of Cs+ and Sr2+ ions from aqueous solutions using batch and fixed bed column operations. Journal of Hazardous Materials, 151, 432-445.
El-Naggar, M.R., El-Kamash, A.M., EI-Dessouky, M.I., and Ghonaim, A.K. (2008) Two-step method for preparation of NaA-X zeolite blend from fly ash for removal of cesium ions. Journal of Hazardous Materials, 154, 963-972.
Howery, D.G. and Thomas, H.C. (1965) Ion exchange on the mineral clinoptilolite. The Journal of Physical Chemistry, 69, 531-537.
Ibers, J.A. and Hamilton, W.C. (1974a), International Tables for X-ray Crystallography, Kynoch Press, Birmingham, IV, 71-98.
Ibers, J.A. and Hamilton, W.C. (1974b), International Tables for X-ray Crystallography, Kynoch Press, Birmingham, IV, 148-150.
Jang, S.B., Song, S.H., and Kim, Y. (1996) Crystal
structures of full dehydrated Ca29 Cs22Si100Al92O384
and Ca29Cs34Si100Al92O384. Journal of the Korean Chemical Society, 40, 427-435.
Kim, H.S., Choi, S.J., and Lim, W.T. (2017a) Behavior of cesium cation in zeolite Y (FAU, Si/Al = 1.56) and their single-crystal structures, |Cs75-xNax| [Si117Al75O384]-FAU (x = 35 and 54). Journal of Porous Materials, 24, 55-64.
Kim, H.S, Chung, D.Y., and Lim, W.T. (2014) Single-crystal structures of Sr2+ and Cs+-exchanged zeolites X and Y, |Sr40Cs12|[Si100Al92O384]-FAU and
|Sr29Cs17|[Si117Al75O384]-FAU. Journal of Chemical Crystallography, 44, 269-278.
Kim, H.S., Kim, Y.H., and Lim, W.T. (2017b) Crystallographic studies on the site selectivity of Ca2+, K+, and Rb+ ions within zeolite Y (Si/Al = 1.56). Journal of Porous Materials, 24, 959-972.
Kotvitskyy, A.G., Maltseva, T.V., and Belyakov, V.N.
(2005) Selective removal of Cs+ ions by means of electro-deionisation. Separation Purification Technology, 41, 329-334.
Lee, H.Y., Kim, H.S., Jeong, H., Park, M., Chung, D., Lee, K., Lee, E., and Lim, W.T. (2017) Selective removal of radioactive cesium from nuclear waste by zeolites: On the origin of cesium selectivity re- vealed by systematic crystallographic studies. The Journal of Physical Chemistry C, 121, 10594-10608.
Lim, W.T., Seo, S.M., Wang, L., Lu, G.Q., Heo, N.H., and Seff, K. (2010) Single-crystal structures of highly NH4+-exchanged, fully deaminated, and fully Tl+-exchanged zeolite Y (FAU, Si/Al = 1.56), all fully dehydrated. Microporous and Mesoporous Materials, 129, 11-21.
Loewenstein, W. (1954) The distribution of a alumi- nium in the tetrahedral of silicates and aluminates.
American Mineralogist, 39, 92-96.
Ma, B., Oh, S., Shin, W.S., and Choi, S. (2011) Removal of Co2+, Sr2+ and Cs+ from aqueous sol- ution by phosphate-modified montmorillonite (PMM).
Desalination, 276, 336-346.
Mimura, H. and Kanno, T. (1984) Distribution and fix- ation of cesium and strontium in zeolite A and chabazite. Journal of Nuclear Science and Technology, 23, 284-291.
Minor, W., Cymborowski, M., Otwinowski, Z., and Chruszcz, M. (2006) HKL-3000: the integration of data reduction and structure solution-from diffraction images to an initial model in minutes. Acta