An Empirical Study on the Impact of Trade Facilitation on China's Export Trade*
Xinyu ZHAO
1, Fan ZHANG
2Received: May 28, 2020. Revised: July 06, 2020. Accepted: September 05, 2020
Abstract
Purpose: Many studies show that promoting the development of trade facilitation has a positive role in stimulating the country's foreign trade. Therefore, it is of great practical significance to study the development level of trade facilitation for China's export trade.
Research design, data and methodology:This study analyzes the growth trend of China's export trade volume in 2009-2019, the characteristics of China's export trade market according to the top 18 major exporting countries in 2017-2018, the structure of export commodities to understand China's economic development level, and compares the total amount of trade exported to all uses this to measure the level of trade development. On this basis, this paper selects the 2011-2018 Trade Facilitation Index and C continents to study the development trend. Based on the theory of trade facilitation, this paper constructs the Trade Facilitation Index, and hina's export trade volume for empirical research. Results: The results show that trade facilitation has a positive and significant impact on the development of China's export trade. Conclusions: Based on the analysis of the actual situations and empirical results, this paper puts forward some suggestions to promote the level of trade facilitation in order to promote the development of import and export trade.
Keywords: Trade facilitation, Trade Facilitation Index, Export Trade, China's Trade Exports JEL Classification Code : F12,F124
1. Introduction
12After the reform and opening up, China's export volume has been improved by leaps and bounds, but the growth of export trade scale is unstable. As one of the world trade developing countries, China's trade facilitation level is relatively backward. To change this situation is very important for the development of China's export trade. Many scholars have made researches on the relationship between
* Fund Project:Social science planning fund project of Shandong Province : Research on the transformation and upgrading of Shandong free trade zone to "free trade zone" under the background of digital trade.
1 First Author,Students, Shandong University of political science and law China, Email: [email protected]
2 Corresponding Author, Lecturer, Shandong University of political science and law, China, Email: [email protected]
© Copyright: The Author(s)
This is an Open Access article distributed under the terms of the Creative Commons Attribution Non-Commercial License (https://creativecommons.org/licenses/by-nc/4.0/) which permits unrestricted non-commercial use, distribution, and reproduction in any medium, provided the original work is properly cited.
trade facilitation and China's export trade. Most of them use the trade gravity model to analyze, take the calculated Trade Facilitation Index as the independent variable, select the relevant indicators of China's export trade as the dependent variable to analyze, and conclude that trade facilitation has a positive impact on China's export trade. Based on this, this paper uses the formula to calculate the Trade Facilitation Index, which is set as the independent variable x, and China's export trade volume as the dependent variable y Eviews7.2 Analyze relevant data from 2011 to 2018. In this paper, we first test the correlation between the sample observations and prove that there is a correlation between the independent Trade Facilitation Index and the dependent trade exports. The unit root test of sample data Trade Facilitation Index X and export trade volume y proves that the data is stable, and then a single regression model is established. Through OLS test, it is proved that there is a significant positive correlation between independent variables and dependent variables. Based on the data obtained from the empirical study, this paper provides suggestions on how to continue to develop export trade in
Print ISSN: 2233-4165 / Online ISSN 2233-5382JIDB website: http://www.jidb.or.kr
doi:http://dx.doi.org/10.13106/jidb.2020.vol11.no9.7
the context of trade facilitation. We can comprehensively improve China's trade facilitation level by strengthening infrastructure construction, improving customs clearance efficiency, improving institutional environment, and using information and communication technology, so as to comprehensively analyze and solve the problem of uneven growth ofChina's export trade.
2. Literature Review
2.1. Domestic Literature Review
On the basis of trade facilitation theory, Fang (2017) selected the top 36 countries or regions in 2014 with China's import and export trade volume as the research object, calculated various indicators using Wilson's method, estimated the development level of trade facilitation between China and the sample countries, and concluded that China's trade facilitation level compared with other developed countries has a large gap. Zhou (2007) obtained the research results by quantifying the level of trade facilitation. The better the economic development of a country, especially the higher the level of trade in a country, the higher the overall level of trade facilitation of the country.
Choi (2019) studies the impact of trade facilitation level on cross-border e-commerce market of China and South Korea based on the measured Trade Facilitation Index. Through SPSS software analysis, the four areas covered by trade facilitation have a positive impact on the cross-border e- commerce export market of China and South Korea. And through the questionnaire: consumers in cross-border e- commerce trade, consider the most is the level of infrastructure in trade facilitation, the least is the institutional environment. Song and Jia (2018) calculates the trade facilitation level of G20 countries, and analyzes the impact of the trade facilitation level of G20 countries on the export volume of China's domestic products and the types of export products by using the extended gravity model. The empirical results show that in addition to the GDP, population size, distance and market openness of G20 trading partners, the level of trade facilitation is also an important factor affecting China's export trade. The higher the level of trade facilitation of G20 countries, the greater the volume of Trade China exports to the country, and the more kinds of products China exports to the country. Wang (2015) proposed that it is more difficult to comprehensively promote the reform of trade facilitation due to the limitations of capital, technology and resources. In order to obtain the maximum benefits, we should first implement those aspects that have a great impact on trade flows and have obvious effects. The results also show that whether trade facilitation is taken as a whole or divided into different indicators, the
impact on export trade volume is positive.
Li (2015) analysis shows that: of all the factors listed in the model, the Trade Facilitation Index is the most effective factor in promoting China's export scale. Other factors, such as Trade Facilitation Index of trading partners, total economic volume, total population and so on, all play different roles in increasing China's export trade. Yang (2013) found that distance factor and average tariff level were negatively correlated with export trade. The distance between the two countries is the main obstacle to the bilateral trade between the two countries, because the farther the distance, the higher the cost of freight and time.
According to Zhu and LV (2015), transportation cost accounts for a large part of the cost of China's export products, so it is difficult to reflect the high added value of China's export commodities. So we need to get competitive advantage at low cost. From the perspective of export scale and commodity structure, Guo (2017) concluded that trade facilitation plays a greater role in improving the export of primary products and manufactured goods. In addition, the improvement of domestic trade facilitation can promote the export trade of manufactured goods more obviously, and the improvement of trade partner countries can promote the advantages of primary products more.
2.2. Literature Review of Foreign Countries
According to Fink, Mattoo and Neagu(2002), to promote trade growth more quickly, an important aspect is to reduce communication costs. At the beginning of the 21st century, only by improving the communication equipment and reducing the communication cost, can we accelerate the growth of trade. Since then, more and more scholars have taken communication cost into account when studying trade growth. Dollar (2014) conducted a field survey in several developing countries, and after investigating thousands of large and small companies, came to the conclusion that one of the important factors affecting the foreign market of commodity exports is the clearance time. And this factor also has a great influence on the speed and scale of foreign investment. According to analysis, the faster the customs clearance time is, the larger the foreign market of export trade will be, and the faster and larger the foreign capital will enter.
3. An analysis of the current situation of China's export trade
3.1. Current situation of China's export trade
Since the reform and opening up, China's foreign trade
environment has been improving. It has attracted many
traders to engage in import and export trade activities. At present, China has become the largest exporter in the world.
Both economic growth rate and trade growth rate remain at a high level.
Data source: National Bureau of Statistics
Figure 1: Growth scale of China's trade export (unit: 100 million yuan)
Figure 1 shows the overall trend of the proportion of China's total exports in total imports and exports from 2011 to 2019, and the trend of the growth rate of China's total import and export trade. From the information reflected in the figure above, in 2011, China's foreign trade exports accounted for 52.13% In 2019, the proportion reached 54.62% , showing a small increase. The scale of China's export trade in 2011 is one hundred and twenty-three thousand two hundred and forty point five six In 2019, the export scale will reach 17234.2 billion yuan, and the annual average growth rate will reach 39.84%. It shows that China's export trade is showing a good growth trend. In 2015, China's export volume experienced a fluctuating negative growth. From the perspective of the scale structure of China's import and export trade, the scale of China's foreign trade export has been slightly larger than its import scale, accounting for more than 50% of the total, which indicates that China's foreign trade development is steady and healthy.
It is worth noting that China's total trade in 2014-2016 shows signs of negative growth. But the export volume changes little, we can conclude that the trade surplus becomes larger. As China has entered the new normal of economy and foreign demand has decreased, it is urgent to improve the structure of foreign trade. Although China's total export trade is still on the rise as a whole, the instability
of export growth is prominent. One of the new ways to solve the current situation of China's trade is to promote trade facilitation in order to adapt to the continuous development of China's economy and trade level.
3.2. Analysis of China's export product structure
In fact, the enhancement of China's foreign trade s trength is not only reflected in the substantial growth o f total exports, but also in the profound transformation of China's overall trade structure. The commodity struct ure of foreign trade refers to the proportion of various products in foreign trade of a country or region in a c ertain period of time. To a certain extent, commodity st ructure can reflect the economic development level and export trade status of a country or region.
Data source: National Bureau of Statistics
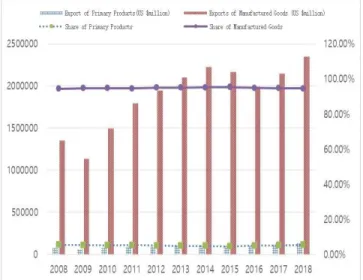
Figure 2: Export structure and share of China's products
As can be seen from Figure 2, China's export of primary
products and industrial manufactured products overall
maintained an upward trend from 2008 to 2018. From
seventy-seven thousand nine hundred and fifty-six point
nine three Million dollars and one million three hundred and
fifty-two thousand seven hundred and thirty-six point one
three Million dollars, up to one hundred and thirty-four
thousand nine hundred and ninety-two point eight three
Million dollars and two million three hundred and fifty-one
thousand six hundred and eighty-eight point six eight
Million dollars. The overall development trend is similar to
the total import and export volume, showing a downward
trend from 2015 to 2016, but it began to realize growth after
2017. It can be further seen that the share of primary
products from the beginning of 5.45% , drop as 5.43% , the
share of manufactured goods from 94.55% , up to 94.57%. It can be seen that the proportion of exports of primary products and manufactured products is relatively stable, with weak fluctuations. Industrial manufactured goods have been playing a leading role in export trade. This is closely related to China's new economic situation, industrial policy upgrading and adjustment. With the development of economy, China's industrial structure is constantly adjusted and improved to adapt to China's economic model. The improvement of industrial structure promotes economic development, thus forming a virtuous circle.
3.3 An analysis of China's export market
After analyzing the scale of China's export trade, the following is an analysis of China's export trade market.
This paper selects the top 18 countries with China's export trade volume in 2017-2018 to analyze China's current export trade market. The trade volume of China's exports to the above countries and regions accounts for the total trade volume of China in 2018 65.89% 。 Therefore, taking them as the research object, it is quite representative to analyze China's export trade market.
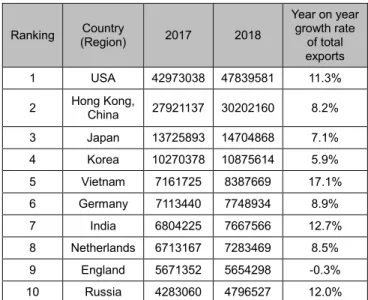
Table 1: Export trade between China and major trading countries (regions)
Data source: National Bureau of Statistics
It can be observed from table 1 that the top ten export trade countries and regions in China are mainly developed countries, and strong economic strength is one of the key elements for trade. Thanks to its close geographical position and similar cultural customs, Vietnam ranks fifth in China's export trade volume, thus becoming one of China's major exporters.
4. An analysis of the current situation of China's trade facilitation
4.1. Cost and benefit of trade facilitation 4.1.1. Cost of trade facilitation
Zhou (2012) stated that although promoting trade facilitation can promote the overall economic growth of the country, it is undeniable that trade facilitation will also bring corresponding costs.
First of all, the maintenance and construction of hardware facilities, the construction of roads to promote the reform of trade facilitation, the repair of ports, the improvement of customs clearance equipment, and the leasing of warehouses need to be funded. In the short term, before obtaining the benefits from trade facilitation, the corresponding capital investment is part of the cost of implementing trade facilitation reform. Second, reform the software facilities. In the process of promoting trade facilitation, it is inevitable to make changes to some rules and regulations. The resulting professional training, agency mobilization and integration, the improvement and perfection of the corresponding trade system, and the settlement of trade disputes due to the change of terms will all have direct or indirect costs. Finally, if some trade terms are improved, the tariff level will be reduced directly or indirectly after the corresponding trade formalities are reduced, the corresponding service fees will be reduced, and the tariff revenue will be reduced, thus weakening the contribution rate of tariff revenue to the financial revenue.
Although the Shanghai municipal government is committed to improving and promoting the application of e- commerce in foreign trade, there are still some problems.
First, cross-border logistics is inefficient but costly. The international logistics of Shanghai free trade zone has the defects of small scale, low specialization, low efficiency and high cost, which limits its development. Secondly, the construction of the platform still needs to be improved. The e-commerce platform built in Shanghai free trade zone is not only a trading platform, but also includes payment, customs clearance, commodity inspection, logistics, etc., which can simplify the procedures and facilitate the supervision of the government. Finally, there is a lack of compound professionals. To develop the application of e-commerce in international trade, the relevant personnel are required to not only master the theoretical knowledge of e-commerce and international trade terms, but also master the foreign trade process in e-commerce and the policies for cross-border e- commerce in the free trade zone. Therefore, the requirements for relevant talents are high, and the training of employees is not comprehensive enough.
Ranking Country
(Region) 2017 2018
Year on year growth rate
of total exports
1 USA 42973038 47839581 11.3%
2 Hong Kong,
China 27921137 30202160 8.2%
3 Japan 13725893 14704868 7.1%
4 Korea 10270378 10875614 5.9%
5 Vietnam 7161725 8387669 17.1%
6 Germany 7113440 7748934 8.9%
7 India 6804225 7667566 12.7%
8 Netherlands 6713167 7283469 8.5%
9 England 5671352 5654298 -0.3%
10 Russia 4283060 4796527 12.0%
As shown in Table 2, compared with 2008, the proportion of tariff revenue to fiscal revenue decreased by 1.34% in 2018. It can be seen that in the past 10 years, China's contribution rate of tariff revenue to China's finance has been reduced due to the continuous implementation of trade facilitation, the efforts to reduce the complex customs clearance procedures and improve the trade environment.
Because of the impact of the global financial crisis in 2008, the overall decline of China's fiscal revenue is obvious, so it shows that the proportion of tariff revenue in fiscal revenue dropped sharply in 2009. In the following two years, due to the gradual recovery of trade, China's fiscal revenue also gradually increased, thus showing an increase in tariff revenue, and its proportion in fiscal revenue also increased.
From 2012 to 2018, the proportion of tariff revenue to fiscal revenue in China has been declining. Generally speaking, the implementation of trade facilitation in China has reduced the contribution rate of tariff revenue to fiscal revenue. That is to say, the decrease of the contribution rate of tariff revenue to fiscal revenue reflects a part of the cost of China's trade facilitation reform.
Table 2: China's tariff revenue and fiscal revenue and their proportion
Tariff (100 million yuan)
Financial revenue (100 million yuan)
Tariff as a proportion of fiscal revenue
2008 1769.95 61330.35 2.89%
2009 1483.81 68518.3 2.17%
2010 2027.83 83101.51 2.44%
2011 2559.12 103874.43 2.46%
2012 2783.93 117253.52 2.37%
2013 2630.61 129209.64 2.04%
2014 2843.41 140370.03 2.03%
2015 2560.84 152269.23 1.68%
2016 2603.75 159604.97 1.63%
2017 2997.85 172592.77 1.74%
2018 2847.78 183359.84 1.55%
Data source: National Bureau of Statistics
4.1.2. Benefits of trade facilitation
However, the benefits of trade facilitation are also considerable. First of all, after the reduction of the heavy customs formalities, the cost for the trade personnel is reduced, and then the competitive advantage is obtained.
The low price strategy can be adopted to occupy the share in the international market. For consumers, they can get the same goods at a lower price, achieving a win-win situation.
Secondly, for the customs, reducing the burden of trade procedures can improve the efficiency of goods clearance.
The facilitation of customs procedures can greatly shorten the time for handling customs formalities. For enterprises, simple customs clearance procedures can reduce the cost of warehouse management and handling of formalities caused by detention of products and save costs. Finally, for the government, it can improve efficiency, regulate the trade of relevant departments, and ensure the fairness and transparency of trade environment. At the same time, attracting foreign investment will promote economic growth.
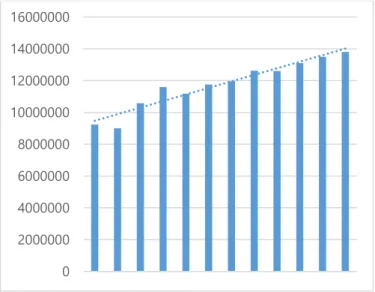
Data source: National Bureau of Statistics
Figure 3: Actual amount of foreign direct investment (USD 10000)
According to the observation in Figure 3, the overall trend of the actual use of foreign direct investment in China is on the rise. Under the influence of the financial crisis in 2008, China's actual use of foreign direct investment in 2009 showed a negative growth. China has taken corresponding policies in time to improve the overall institutional environment and attract foreign investment. In 2010-2011, when the global economy is weak, the amount of foreign direct investment actually used in China has increased. From 2012 to 2019, China's actual amount of foreign direct investment fluctuated by a small margin, but it eventually rose. Generally speaking, China's implementation of trade facilitation has created a good economic environment, and the economic growth situation in recent years is relatively optimistic. Therefore, it has attracted foreign investors to invest in China and expand the scale of investment, which has a positive role in promoting China's economic development.
0 2000000 4000000 6000000 8000000 10000000 12000000 14000000 16000000
4.2. Analysis and calculation of Trade Facilitation Index
In the "impact of trade facilitation on cross-border e- commerce between China and South Korea" published by Choi (2019), infrastructure level, information and communication technology, customs clearance environment and government policy environment are used to measure the development level of trade facilitation and calculate the Trade Facilitation Index. This study also adopts the same method as the above, and changes China's trade facilitation level from abstract level to measurable data.
As the representative of trade facilitation, four parts are measured as follows: institutional environment includes government policy burden (G1) and efficiency of legal framework (G2), which is used to measure the complexity of trade administrative requirements and the legal effectiveness of dispute resolution. The infrastructure index is measured by the efficiency of national transport routes. The customs environment includes two parts: trade barrier (C1) and customs procedure burden (C2), which is to measure the limitation of non-tariff barrier on imported goods and the complexity of customs procedures. All the above three items are measured by 1-7 points. 1 indicates low efficiency or complicated procedures, and 7 indicates high efficiency or simple procedures. The level of ICT is measured by the number of Internet users, in%. 0 is used by no one, 100 is used by all. After calculation and calculation based on other data, 1-7 points will be used for measurement.
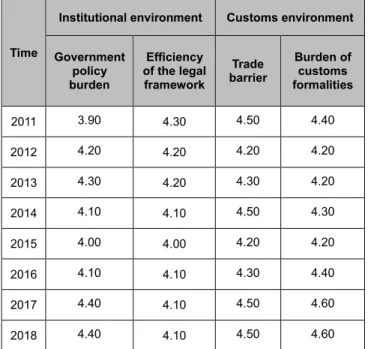
Table 3: Index of system environment and customs environment
Time
Institutional environment Customs environment
Government policy burden
Efficiency of the legal
framework
Trade barrier
Burden of customs formalities
2011 3.90 4.30 4.50 4.40
2012 4.20 4.20 4.20 4.20
2013 4.30 4.20 4.30 4.20
2014 4.10 4.10 4.50 4.30
2015 4.00 4.00 4.20 4.20
2016 4.10 4.10 4.30 4.40
2017 4.40 4.10 4.50 4.60
2018 4.40 4.10 4.50 4.60
Source: World Competitiveness Index Report
In the report of the world competitiveness index, some indexes of infrastructure and information and communication technology can be obtained, but the selected index of measuring system environment and customs environment includes small classification. In order to prevent interference with the calculation of China's Trade Facilitation Index, the index of small classification of system environment and customs environment is listed, and then the formula is used for calculation Get more accurate system environment and customs environment part index.
In order to calculate the index of institutional environment (g) in year X and the index of customs environment (c) in year x, the above indexes are calculated according to the following formula:
/2 ) ( g
1xg
2xG
x
/2 ) (
1 2xx
c c
C
x
Among them, G1 and G2 respectively represent the government's policy burden and the efficiency of the legal framework, C1 and C2 respectively represent trade barriers and customs formalities burden. According to the above calculation, the calculation results of China's institutional environment index and customs environment index are as follows:
Table 4: Index of institutional environment and customs environment
Institutional environment
Customs environment
2011 4.10 4.45
2012 4.20 4.20
2013 4.25 4.25
2014 4.10 4.40
2015 4.00 4.20
2016 4.10 4.35
2017 4.25 4.55
2018 4.25 4.55
Data source: calculated by the author
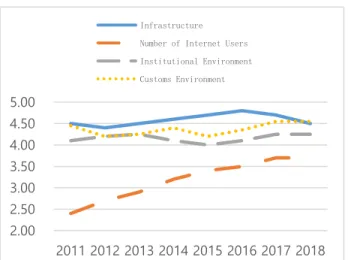
In order to more accurately observe the change trend of
each part of the Trade Facilitation Index, the Integrated
Trade Facilitation Index is now made into a line chart form:
Data source: data from the world competitiveness index report and the author 's collation
Figure 4: Trade Facilitation Index
From the above figure, we can see clearly the development trend of China's Trade Facilitation Index over time, especially in the number of Internet users. From the comparison of 2011 data with 2018 data, the index of Internet users increased by 1.3 units, achieving an average annual growth rate of 7.7%. After observing some indexes of customs environment and institutional environment, it is found that although the changes of both are relatively weak, they show a small increase in the end. And both fell to their lowest levels in recent years in 2015. From 2012 to 2016, China's infrastructure index grew steadily, reaching 4.6, 0.4 units higher than 2012, but began to fall in 2016, and finally in 2018, the index was the same as 2011. On the whole, the development trend of China's Trade Facilitation Index is relatively stable.
In order to facilitate the analysis of the impact of Trade Facilitation Index on China's export trade, the Trade Facilitation Index is calculated as follows:
4 / ) (
x x x xx
G T C I
TFI
Among them, representing the institutional environment of a country, representing the infrastructure of a country, and representing the customs environment and ICT respectively, average the sum of the above indexes to measure the level of trade facilitation of a country, and calculate the TFI of China as follows:
From 2011 to 2018, China's Trade Facilitation Index showed an upward trend. In addition to the fact that China's Trade Facilitation Index was flat in 2014 and 2015, China's Trade Facilitation Index showed a small increase in the rest of the year, but fell again in 2018. Finally, compared with 2011, China's Trade Facilitation Index has increased.
Compared with figure 1, with the increase of Trade Facilitation Index, China's total export trade is also growing.
In addition to the fluctuations in 2015, the trends of the two are similar in general.
Table 5: Trade Facilitation Index
Trade Facilitation Index
2011 3.86
2012 3.88
2013 3.98
2014 4.08
2015 4.08
2016 4.19
2017 4.30
2018 4.25
Data source: calculated by the author
5. An empirical analysis of the impact of trade facilitation on China's exports
5.1. Data processing and description
According to the article "the impact of trade facilitation on cross-border e-commerce between China and South Korea" published by Choi in 2019, the Trade Facilitation Index is selected as the independent variable x and the scale of cross-border e-commerce export as the dependent variable y to measure the impact of trade facilitation on China's cross-border e-commerce export trade. Therefore, this paper also takes a similar way. Select the time series as the data of 2011-2018, select the total amount of China's trade exports to measure the development level of China's export trade, select the calculated Trade Facilitation Index to measure the development level of China's trade facilitation, including China's Trade Facilitation Index and China's export trade scale. In order to establish the model, we set the Trade Facilitation Index as X and the export trade volume of China as Y.
5.2. Model building and testing
5.2.1. Correlation analysis
According to the data of China's export trade scale obtained by the National Bureau of statistics, and then based on the China's Trade Facilitation Index x calculated in this study, China's export trade scale y. In order to observe the similarity of the development trend between the
2.002.50 3.00 3.50 4.00 4.50 5.00
2011 2012 2013 2014 2015 2016 2017 2018
Infrastructure Number of Internet Users Institutional Environment Customs Environment
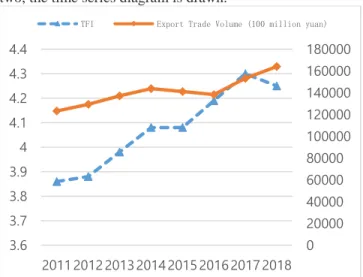
two, the time series diagram is drawn.
Data source: calculated by the National Bureau of statistics and the author
Figure 5: TFI and export trade scale (unit: 100 million yuan)
According to figure 5, it can be seen that the development trend of China's trade exports and Trade Facilitation Index is basically the same. From 2011 to 2014, China's trade exports and Trade Facilitation Index showed an upward development state. In 2015, the export trade volume and Trade Facilitation Index also fell slightly. Since 2016, it has shown an upward trend. It can be seen from the figure that the development of Trade Facilitation Index of the two countries has a strong convergence with the growth of China's export trade scale. Therefore, eviews7.2 software is used to analyze the correlation between X and Y, and calculate the correlation coefficient. To measure the correlation between Trade Facilitation Index and China's export trade volume, table 6 is obtained:
Table 6: Correlation analysis of TFI and China's export
X Y
X 1 0.877427
Y 0.877427 1
According to table 6, it can be seen that the correlation coefficient of X and Y is 0.877427, which is close to 1, indicating that there is a strong correlation between X and Y, and that X and Y are closely related. According to the above, it can be inferred that there is a certain correlation between the level of trade facilitation and China's export trade.
5.2.2. Unit root test
In order to avoid the phenomenon of pseudo regression in the model, the stationarity of panel observation data is
determined to ensure the effective regression results.
Therefore, the unit root test is carried out on the data, and the results are as follows:
Table 7: Correlation analysis of Trade Facilitation Index and export trade volume
Variable X D(X,1) Y D(Y,1)
ADF -
0.873015 -
16.40414 -
0.111400 -3.686574
1% -
4.083492 -
5.604618 -
4.803492 -5.604618
5% -
3.403313 - 3.694851
-
3.403313 -3.694851
10% -
2.841819 - 2.982813
-
2.841819 -2.982813 Conclusion Instable Stable Instable Stable Note: D (x, 1) represents the first-order difference of X, D (y, 1) represents the first-order difference of Y
From the test results in Table 7, it can be seen that the sequence of Independent Trade Facilitation Index and dependent variable China's export trade volume becomes stable after the first-order difference. And both of them pass the t-test when the statistic is 1%. Therefore, the overall data is relatively stable. Taking sample data as observation object is also more explanatory.
5.2.3. Model building
Through the above correlation test and unit root test, it is preliminarily determined that there may be a linear relationship between the Trade Facilitation Index and China's export trade volume. Therefore, a single regression model between independent variables and dependent variables is established respectively, in which other factors and random factors affecting China's export regulation change are indicated:
X
iY 0 1 ei
X Y 0 1
5.2.4. Empirical results and analysis
The unit root test results of the sample data show that the sequence of independent trade facilitation index x and dependent variable China's export trade volume y are first- order single integer, which proves that the data are relatively stable. Next, the OLS analysis method is used, and then t-test is performed on the results to verify whether the independent variable has significant influence on the dependent variable. The results calculated by eviews7.2 software are shown in Table 8:
0 20000 40000 60000 80000 100000 120000 140000 160000 180000
3.6 3.7 3.8 3.9 4 4.1 4.2 4.3 4.4
20112012 201320142015 201620172018
TFI Export Trade Volume (100 million yuan)
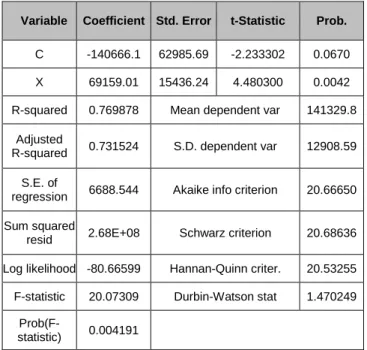
Table 8: OLS regression analysis results
Variable Coefficient Std. Error t-Statistic Prob.
C -140666.1 62985.69 -2.233302 0.0670 X 69159.01 15436.24 4.480300 0.0042 R-squared 0.769878 Mean dependent var 141329.8
Adjusted
R-squared 0.731524 S.D. dependent var 12908.59 S.E. of
regression 6688.544 Akaike info criterion 20.66650 Sum squared
resid 2.68E+08 Schwarz criterion 20.68636 Log likelihood -80.66599 Hannan-Quinn criter. 20.53255 F-statistic 20.07309 Durbin-Watson stat 1.470249
Prob(F-
statistic) 0.004191
The sample regression model is obtained as follows:
1is the slope of the sample regression equation, which indicates that when the level of trade facilitation in China increases by one unit, there will be an increase of export trade volume of 6915901 million yuan;
0is the
intercept of the regression equation, which indicates other situations affecting China's export trade volume besides the level of trade facilitation. Trade Facilitation Index has a positive impact on the growth of China's export trade, which is in line with the economic significance. The R- square and the adjusted R-square indicates that the fitting degree of sample regression line is high. The t-test value is obviously larger than the critical value of T when the significance level is = 0.05, so the regression coefficient is significantly not zero. Therefore, it shows that the Trade Facilitation Index observed by sample data has a positive effect on the development of export trade measured by total export trade.
6. Conclusions and policy recommendations 6.1. Research conclusion
In this paper, by referring to the relevant research on the impact of trade facilitation on export trade, the Trade Facilitation Index is calculated through the various categories covered by trade facilitation, combined with the
current situation of China's export trade development, and in the previous chapter, the results are obtained through empirical analysis, combined with the actual situation analysis as follows:
First, the development trend of China's trade facilitation is similar to that of China's export trade. From the correlation analysis, we can conclude that the Trade Facilitation Index has a high correlation with China's export trade volume. In other words, promoting the development of trade facilitation has a stimulating effect on China's export trade. In recent years, China has tried paperless customs clearance in the field of customs clearance, and revised and improved the foreign trade law in order to improve the level of trade facilitation. The results of empirical analysis show that the increase of China's export trade volume is closely related to the development of trade facilitation. Therefore, promoting the development of trade facilitation has significant practical significance for the development of China's export trade.
Second, the development of trade facilitation has a significant impact on China's export trade. From the above empirical analysis, it can be seen that a 0.1 unit change in Trade Facilitation Index will increase China's export trade by 6915.901 billion yuan. Making progress in any aspect covered by trade facilitation will play a positive role in stimulating the development of China's trade exports.
Generally speaking, the expansion of China's export trade scale may lead to the expansion of China's import and export trade balance. When the total export volume is larger than the total import volume, a trade surplus will be formed, which will stimulate the expansion of the total national demand and make the domestic economic growth.
Moreover, due to the "trade multiplier" effect, the increase of net exports tends to make the economy show multiple growth scale. In general, promoting the development of trade facilitation has a good role in promoting China's economic growth.
6.2. Suggestions on the development of China's export trade under the promotion of trade facilitation
6.2.1 Improve the level of infrastructure construction and improve relevant legal provisions
The development of export trade needs strong
infrastructure to provide support. This is not only to
emphasize that all parts should be taken into account and
infrastructure construction projects should be carried out in a
coordinated and unified way. The most important thing is to
fully understand the current situation of China's ports. The
comprehensive planning of the port, reasonable and full use
of existing resources, the optimal allocation of resources. It is necessary for the government to provide relevant policies and indicators to promote the transformation of China 's existing port modernization, improve the laws of foreign export trade, protect the rights of importers and exporters from infringement, create an open and transparent trade environment, stimulate importers and exporters to expand trade norms, and then make a favorable impact on China' s economic development.
6.2.2. To build an information-based customs clearance platform and promote the development of information and communication technology
The development of trade facilitation plays a positive role in export trade, while information technology breaks the time and space constraints, making the import and export trade more convenient. Build a comprehensive service platform integrating customs declaration, inspection and other trade procedures, so as to reduce the loss of time and cost in the process of handling various customs clearance procedures, make full use of the convenience and flexibility of information and communication technology, realize the sharing of information, goods and capital flows, and improve the transparency of transactions. The platform can also monitor, control, classify and deal with emergencies in real time to reduce trade risks. We should attract foreign consumers to import domestic goods, expand the trade surplus and realize economic growth.
Reference
Choi, J. (2019). The impact of trade facilitation on cross-border e- commerce between China and South Korea. Zhejiang University.
Dollar, D., Driemeier, M.H., & Mengistae, T. (2004). Investment Climate and International Integration. World Bank Policy Working Paper 3323..
Fang, H. (2017). Research on the impact of trade facilitation on China's export trade. Beijing: University of economics and trade, 1, 22-35.
Fink,C., Mattoo, A., & Neagu, I.C. (2002). Assessing the impact of Communication Cost on international Trade. Policy Research Working Paper Series, The World Bank, 1(16), 81- 108.
Guo, D. (2017). Research on the impact of trade facilitation on China's exports. Zhejiang University of technology and industry.
Li, T.(2015). Research on the impact of trade facilitation on China's export trade. Ningbo University.
Shan, J., & Zhou, P. (2012).APEC based trade facilitation assessment and empirical analysis of its impact on China's exports. International business research, 33 (01): 40-45 + 74.
Song, W., & Jia, X.(2018). Research on the impact of trade facilitation on China's product exports based on the calculation of G20 countries. Macroeconomic research, 1(11):
102-115.
Wang, L. (2015). Study on the construction of Trade Facilitation Index System and its impact on China's export trade. Shandong University.
Yang, J.(2013). The impact of trade facilitation on China's export trade level. Zhejiang University of technology and industry.
Yang, J., Huang, J., Hong, J., & Dong, W.(2015). Analysis of the impact of trade facilitation on China's economy.
International trade issues, 2015 (09), 156-166.
Zhu,J., & LV, J.(2015). Research and application of evaluation index system of trade facilitation. Journal of Hunan University (SOCIAL SCIENCE EDITION), 29 (06), 70-75.
Zhou, X. (2007). Research on the evaluation system of trade facilitation and its impact on China's foreign trade. Hunan University.