Corresponding author: Deok-Beom Lee, Gwangyang Landscape Co., Ltd., Gwangyang 545-875, Korea, Tel.: +82-61-792-5474, E-mail:
Growth of Landscape Tree Species at Two Planting Densities in a Planting Pilot System for Reclaimed Dredging Areas
Lee, Deok-Beom* ․ Nam, Woong* ․ Kwak, Young-Se** ․ Jeong, In-Ho*** ․ Lee, Sang-Suk***
*Gwangyang Landscape Co., Ltd.
**Research Institute of Industrial Science and Technology
***Dept. of Landscape Architecture, Sunchon National University
임해준설매립지 식물재배공정에서 밀도에 따른 조경수목의 생장
이덕범*․남웅*․곽영세**․정인호***․이상석***
*광양조경(주)․**포항산업과학연구원․***순천대학교 조경학과
ABSTRACT
To investigate the possible use of plants for landscaping in reclaimed soil, a planting pilot system experiment was performed over the course of four years in reclaimed dredging area with four species: Alnus firma, Alnus hirsuta, Pinus thunbergii, and Pyrachantha angustifolia for 4 years. The physicochemical characteristics of the tested soil showed that it was sandy through coming from a reclaimed dredging area. The average pH of the tested soil was 7.16(slight alkali), and electric conductivity(EC) was relatively low, 294µS/cm, even though it came from a saltwater area.
To test the effect of planting density vs. phytomass by plant specie from a planting basin, the experiment was designed using four plant species with high and low planting densities over 4 years. The planting conditions of the growth of landscape tree species exhibited growth height as follows: A. hirsuta, A. firma, P. thunbergii, and P. angustifolia, whill the DBH followed the order of A. hirsuta, A. firma, and P. thunbergii. The total phytomass of each plant was higher at low density planting areas than high density planting area in terms of total phytomass production and growth distribution in the reclaimed dredging area. Total phytomass per unit area increased as follows: A. hirsuta, A. firma, P. thunbergii, and P. angustifolia.
The total phytomass per each tested plant was 2 times higher in low density planting areas than high density planting areas.
Total phytomass per unit area, however, was similar or slighty higher in high density planting areas compared to low density areas. Among the tested plants, A. hirsuta showed the highest phytomass, implying that A. hirsuta adapted very well to the reclaimed area and has the capability of a fast growth, nitrogen fixation tree, and utilizing insoluble nutrients through inoculated root nodule bacteria. The yield of phytomass per individual in low density Alnus species was greater than that of the high density. However, those per unit areas had no difference in the density-dependent planting. The ratio of belowground to aboveground was 0.21~0.26. Thus, it could be concluded that the Alnus species are potential candidates for ornamental tree species in reclaimed dredging areas.
This study offers baseline data for the use of ornamental tree species in reclaimed dredging areas. Additional research is required for different ornamental species in order to increase phytomass of a planting conditions based on reclaimed dredging areas.
Key Words: Alnus Species, Phytomass, Planting Density, Root Nodule Bacteria, Salt
국문초록
본 연구는 임해준설매립지반의 토양환경에서 4종의 조경수종을 대상으로 생장 및 적응성을 평가하였다. 준설토와 조경토를 1:1로 혼합하여 1m 높이로 조성한 식물재배 실험구(planting pilot system)기반 토양의 토성은 사질토(S)로 분류되었 고, 평균 pH값은 7.16으로 약알칼리성을 나타내었으며, 전기전도도(EC)는 294 µS/cm로 해수의 영향을 받았던 토양이었으나 비교적 낮은 EC값을 보였다. 토양의 유기물 함량은 3.9%로 낮았고, 총질소 함량은 397 mg/kg에 가깝게 나타났으며, 인산의 평균함량은 4.60 mg/kg으로 매우 낮아 식물의 생장을 돕기 위해서는 계획적인 인산질 비료의 시비가 필요한 것으로 사료되 었고, 토양의 치환성 양이온 함량은 K가 152.9 mg/kg, Ca가 1,190 mg/kg, Mg가 62.7 mg/kg, Na가 24.8 mg/kg으로 비교적 높은 함량을 나타내었다.
식재후 4년인 비교년도의 식물재배 실험구에서 식재조건에 따른 생장수고는 물오리나무>사방오리>곰솔>피라칸사 순으로 나타났고, 흉고직경은 물오리나무>사방오리>곰솔 순으로 나타났다. 사방오리, 물오리나무, 곰솔 및 피라칸사 개체당 열매, 잎, 가지, 줄기, 주근, 중근 및 세근의 식물량은 고밀도보다 저밀도 식재지역에서 높게 나타났고, 고밀도와 저밀도 식재지역에서 개체당 식물량은 물오리나무>사방오리>곰솔>피라칸사 순으로 나타났다. 식물재배 실험구에서 4종 모두 고밀도보다 저밀도 식재지역에서 개체당 식물량은 물질생산 및 분배가 크게 반영된 생육양상을 보여 약 2배 높았다. 이는 토양 내의 영양염류의 이용경쟁에 있어 고밀도보다 저밀도 식재지역에서 더욱 유리한 조건이 반영되었기 때문으로 판단되었다. 단위면적당 식물량은 물오리나무>사방오리>곰솔>피라칸사 순으로 나타났고, 식물량이 가장 적은 피라칸사 기준으로 곰솔은 약 7배, 사방오리는 약 13배, 그리고 물오리나무는 약 23배 높은 식물량을 나타내었다. 식재조건 에 따른 실험 수종 개체당 식물량은 고밀도보다 저밀도 식재지역에서 약 2배 높은 것으로 나타났지만, 단위면적당 식재조건 에 따른 식물량은 저밀도보다 고밀도 식재지역이 비슷하거나 높았다. 고․저밀도 식재지역에서 오리나무속의 식물들이 많은 식물량을 보였는데, 이는 임해준설매립지의 토양 특성에 잘 적응성을 나타냄과 동시에 질소 고정능력을 갖는 속성수 (fast-growing tree)의 특성 및 지하부에 뿌리혹박테리아(root nodule bacteria)가 형성됨으로써 토양에 불용성 영양원의 이용도 를 높일 수 있는 능력이 있기 때문으로 판단되었다.
본 연구는 제한된 부지를 대상으로 4종의 식물만을 이용하여 연구가 진행되었기 때문에 다양한 식재조건 및 수종을 대상으로 하는 추가적인 연구가 필요하고, 조경분야의 생태적 활용을 위해서는 대상 식물들을 이용한 조경학적 적용방안에 대한 연구가 보완되어야 한다.
주제어: 오리나무속, 식물량, 식재밀도, 뿌리혹박테리아, 염분
Ⅰ. Introduction
Because of the growing demand of the land for indus- trialization and regional development since 1960s, S. Korea has been forced to reclaim the vast intertidal areas to cover the shortage of land(Nam, 2008). Because the soil in the coastal landfill area is not suitable for the growth of trees, it is required to build and manage man-made ground layers con- tinuously for the introduction of the trees into the area. Re- cently, the ecological forestation by the introduction of na- tural vegetation is recognized as an alternative for the arti- ficial plantation(Kwak et al., 2004). As a result, the interest in the wild plants in the coastal landfill area is also increased.
In terms of landscape or ecological point of view, these plants can be regarded as very useful natural resources, for the
plants can adapt themselves to the environmental change without the artificial management or energy support. Re- searches on salt marsh were mainly conducted on the dis- tribution patterns of the halophyte(Sally and Zedler, 2000), the survival strategy of the halophyte responsive to soil environmental factors(Min and Kim, 1999), the community analysis and utilization possibility of halophyte(Silvestri et al., 2005). The principal effects of salinity are felt via the plant's altered osmotic balance. The low external solute potential(e.g.
-20bar for sea water of roughly 3% NaCl) means that the
plant must achieve even lower intercellular potential in order
to take water, which can lead to 1) reduce growth, 2)
depress transpiration rate, 3) reduce water availability, and 4)
an excessive accumulation of ions and reduce uptake of
essential mineral nutrients(Ranwell, 1972). Reclamation of
salt-affected soils requires 1) adequate internal drainage, 2) replacement of excess exchangeable sodium in sodic soil, and 3) leaching out of the soluble salts. Through analyzing the specific physicochemical alterations in depth-based soil at reclaimed dredging area, the baseline data were provided for developing the reclaimed dredging area as natural landscape planting sites and ecological landscape sites based on the soil improvement technology(Nam et al., 2008a). A great deal of work has been carried out on the ecology of ‘salt marsh' in reclaimed dredging area(Nam, 2008). However, phytomass and productivity of a ornamental tree species in reclaimed dre- dging area is still unknown. This study was designed to eva- luate the potential use of landscape tree species in reclaimed dredging area.
Ⅱ. Study Area and Methods
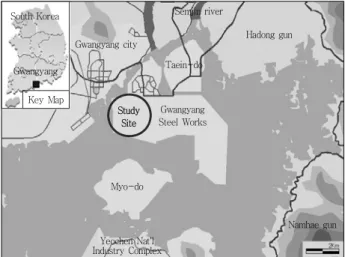
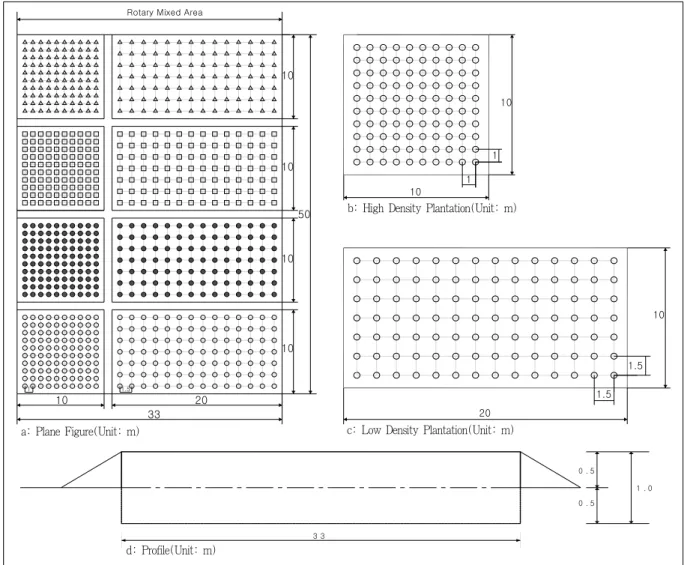
This study was carried out at reclaimed dredging area, Gwangyang bay, South Korea(Figure 1). There was no phy- sical disturbance for 15 to 20 years in Gwangyang bay re- claimed dredging area after reclamation. This study area is almost flat and is predominated with dense growth of Phrag- mites communis, Imperata cylindrica, and interspersed with mosaic pattern of Pinus thunbergii, Alnus firma, Alnus hir- suta, Salix koreensis, Ulmus davidiana var. japonica, Robinia pseudoacasia showing the characteristics of the coastal landfill area around the area. Research results showed that there is a great deal of possibility of planting landscape plant or tree in the area. To make planting basin, reclaimed dredging soil and fresh mountain soil with low organic matter(<1%), and electric conductivity(<0.5μS/cm) was mixed 1.5 meter inter- val with 1:1 ratio and installed to 1m. The size of experi- mental plot was 33m(W)×50m(L)×1m(H). Pilot planting plot was designed with depth 100 individuals for high density (10m(W)×10m(L)) and 49 individuals for low density (10m (W)×20m(L))(Figure 2). After planting of sapling, the pilot planting system was irrigated with a watering cart.
Experimental tree species: Alnus firma, Alnus hirsuta, Pinus thunbergii, and Pyracantha angustifolia were selected by wild growth and performance species out of planting ornamental tree species at reclaimed dredging area. From April 2004 to September 2007, two permanent plots were maintained with four landscape tree species with two planting densities. The trees were measured for DBH and tree height for the four
Figure 1. A map showing the study area.
Gwangyang Steel Works Taein-do
Gwangyang city Hadong gun
Myo-do
Yeochen Nat'l Industry Complex
Namhae gun Semjin river
South Korea
Key Map Gwangyang
Study Site
ornamental tree species annually(Figure 3, 4, 5). Sapling in the pilot system was same in age and size; heights of sa- plings in A. firma, A. hirsuta, P. thunbergii, and P. angus- tifolia were 100.2, 100.3, 130.1 and 70.2cm on the average, re- spectively. To estimate phytomass and production for each plant, harvest techniques were used through sequential har- vest of plant parts during the course of the growing season (Whittaker and Marks, 1975). The trees were separated into reproductives, leaves, branches, stem, main root, coarse roots (2~8mm), fine roots(<2mm) for four species(Figure 6).
Subsamples of these materials were dried at 80℃ untill re- aching to a constant weight and reweighed. In April 2004 and September 2007, six soil samples were taken respectively from each experimental tree species at a depth 1m from sur- face using soil sampler in each planting condition based on a planting pilot system. Chemical analysis of soil were deter- mined by Standard Method of Soil Analysis(Ministry of En- vironment, 2005).
Ⅲ. Results and Discussion
1. Physicochemical Properties of Soil
The soil was categorized as sandy soil because it came from
the reclaimed dredging area, and average soil pH was 7.16
(slight alkali), and electric conductivity(EC) showed rela-
tively low value, 294µS/cm, even though it came from sea-
water effected area. It was dued to the long-term exposure to
rainfall in reclaimed dredging area altered soil characteristics
(Nam et al., 2008b). Organic matter contents were high with
Figure 2. Layout of two planting densities in a planting pilot system.
Legend: △ Pyracantha angustifolia □ Pinus thunbergii ● Alnus firma ○ Alnus hirsuta
Rotary Mixed Area
1 1.5
1.5 1.5 1
1 10
10
10
33 20
50 10 10
10
10
20 10
a: Plane Figure(Unit: m)
b: High Density Plantation(Unit: m)
c: Low Density Plantation(Unit: m)
3 3
0 . 5
0 . 5
1 . 0
d: Profile(Unit: m)
3.9%, but total nitrogen and available phosphorus was low with 397mg/kg and 4.60mg/kg. Contents of potassium, cal- cium, magnesium, and sodium of planting basin soil were 152.9mg/kg, 1,190mg/kg, 62.7mg/kg, and 24.8mg/kg on the average, respectively(Table 1). Exchangeable cation contents was higher than those of general plantation soil(Nam, 2008).
According to classification of salt-affected soils, 1) saline soil has a saturation extract conductivity of 4.0 decisiemens per meter or greater and has a low SAR(less than 13), 2) sodic soil has an Sodium Adsorption Ratio(SAR) of saturation extract of 13 or more but has low salt content, 3) saline-sodic soil has both the salt concentration to qualify as saline and SAR of 13 or more needed to qualify as sodic. Despite the electric conductivity of soil is around 4.0dS/m, however, plants sensitive to salt may be affected by contents as low as
2.0dS/m and salt tolerant plants may not be affected below 8.0dS/m salt content(Miller and Donahue, 1990).
2. Tree Growth
Height growth of the four species after 4 years was in-
creased from 5.36 to 5.86 folds for A. firma, from 5.68 to 6.13
for A. hirsuta, from 1.81 to 1.87 folds for P. thunbergii, and
from 1.55 to 1.88 folds for P. angustifolia. Each plant of
height exhibited higher at low density planting area than high
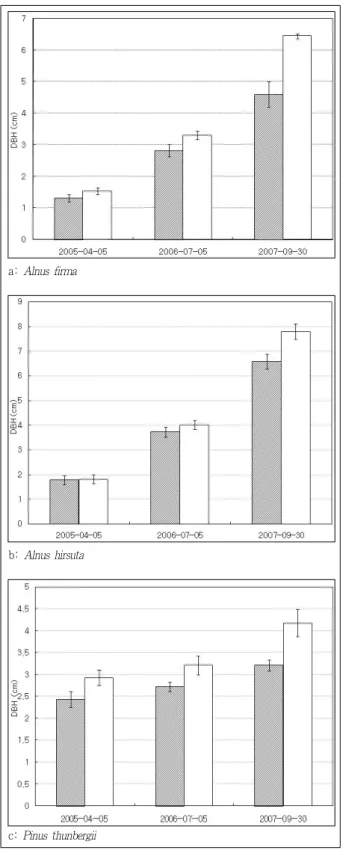
density planting area(Table 2). The DBH of three species of
high and low density after 4 years was increased from 3.51 to
4.22 folds for A. firma, from 3.72 to 4.28 folds for A. hirsuta,
from 1.32 to 1.43 folds for P. thunbergii(Figure 7). Among
the tested plants, A. hirsuta showed the highest phytomass,
indicating that A. hirsuta adapted very well at reclaimed dre-
Figure 3. Photographs of growing stages of Alnus hirsuta on the planting pilot system.
a: April 2004 b: October 2004 c: September 2007
Figure 4. Photographs of growing stages of Pyracantha angustifolia on the planting pilot system.
a: April 2004 b: October 2004 c: September 2007
Figure 5. Photographs of growing stages of Pinus thunbergii on the planting pilot system.
a: April 2004 b: October 2004 c: September 2007
dging area. These results are generally recognized to origi- nated from the difference between resource availability, total net primary production, the allocation of both net primary production and nutrients to different tissue types, and the effects of allocation and other physiologic processes on nu- trient use efficicency(Kwak, 1993).
3. Phytomass Changes of Plant Parts
Total phytomass of the reference plant which is A. firma, A. hirsuta, P. thunbergii, and P. angustifolia was 62.8, 84.9, 393.5, and 63.0 on the average, respectively(Table 3). Plant phytomass of plant parts per individuals of high and low density on the average on the planting pilot system after 4 years was presented in Table 4. Phytomass of reproductives, leaves, branches, stem, and root of A. firma after 4 years was 311, 786, 921, 2,818, and 1,131 g·d.w./indiv. in high density
and 813, 1,601, 1,927, 5,516, and 2,540 g·d.w./indiv. in low density, respectively(Table 4 and Figure 8). Those of A.
hirsuta were 160, 1,241, 1,731, 5,620, and 1,907 g·d.w./indiv.
in high density and 210, 2,691, 4,931, 7,700, and 3,376
g·d.w./indiv. in low density, respectively(Table 4 and Figure
8). Those of P. thunbergii were 261, 955, 604, 868, and 330
g·d.w./indiv. in high density and 255, 1,370, 1,175, 1,370, and
756 g·d.w./indiv in low density, respectively(Table 4 and
Figure 8). And those of P. angustifolia 16, 83, 164, 121, and
79 g·d.w./indiv. in high density and 21, 170, 340, 263, and 195
g·d.w./indiv. in low density, respectively(Table 4 and Figure
8). Some evergreen species can respond to particularly low
site quality by increasing needle retention time(Khade and
Adgoleya, 2007). In comparison of phytomass of the parts of
four species for two different planting densities on the plan-
ting pilot system, phytomass of low density was higher than
Figure 6. Photographs of aboveground and belowground phytomass measurement on the planting pilot system.
Table 1. Physicochemical properties of soil on the planting pilot system
No. pH EC
(µS/cm) O.M.
(%)
T-N (mg/kg)
PO3 -4
(mg/kg)
Exchangeable cation(mg/kg)
K Ca Mg Na SAR
Mean 7.16±0.23 294±75 3.9±0.7 397±86 4.60±1.69 152.9±24.8 1,190±174 62.7±16.5 24.8±7.5 0.247±0.168
*: n=20
Table 2. Comparison of plant height growth of four species between two different planting densities
Division Species
High density(cm) Low density(cm)
30 Apr, '04 5 Apr, '05 5 Jul, '06 30 Sep, '07 30 Apr, '04 5 Apr, '05 5 Jul, '06 30 Sep, '07 Alnus firma 100.2±10.3 142.0±13.5 235.3±12.6 537.3±23.7 100.2±10.3 157.0±11.9 297.2±23.5 586.7±15.3 Alnus hirsuta 100.3±10.1 153.0±21.3 249.6±31.2 569.2±15.8 100.3±10.1 167.2±18.2 292.3±11.4 615.0±5.0 Pinus thunbergii 130.1±20.2 143.0±13.2 158.6±23.2 235.3±9.5 130.1±20.2 150.6±11.4 170.8±18.2 243.3±2.9 Pyracantha angustifolia 70.2±10.2 79.0±1.5 83.0±1.7 109.0±3.6 70.2±10.2 88.0±3.2 103.0±3.2 131.7±2.4
that of high density after 4 years. It was clear that species of low density take a lot advantage in resource availability gradients than species of high density(Waisel et al., 1991).
Thus, the trees growing at low density have gained more dry matter production and allocation into plant parts in dredging reclaimed area.
Among the tested plants, Alnus species showed the highest phytomass, indicating that A. hirsuta adapted very well at
reclaimed dredging area and hold capability of fast growing,
nitrogen fixation tree, and utilized insoluble nutrients using
inoculated root nodule bacteria(Figure 9). Root nodulation by
rhizobium bacteria occurs in most species of legumes, and
nodulation has also been reported in 158 species from 14
genera of no-legumes, including Alnus, Myrica, Dryas, Ca-
suarina and Hipophae(Allen, 1998). Not surprisingly, preva-
lence of above plants in nitrogen-deficient soils, and during
Figure 7. Secular changes in diameter of breast height(DBH) with two different densities on the planting pilot system.
Legend: high density, low density a: Alnus firma
b: Alnus hirsuta
c: Pinus thunbergii
the early stages of primary succession is common(Khade and Adgoleya, 2007). In a root nodule bacteria association, the
fungus obtains carbohydrate from the root system of the plant, and the plant obtains nutrients from the fungus(Allen, 1998). It is generally recognized that the degree of subsidy to root symbiont varies with site quality or nutrient availability (Wright et al., 2000).
4. Phytomass Changes of Plant Individuals
Plant phytomass per individuals on the planting pilot sys- tem after 4 years is shown in Table 5 and Figure 8 on the average. Total phytomass of A. firma increased 95 folds from 63 g·d.w./indiv. to 5,967 g·d.w./indiv. for high density and
Table 3. Phytomass of the reference plant on the planting pilot system
Division Species
Phytomass(g․d.w./indiv.)
Leaves Branches
& Stem Root Total Alnus firma 25.0±2.3 24.8±4.9 13.0±2.6 62.8±3.8 Alnus hirsuta 32.9±3.6 31.8±1.5 20.3±2.0 84.9±7.1 Pinus thunbergii 133.7±11.7 206.5±8.6 53.2±2.8 393.5±5.0 Pyracantha angustifolia 12.7±2.7 39.3±1.0 11.0±1.1 63.0±2.9
Table 4. Components of the phytomass in g dry weight per indi- vidual of planting density based on the planting pilot system
Density Species Plant parts
Alnus firma
Alnus hirsuta
Pinus thunbergii
Pyracantha angustifolia
High
Reproductives 311±30 160±14 261±274 16±4 Leaves 786±15 1,241±72 955±368 83±15 Branches 921±131 1,731±97 604±266 164±43 Stem 2,818±272 5,620±203 868±159 121±9 Main root 680±143 1,221±69 178±64 33±2 Coarse roots 295±51 502±55 84±17 11±4 Fine roots 156±22 184±17 68±10 35±16
Low
Reproductives 813±168 210±10 255±148 21±7.5 Leaves 1,601±25 2,691±37 1,370±428 170±29.0 Branches 1,927±257 4,931±52 1,175±512 340±73.5 Stem 5,516±191 7,700±63 1,370±255 263±9.4 Main root 1,716±145 2,280±44 361±130 81±15.5 Coarse roots 542±72 819±15 296±72 56±7.7
Fine roots 282±5 277±5 99±30 58±10.5
Figure 8. Comparison of four species with two different densities on the planting pilot system.
Legend: high density, low density a: Aboveground
b: Belowground
c: Total phytomass
197 folds from 63 g·d.w./indiv. to 12,397 g·d.w./indiv. for low density. After 4 years, in case of A. hirsuta, total phytomass
increased 125 folds from 85 g·d.w./indiv. to 10,659 g·d.w./
indiv. for high density, and 222 folds from 85 g·d.w./indiv. to 18,908 g·d.w./indiv. for low density. In case of P. thunbergii, total phytomass increased 8 folds from 395 g·d.w./indiv. to 3,018 g·d.w./indiv. for high density. and 13 folds from 395 g·d.w./indiv. to 4,926 g·d.w./indiv. for low density. P. an- gustifolia, increased 7 folds from 63 g·d.w./indiv. to 463 g·d.w./indiv. for high density and 16 folds from 63 g·d.w./
indiv. to 989 g·d.w./indiv. for low density. Generally, phyto- mass of the four species was 2 folds than that for high den- sity(Table 5 and Figure 8). After 4 years, relative growth rates of A. firma, A. hirsuta, P. thunbergii, and P. angus- tifolia was 1,476, 2,643, 656, and 100 g·d.w./indiv./year, res- pectively for high density. And those in low density were 3,033, 4,775, 1,133, and 231 g·d.w./indiv./year, respectively.
Yield of phytomass per individual the growth of Alnus species in the high density was greater than that of in low density planting. However, the growth per unit area have no difference in the two densities-dependent planting. The ratio of belowground to aboveground were 0.21~0.26(Table 5).
Thus, it concluded that the Alnus species are the potential candidates for landscape tree species in reclaimed dredging area. After 4 years, production efficiencies(relative growth rate/leaf weight) of A. firma, A. hirsuta, P. thunbergii, and P. angustifolia were 1.88, 2.13, 0.68, and 1.20, respectively for high density and were 1.89, 1.77, 0.82, and 1.25 respectively for low density. Generally, production efficiencies of temperate zone were 2.13~7.58 for deciduous fores, and 1.72~5.84 for coniferous forest(Kwak, 1993). In this study, the data were lower than those of other temperate forests. It is recognized that the trees used in this study were in young developing stage and will increase more in the future. Phytomass per unit area decreased by following order; A. hirsuta, A. firma, P. thunbergii, and P. angustifolia(Figure 10). Total phyto- mass per each tested plant was 2 times greater at low den- sity area than high density. However, total phytomass per unit area was similar or a little greater at high density com- pared to those at low density planting area. Phytomass pro- duction and uptake are linked through the concentration of nutrients in the phytomass produced, and pattern of allocation vary with species and stage of growth(Kwak and Kim, 1994).
It was clear that trees at low density took more advantage in
nutrient absorption than those at high density such as species do
Table 5. The ratio of below to aboveground per plant planting condition based
Species
Division Alnus
firma
Alnus hirsuta
Pinus thunbergii
Pyracantha angustifolia
High density
Aboveground
(A) 4,836±357 8,752±386 2,688±1,035 385±53 Belowground
(B) 1,131±216 1,907±141 330±91 80±22
Ratio(B/A) 0.234 0.218 0.123 0.208
Low density
Aboveground
(A) 9,857±954 15,532±639 4,170±1,166 794±80 Belowground
(B) 2,540±221 3,376±64 755±233 195±32
Ratio(B/A) 0.258 0.217 0.181 0.246
Figure 9. Photographs of actinorhizal root-nodule of Alnus species on the planting pilot system.
A
a: Alnus hirsuta
B
b: Alnus firma
500㎛
c: Zoom to A
500㎛
d: Zoom to B
Figure 10. Phytomass in ton dry weight per ha with two different densities on the planting pilot system.
Legend: high density, low density
replace each other along resource availability gradients(Miller and Donahue, 1990).
Ⅳ. Conclusion
To investigate the possible use of plants on reclaimed soil, a pilot system experiment was performed in the reclaimed dredging area with four species. Alnus firma, Alnus hirsuta, Pinus thunbergii, and Pyrachantha angustifolia for 4 years.
Plant height growth was greater at low density than the growth at high density. The phytomass after 4 years was greater for low density than that for density. It was clear that the trees at low density took an advantage in resource utilization than the trees at high density. Thus, the trees at low density gained more dry matter and allocation into plant parts in dredging reclaimed area. Total phytomass per each tested plant was 2 times greater for low density than that for high density. However, total phytomass per unit area was similar or a little greater for high density planting area com- pared to that for low density. Among the tested plants, Alnus species showed the highest phytomass, indicating that A.
hirsuta adapted very well at reclaimed dredging area and hold capability of fast growing, nitrogen fixation tree, and utilized insoluble nutrients using inoculated root nodule bacteria. This research demonstrated a baseline data for applying landscape tree species to reclaimed dredging area. Additional research are required for more landscape tree species in reclaimed dre- dging area.
References
1. Allen, M. F.(1998) The Ecology of Mycorrhizae. New York, Cam- bridge University Press.
2. Khade, S. W. and A. Adgoleya(2007) Feasible bioremediation through
arbuscular mycorrhizal fungi imparting heavy metal tolerance: A re- trospective. Bioremediation Journal 1.
3. Kim, D. G. and Y. S. Kwak(2004) Growth characteristics of Pinus thunbergii after replanting in reclaimed from the sea. -on the spatial distribution of fine root phytomass-. J. Korean Institute of Landscape Architecture 31(6): 77-84.
4. Kwak, Y. S.(1993) Productivity of plant communities and grouping of calcicoles and calcifuges in Tanyang limestone area. S.N.U. Ph. D.
thesis.
5. Kwak, Y. S. and J. H. Kim(1994) Spatial distribution of fine roots in Quercus mongolica and Q. acutissima stands. Korean J. Ecol. 17(2):
113-119.
6. Kwak, Y. S., Y. K. Hur, J. H. Song and J. K. Hwangbo(2004) Quantification of atmospheric capacity by afforestation impact assess- ment of Gwangyang steel work. J. of RIST 18(4): 334-340.
7. Miller, R. W. and R. L. Donahue(1990) Soils: An Introduction to Soils and Plant Growth. (6 eds.). Prentice-Hall.
8. Min, B. M. and J. H. Kim(1999) Plant community structure in re- claimed land on the west coast of Korea. Journal of Plant Biology 42(4): 287-293.
9. Ministry of Environment(2005) Standard Method of Soil Analysis.
10. Nam, W.(2008) A study on the characteristics of plant communities in reclaimed dredging area and their ecological applications. Sunchon National Univ. Ph.D. thesis.
11. Nam, W., Y. S. Kwak, I. H. Jeong, D. B. Lee and S. S. Lee(2008a) Physicochemical properties of depth-based soil on the reclaimed dredging area. J. Korean Env. & Reveg. Tech. 11(5): 60-71.
12. Nam, W., Y. S. Kwak, I. H. Jeong, D. B. Lee and S. S. Lee(2008b) Plant distributions and physicochemical characteristics of topsoil on the reclaimed dredging area. J. of the Korean Institute of Landscape Architecture 36(3): 52-62.
13. Ranwell, D. S.(1972) Ecology of Salt Marshes and Sand Dunes. Chap- man & Hall, London.
14. Sally, T. and J. B. Zedler(2000) Site conditions, not parental pheno- type, determine the height of Spartina foliosa. Estuaries 23(4): 572- 582.
15. Silvestri, S., D. Andrea and M. Marco(2005) Tidal regime, Salinity and salt.
16. Waisel, Y., A. Eshel and U. Kafkafi(1991) Plant Roots-The Hidden Half-. Marcel Dekker, Inc. New York.
17. Whittaker, R. H. and P. L. Marks(1975) Methods of assessing terrestrial productivity. pp. 55-118. In Primary Production of the Biosphere(ed.). Lieth, H. and R. H. Wittaker. Springer, Berlin. p. 267.
18. Wright, W., A. Fitter and A. A. Meharg(2000) Reproductive biomass in Holcus lonatus dones that differ in their phosphate uptake kinetics and mycorrhizal colonization. Plant Soil 146: 493-501.
원 고 접 수 일
심 사 일
게 재 확 정 일
3 인 익 명 심 사 필 : : :
2 0 0 9 년 4 월 1 5 일 2 0 0 9 년 5 월 2 9 일 2 0 0 9 년 6 월 5 일