Land Cover Change: A Regional Context, Asia, 1983~1994
Jeong-Chang Seong
1토지피복 변화: 1983~1994 아시아 지역의 특징
성 정 창
1ABSTRACT
Using monthly AVHRR-NDVI composite images, global vector data and statistical information, land cover change patterns in Asia during the major growing season (June, July and August) were analyzed for each country. Specifically, explanations on NDVI changes were developed at a regional scale emphasizing human impacts on ground vegetation. The annual mean change in each country showed NDVI-gain trends in high latitude areas and some parts of eastern China and northern/western India.
On the contrary, NDVI-loss trends were distinctive in Japan, Korea, some parts of southeastern China, Vietnam, Laos, Cambodia, Thailand, Myanmar and some parts in southwestern/eastern India. These patterns largely coincided with socio-economic information reflected by human behavior.
The NDVI change trends showed significant correlation with forest area changes. Also, a multiple regression model showed that the NDVI change patterns were significantly dependent on the changes in forest area and total population.
KEYWORDS: Asia, Land Cover, Global Change, NDVI, Human Effects
요 약
이 연구에서는 월별 AVHRR-NDVI 합성자료와 벡터 자료와 통계 자료를 이용하여 아시아 지 역의 각 국가별 토지피복 변화패턴을 분석하였다. 특히, 지표 식물에 대한 인간의 영향에 중점을 두고 NDVI의 변화를 분석하였다. 각 국가별 연평균 변화를 고찰한 결과, 고위도 지역과 중국 동부 의 일부 지역과 북서 인도지역에서 NDVI의 증가 경향이 나타났다. NDVI의 감소 경향은 일본과 한국과 중국 동남부의 일부지역과 베트남과 라오스와 캄보디아와 태국과 미얀마와 인도 남서 및 동부의 일부 지역에서 나타났다. 이러한 토지피복 변화 패턴은 인간의 활동을 반영하는 사회경제 적 지표들과 크게 일치하였으며, NDVI의 변화 추세는 삼림지역 변화추세와 매우 높은 상관관계를 보였다. 또한, 다중회귀분석 결과 NDVI 변화는 삼림지역의 변화와 인구변화에 민감함을 보였다.
주요어: 아시아, 토지피복, 지구변화, NDVI, 인위적 효과
2000년 8월 10일 접수 Received on August 10. 2000
1 Department of Geography, Northern Michigan University, Marquette, Michigan, USA ([email protected])
LAND COVER CHANGE: A CONCEPTUAL FRAMEWORK
The degradation of the global land cover and the profound impacts on the global environment have brought increasing concerns on the dynamics of land cover change. Changes in land cover for agriculture, human settlements and other purposes are among the most pervasive dangers to the global environment, ecosystems, biogeochemical fluxes, climate and sustainability of global land systems (Townshend et al., 1991). In the last several decades, human population in Asia has grown so rapidly that the natural environment has undergone dramatic changes along with the increase of human-induced intervention. As a changing continent, Asia is the largest and most diverse continent in the world. It cover about 30 percent of the land area on the earth.
Asia holds about three-fifths of the world's population with an average annual birth rate of about 2 percent. East Asia is most densely populated, and accounts for more than two-thirds of the total Asian population.
According to Turner and Meyer(1994), land cover has been used by natural scientists to denote the quantity and type of earth surface as vegetation, etc. According to them, there are two types of land cover changes: conversion and modification. Conversion means a land cover change from one type to another and modification a change of condition within a category. Temporal and global behavior of land cover dynamics is known to be sensitive to factors, such as climate, land use pattern, agriculture, culture, energy consumption, population growth, industrialization, urbanization, natural disaster, etc. The factors are, in most cases,
intermingled and it is difficult to characterize the exact relationships among them. As Turner and Meyer(1994) indicate, land cover change is not merely the result of climate change or cutting forest, but also the reflection of human culture, way of life, agricultural pattern, and thoughts.
Didia(1997) has shown a strong correlation between deforestation and government type, democratic and non-democratic, indicating that government policies are main factors in land cover change. Furthermore, land cover change processes become even more complex when consideration is given to global or regional scales. Considering that the change of physical environment is largely related to human activities, recent research on global land cover change tends more to emphasize human impacts (IGBP, 1988; Meyer and Turner, 1994).
Traditionally, the Population, Affluence and Technology(PAT) model was broadly used for the explanation of land cover change(Ehrlich and Ehrlich, 1990). However, because of its simplicity and lack of consideration of physical factors, other models were suggested for the explanation of complex processes of land cover change. A global land cover change model(Rayner et al., 1994), for example, shows most comprehensively how human and physical components interact with each other. Emphasizing an interdisciplinary approach for global change study, the model discusses in depth how general human needs and wants are translated into land use changes. It addresses three kinds of analyses:
studies of social drivers, decision systems analysis, and biogeochemical assessments.
The three analyses are tailored to three
scales: global, regional and local. As social
drivers, the model emphasizes population and
human aspiration modules. The two social driver modules then affect the decision system modules which bring the change of land assessments. The land assessments finally affect global and regional biogeochemical cycles which in turn change human aspiration.
The model explains well how human population, aspiration and decision systems are interrelated to cause land use/cover changes. Also, it shows how natural factors such as climate work as global and regional components of biogeochemical parts. The model also summarizes very well human and natural impacts on global land cover change from a general perspective.
As another example of land cover change model, the Land-Cover and Land-Use Change (LCLUC) program which is an interdisciplinary scientific theme within the Mission to Planet Earth(MTPE) by the National Aeronautics and Space Agency(NASA) of the U.S.A. shows the internal processes of land-use/land-cover change(NASA LCLUC, no date). The model is based primarily on the use of remotely-sensed imagery which are the products of NASA's MTPE. NASA's model considers economic and climate drivers as major factors of the conversion or intensification of land use and land cover. It, however, tends to emphasize the detection and analysis of physical environmental factors such biogeochemical changes, atmospheric changes, gas fluxes, ecosystem function and water fluxes.
The two models described above explain well the interrelationships among human and physical factors. However, research bridging the physical components, especially remotely-sensed information, with socio-economic information is scarce. Considering the applicability of satellite
data for the description of regional land cover change, this research aims at characterizing land cover change using satellite data and investigating the relationships between the land cover change and the socio-economic data tailored by human behavior at a regional scale.
First of all, a conceptual framework will be introduced as an approach to the complex regional- environmental change problems.
After reviewing the major characteristics of the study area, a regional pattern of land cover change will be investigated for each country with growing-season satellite data. Based on the regional land cover change patterns and the socio-economic data, explanation of the regional context of land cover change will be developed. Finally, the relationships between the land cover change and the socio-economic variables will be investigated using correlation and multiple regression methods.
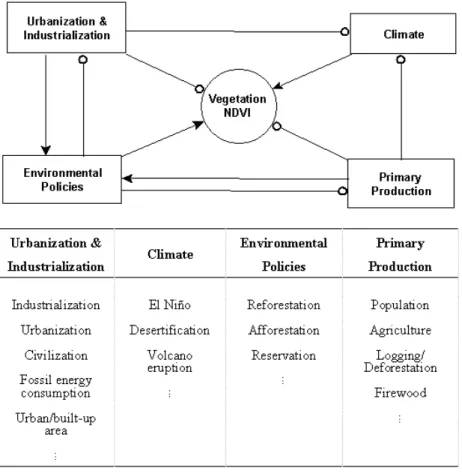
A conceptual framework of regional land
cover change(Figure 1) was designed considering
the use of multi-temporal satellite images in
relation to socio-economic data. The normalized
difference vegetation index(NDVI)(Holben,
1986) reflecting the greenness of a region was
chosen as a crucial status variable in the model
because the NDVI level is easily calculated from
most remotely-sensed images and strongly
relates to the condition of above ground
vegetation. The NDVI ranges from -1.0 to
+1.0. In densely forested regions, for example,
NDVI is high; however, NDVI may drop to
negative values in the large areas where little
vegetation exists, such as a desert. In relation
to the conceptual framework, four other
components, i.e. climate, primary production,
urbanization/industrialization, and environmental
policies were selected as major variables.
FIGURE 1. A conceptual framework of regional land cover change (The circled arrow denotes a negative relation which means the dependent variable decreases while the independent variable increases. The normal arrow means a positive relation, where the dependent variable increases as the independent variable increases.)
Climate covers the changes of temperature and precipitation, induced by such natural phenomena as the El Nin ~o Southern Oscillation and volcanic eruptions. Climate has positive relations to the NDVI, since NDVI increases when climatic conditions get better; however, NDVI decreases when climate becomes more hostile. Environmental policies have similar relationships with vegetation, because environmental policies act as a major regulating agent to the development of primary industries,
urbanization and industrialization. As hostile
components to vegetation, urbanization and
industrialization create negative effects on
climate and vegetation through such matters as
carbon, gas, aerosol, bio-geochemical flux
changes and water flux changes. Also, the
urbanization and industrialization components
have a negative relation with vegetation through
direct land conversion or transformation and
severe modifications. Alternatively, urbanization
and primary production components generate
concerns with environmental policies. Primary production components also cause negative effects on vegetation. Increase of population, agricultural fields, logging and deforestation may undermine vegetation through land conversion, specifically through logging and cultivation.
Because the components described in the conceptual framework are interrelated, this research specifically investigates the NDVI change tailored by four variables,
Δ( ndvi) = f{Δ( p),Δ( l),Δ( d),Δ( c) }
(1) where,
Δmeans average annual change rate, ndvi denotes land cover, p is population, l is land use, d is deforestation and c is culture.
Annual average changes of the total population and farmers are considered as the indices of population. For the land use change, changes of crop land and forest areas were selected. The amount of round wood production is used as an index to deforestation. As the indices of culture, the number of TV and radio and energy use are considered.
METHODOLOGY
This study focuses on the densely populated regions in Asia which cover most parts of South Asia, Southeast Asia and East Asia. South Asia comprises the states of Afghanistan, Pakistan, India, Nepal, Bhutan, Bangladesh, Myanmar and Sri Lanka. Afghanistan, Sri Lanka and Pakistan were excluded in this research because of limited data availability. Dominant features on the South Asian landscape are the Himalaya Mountains, the IndoGangetic Plain and the Deccan Plateau. Monsoonal winds play an important role in most South Asian ecosystems.
Each monsoon has two phases: the northeast monsoon(January to February, cold; March to June, hot) and the southwest monsoon(June to September rain; September through December, ebbing monsoonal rain). Southeast Asia comprises, Thailand, Cambodia, Laos, Vietnam, Singapore, Indonesia, Brunei, Malaysia, and the Philippines.
Among these, Singapore, Indonesia, Brunei, Malaysia, and the Philippines were excluded from this research because of significant effects of water causing the deterioration of coarse-resolution AVHRR-NDVI pixels. The region lies mostly between the Tropic of Cancer and the Equator, and is characterized largely by the humid tropics. Weather patterns in Southeast Asia are mostly characterized by the monsoons. Similar to the South Asia, the southwest monsoon(May to September) accounts for most of the annual precipitation. The northeast monsoon(November to March) is a relatively cool and dry period.
East Asia covers the area along the western Pacific Rim including Japan, Taiwan, North Korea, South Korea, China, and eastern Russia.
This region holds a huge population with high density. There are several megalopolises in East Asia such as Tokyo, Beijing and Seoul which have been experiencing very rapid economic development and industrialization. Like Southeast Asia, monsoon is dominant in this area (hot and wet summer; cold and dry winter).
The Pathfinder AVHRR 8km Land(PAL)
Data Sets(Agbu and James, 1994; James and
Kalluri, 1994) for 1982-1994 were used for land
cover characterization. Monthly maximum-value
composite images were created using the
original 10-day PAL data that were composited
from the 4 km Global Area Coverage(GAC) 1B
data. Growing season(June, July and August)
average NDVI values were calculated from three
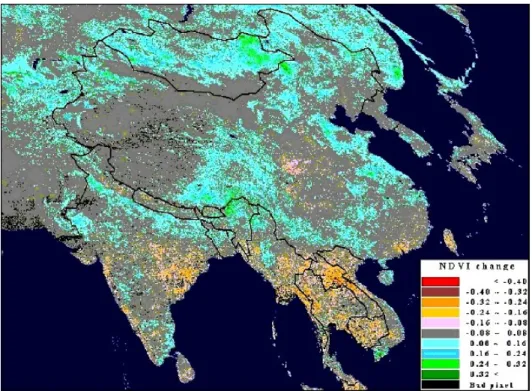
FIGURE 2. Interannual growing season(June, July and August) NDVI changes in Asia, 1983-1994 (The data for the years of 1982, 1989 and 1990 were not used for calculating the interannual growing season trends.)
monthly images and they were used for representative land cover for a year. A vector boundary layer from the Global Resource Information Database(GRID) for 1992 was re-projected to the Goode Homolosine projection (Steinwand, 1994) and overlaid on the AVHRR data to examine regional statistics. For China and India, the provincial boundaries were used to map spatial patterns, but they were statistically analyzed at the country level because of data availability. Even though a set of robust compositing algorithms were implemented to obtain the most accurate land cover information, annual average NDVI data for 1982, 1989 and 1990 showed systematic errors(Seong, 1998). Those three years of data, therefore, were excluded for calculating
growing season NDVI change trends. The regional NDVI change trend which was calculated using a linear regression method was mapped to show spatial patterns using the Jenks' natural-break classification algorithm (Jenks and Caspall, 1971; Figure 2). Heavy NDVI-loss trends are shown in most Southeast Asian countries, the southeastern part of China, Taiwan and some parts of India. Light NDVI-loss trends appear in Korea, Japan, Myanmar and some parts in China and India.
On the contrary, NDVI-gain trends are shown in some parts of India and China.
When the three-year average NDVI for
1983, 1984 and 1985 was subtracted from that
for 1992, 1993 and 1994, results showed a
continuous spatial pattern of land cover change
in detail. In Southeast Asia, almost all the countries showed serious NDVI losses. Almost all the countryside in Thailand showed general NDVI loss. Specifically, loss was distinctive along the Chao Phraya river. Slight loss was also seen at the mouth of the Chao Phraya River where Bangkok is located and at the southeastern border of Cambodia. In Laos, the situation is worse. The northern parts of the country showed significant losses. The highest loss occurred around Vientiane city. However, the southern parts of the country showed little change. Cambodia also showed countrywide losses along the Mekong River and around Phnum Penh City. Especially, the eastern part of the country appeared to experience severe loss. In Vietnam, there was a slight gain along the southern tip of the country below Ho Chi Minh City, but slight loss occurred in most of the highlands along the East China Sea. In Myanmar, there was a slight gain along the Irrawaddy River; but, there were significant losses around the mountain Victoria, Shan plateau, northwestern coast of the Malay Peninsula and Rangoon City. India showed significant loss along the southwestern coast and around the mid-eastern part of the country, specifically, the regions around Bombay city and Goa province. However, some places such as the region along the Ganges river and the southeastern tip of the country gained NDVI.
Taiwan showed high loss in almost all of the countryside. The loss occurred more severely in the western part of the island. In China, significant loss occurred around major cities, such as Chengdo, Chongqing, Xian, Guangzhou, and Liaoning. Slight gain was shown in some areas, such as southern part of Beijing and Tianjin, some parts of Jiangsu province, the
southwestern border to India, and the eastern border to Mongolia. In Mongolia, the overall area showed a slight gain. NDVI loss was difficult to find in Mongolia. In the western part, the gain was higher. In North Korea, most areas did not show much change. Slight losses occurred in South Korea and Japan around the major cities such as Seoul, Fukuoka, Osaka, Nagoya, Yokohama and Tokyo.
REGIONAL CONTEXT
Crucial processes of regional land cover change are difficult to determine, because many factors are intermingled. Based on the conceptual framework suggested in Figure 1, the underlying processes of the spatial patterns will be briefly examined with socio-economic information. Specifically, consideration will be given to the speculation on important internal factors which might bring land cover change in each country. The context which is explained here may not cover all the possible causes to land cover change in each country. However, NDVI change will be understood more clearly by examining the possible causes.
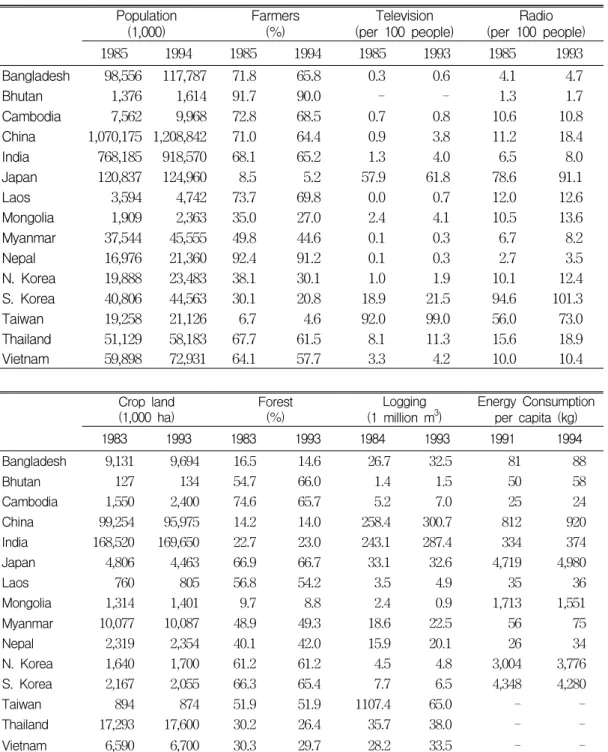
In Japan, Figure 2 shows a trend of slight decrease. This pattern appears due to the increase of absolute population, which inevitably causes urban sprawl around the major cities.
Table 1 shows that round wood production has
decreased a little, and the forest area depleted
by 0.3 percent. The percentage of farmers has
decreased by 3.3 percent, and 343,000 hectares
of arable and permanent crop land have been
converted to other purposes. These facts
strongly imply that the main reason for land
cover change is due to the expansion of urban area,
especially along the corridor of megalopolises at the
Crop land (1,000 ha)
Forest (%)
Logging (1 million m3)
Energy Consumption per capita (kg)
1983 1993 1983 1993 1984 1993 1991 1994
Bangladesh 9,131 9,694 16.5 14.6 26.7 32.5 81 88
Bhutan 127 134 54.7 66.0 1.4 1.5 50 58
Cambodia 1,550 2,400 74.6 65.7 5.2 7.0 25 24
China 99,254 95,975 14.2 14.0 258.4 300.7 812 920
India 168,520 169,650 22.7 23.0 243.1 287.4 334 374
Japan 4,806 4,463 66.9 66.7 33.1 32.6 4,719 4,980
Laos 760 805 56.8 54.2 3.5 4.9 35 36
Mongolia 1,314 1,401 9.7 8.8 2.4 0.9 1,713 1,551
Myanmar 10,077 10,087 48.9 49.3 18.6 22.5 56 75
Nepal 2,319 2,354 40.1 42.0 15.9 20.1 26 34
N. Korea 1,640 1,700 61.2 61.2 4.5 4.8 3,004 3,776
S. Korea 2,167 2,055 66.3 65.4 7.7 6.5 4,348 4,280
Taiwan 894 874 51.9 51.9 1107.4 65.0 - -
Thailand 17,293 17,600 30.2 26.4 35.7 38.0 - -
Vietnam 6,590 6,700 30.3 29.7 28.2 33.5 - -
* Logging in Taiwan was replaced by the saw timber production index which was calculated based on the production in 1991.
TABLE 1. Change of socio-economic environment in 15 Asian countries
(Sources: FAO, 1994; ROC, 1996; UN, 1996) Population
(1,000)
Farmers (%)
Television (per 100 people)
Radio (per 100 people)
1985 1994 1985 1994 1985 1993 1985 1993
Bangladesh 98,556 117,787 71.8 65.8 0.3 0.6 4.1 4.7
Bhutan 1,376 1,614 91.7 90.0 - - 1.3 1.7
Cambodia 7,562 9,968 72.8 68.5 0.7 0.8 10.6 10.8
China 1,070,175 1,208,842 71.0 64.4 0.9 3.8 11.2 18.4
India 768,185 918,570 68.1 65.2 1.3 4.0 6.5 8.0
Japan 120,837 124,960 8.5 5.2 57.9 61.8 78.6 91.1
Laos 3,594 4,742 73.7 69.8 0.0 0.7 12.0 12.6
Mongolia 1,909 2,363 35.0 27.0 2.4 4.1 10.5 13.6
Myanmar 37,544 45,555 49.8 44.6 0.1 0.3 6.7 8.2
Nepal 16,976 21,360 92.4 91.2 0.1 0.3 2.7 3.5
N. Korea 19,888 23,483 38.1 30.1 1.0 1.9 10.1 12.4
S. Korea 40,806 44,563 30.1 20.8 18.9 21.5 94.6 101.3
Taiwan 19,258 21,126 6.7 4.6 92.0 99.0 56.0 73.0
Thailand 51,129 58,183 67.7 61.5 8.1 11.3 15.6 18.9
Vietnam 59,898 72,931 64.1 57.7 3.3 4.2 10.0 10.4
southern parts of Japanese islands.
In South Korea, the NDVI change pattern is very similar to Japan with a slight decrease.
Korea has experienced dramatic urbanization during the 1980's which significantly altered the land cover. The forest has decreased by 0.9 percent and round wood production by 1.2 percent. Rapid urbanization also brought a significant 9.3 percent decrease of farmers.
These facts suggest enlargement of urban areas has been a major land cover change source.
Japan and South Korea show significant use of mass media and energy.
Like South Korea, North Korea has experienced significant migration to urban areas since the Korean War. Table 1 shows farmers have decreased 8.0 percent during the period.
Lack of reliable data sources makes it hard to determine plausible causes of land cover change in North Korea. The statistics in Table 1 and the average NDVI change results suggest there has been little change in North Korea. This is considered as the result of the extensive control by communist government and the national Seven-Year Plan's starting from 1961.
In China, there has been a population growth of 0.2 billion during the last decade.
Table 1 shows the percentage of farmers decreased from 71 percent in 1985 to 64 percent in 1994. Arable land has decreased and round wood production increased.
However, the average NDVI change shows there has been some gain during the last decade. These facts may imply rapid growth of urban areas, land cover conversion and intensive logging in some regions, but general gain in large rural areas, which appears in Figure 2. The massive afforestation project, called as Great Green Wall(Bradshaw, 1997)
could be considered as one possible cause of the NDVI gain trend around the Hebei area.
However, its contribution is not yet clear.
In Taiwan, it is difficult to induce the causes of dispersed heavy NDVI loss around the country. Table 1 shows little change in forest area and a dramatic decrease of round wood production. The table also shows a slight decrease of cultivated land area.
According to the changes of population and percent of farmers, the dispersed NDVI loss in Taiwan is considered as the result of urbanization and its impacts on the surrounding areas of major cities. In Taipei, population increase has stopped since 1990 and the total population has been decreasing.
Also, population is decreasing in major cities such as Panchiao, Sanchung, Yungho and Chungho since early 90s. However, most of small cities, especially those with population less than 300,000, have experienced dramatic increases in population(ROC, 1996). These facts suggest that the urbanization in small cities and its impacts on the surrounding areas could be the major cause of dispersed NDVI loss across the country.
Most Southeast Asian countries show serious land cover change during the last decade. The massive NDVI loss trend in Laos is the worst case in Asia. Laos lost about 2.6 percent of forest area and round wood production increased a little. Still, many people are farmers in Laos, and arable land has increased to 6.4 percent. Cultural factors such as mass media and energy consumption do not show much change.
These facts do not precisely imply what has
happened in Laos, but the change of logging
and forest area implies why this heavy loss
of NDVI was possible. Most people in Laos are living in rural areas where towns are primarily administrative and market centers without many industrial manufacturing facilities(LOC, 1994). Traditionally, villages have relied on forest products as a food reserve during years of poor rice harvest and as a regular source of fruits and vegetables.
In the 1950s, forests covered 70 percent of the land area; by 1993, forest coverage had decreased to just 54 percent of total land area. In 1991 a new decree banned all logging until further notice. However, there was little practical impact, and illegal logging remains widespread(LOC, 1994).
These facts suggest that the land cover change process in Laos is more related to the depletion of forest for economic purposes.
In Cambodia, a similar pattern happens.
Huge forest areas(8.84 percent) have been converted to other purposes, and Table 1 suggests that the conversion was from forest to arable and permanent crop land. This fact is also shown in the First Five-Year Program of Socioeconomic Restoration and Development (1986-1990), or First Plan, originated in February 1984 and presented by Heng Samrin to the Congress. The plan gave the highest priority to agricultural production, calling it the ‘first front line', and focused on the four sectors of food, rubber, fishing, and timber.
This Cambodian example shows land cover has changed not only for economical purposes from logging but also for agricultural self-sufficiency.
Myanmar, Thailand and Vietnam show similar patterns. Round wood logging has increased during the last decade and the decreased forest area has been converted to
urban, arable and permanent crop lands. These processes seem inevitable to cause the loss of mean NDVI. The losses in Thailand and Vietnam are greater than in Myanmar. This may be attributed to small forest sizes in those countries, which are less than half of the forest area in Myanmar. These facts imply an economic motive of self-sufficiency for food and logging is a very important factor. In Vietnam, for example, more importance was given to increasing agricultural products. This was shown in the economic objectives of the Fourth Five-Year Plan(1986-1990) which were to increase production of food, consumer goods, and export goods. In the plan, primary importance was given to increasing food production, so that grain production was targeted to reach 22 to 23 million tons annually by 1990, and rice production was planned to total 19 to 20 million tons annually(LOC, 1994). India shows slight gain of average NDVI during the decade, even though round wood production increased to 18.3 percent. Table 1 also shows that the forest, arable and permanent crop land areas have increased a little. Also, the change of percentage of farmers indicates there has been less severe urbanization than in China. Energy consumption and use of television and radio show India is still one of poorest countries mainly depending on a rural life style. Increase of NDVI regardless of the increase of logging seems to result from the Forest Conservation Act that has been in effect since 1980. The primary purpose of the Act has been to prevent the indiscriminate diversion of forest lands for non-forest purposes.
Under the provisions of this Act, prior approval
of the Central Government is required to convert
forest to other uses. The permission is very hard
to get and, even though one gets permission, it
usually carries stipulations for compensatory
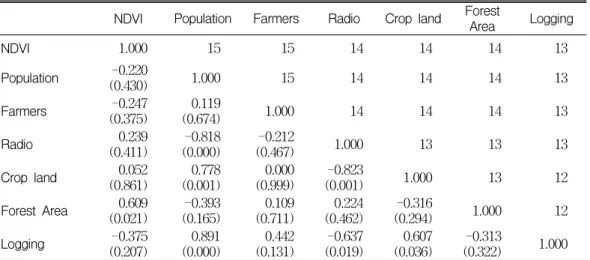
TABLE 2. Pearson correlation coefficients
NDVI Population Farmers Radio Crop land Forest
Area Logging
NDVI 1.000 15 15 14 14 14 13
Population -0.220
(0.430) 1.000 15 14 14 14 13
Farmers -0.247
(0.375)
0.119
(0.674) 1.000 14 14 14 13
Radio 0.239
(0.411)
-0.818 (0.000)
-0.212
(0.467) 1.000 13 13 13
Crop land 0.052
(0.861)
0.778 (0.001)
0.000 (0.999)
-0.823
(0.001) 1.000 13 12
Forest Area 0.609 (0.021)
-0.393 (0.165)
0.109 (0.711)
0.224 (0.462)
-0.316
(0.294) 1.000 12
Logging -0.375
(0.207)
0.891 (0.000)
0.442 (0.131)
-0.637 (0.019)
0.607 (0.036)
-0.313
(0.322) 1.000
*All variables are in the percent of mean annual change, 1983-1994.
*Two-tailed significance levels are in parenthesis.
*The numbers at the upper right part from the diagonal denote the number of cases used.
afforestation(MoEF, no date). In this example, the gain of NDVI might be explained in terms of a strong regulation policy and a relatively slow process of urbanization to some degree.
Bangladesh also shows slight loss of NDVI.
Forest areas show slight losses of 1.85 percent.
The figure has a significant meaning considering the small forest area(around 15 percent) compared with other countries. Round wood logging has increased, and 6 percent of the people have left their farms. Energy consumption and mass media use have not changed dramatically during the decade. Arable and permanent crop lands have increased slightly.
As indicated in the Five-Year Plans started since 1973, one of the main goals of the Bangladesh government has been to reduce poverty through attaining self-sufficiency in food production. These series of facts strongly support the NDVI loss trend.
Mongolia shows a dramatic increase of NDVI.
The forest area, however, has decreased and
round wood logging decreased also. What is peculiar in Mongolia is the increase of arable and crop land area, almost 6.6 percent during 1983-1993. The gain of NDVI appears to result from two reasons, a decrease of logging and a conversion of steppe grass lands. Table 1 shows round wood production has decreased dramatically since 1991(UN, 1996). Nepal and Bhutan do not show much change in their socio-economic statistics. The percentages of farmers are almost the same as those of 11 years before, and slight increases of round wood production, energy use, and arable land area occur.
RELATIONSHIP BETWEEN LAND COVER CHANGE AND SOCIO-ECONOMIC VARIABLES
Because the NDVI change trends showed
meaningful relationships from the former
section, the relationship between the NDVI
change and the socio-economic variables were
examined using the correlation and multiple regression methods. The percentage of annual mean change was calculated for the variables, total population, percent of farmers, number of radio per capita, arable and permanent crop land area, forest area and round wood production. The number of TV and the energy use variables were not included for the analysis because they showed high positive relationship with the radio variable. Results of estimated relationships using the annual mean change data are listed in Table 2.
Some outliers were excluded after examining scatter plots. For example, the very low annual change of logging(-6.94 percent) in Mongolia was excluded because it caused significant bias.
With the same reason, the increasing trends of forest in Bhutan, crop land in Cambodia and radio in Japan were excluded. In addition, the logging data for Taiwan were not used because of the categorical disparity of the data source.
Table 2 shows expected relationships described in the conceptual framework(Figure 1).
It shows that NDVI change has negative relationships with the changes of population, farmers and logging with low levels of statistical significance. Other variables, the changes of radio, crop land and forest area, have positive relationships with NDVI. Especially, the change of forest area is most highly correlated with NDVI change(significant at 95 percent confidence level). The strong relationship suggests the NDVI variable can be used for an index to describe the status of forest area change which is one of the pervasive consequences of global environmental change. Five other strong relationships are shown, i.e. population to radio, crop land and logging, radio to crop land, and logging to crop land. Annual percent change of farmers doesn't
show any significant relationship with other variables. The change of NDVI shows the highest sensitivity to the changes of forest area and logging, but low sensitivity to the changes of crop land, population, radio and farmers.
In order to investigate a combined causal relationship to the NDVI change, a multiple regression model was solved. The result of estimated model is shown in Equation 2. The regression results suggest that NDVI change is sensitive to the changes of forest area and population, and the model estimation is statistically significant. It is interesting to see the role of the population change variable in the regression model. While the population change did not have significant correlation with the NDVI change from the Pearson's correlation analysis, it shows meaningful contribution to the explanation of the variance of NDVI change in the multiple regression model. This is quite logical since the population variable has very high correlations with radio, crop land and logging(see the correlation matrix in Table 2), so that the population variable can work for a common component representing the correlated variables. Like the results of correlations, multiple regression analysis shows a positive relationship with forest area and a negative relationship with population. Considering the sensitivity of the variables, the NDVI change is the most sensitive to the forest area change, which is three times more sensitive than the population change.
: t-test significance level of variables
Δ