Korean J Environ Agric (2011) Online ISSN: 2233-4173
Vol. 30, No. 1, pp. 1-8 DOI : 10.5338/KJEA.2011.30.1.1 Print ISSN: 1225-3537
Nitrogen and Phosphorus Content Changes in Paddy Soil and Water As Affected by Organic Fertilizer Application
Kyung‐Do Lee,
1*Kyeong‐Bo Lee,
1Geun‐Hwan Gil,
2Inhong Song,
3Jong‐Gook Kang
1and Seon‐Woong Hwang
11Department of rice and winter cereal crop, NICS, RDA, Iksan 570‐080, Korea
2Department of crop life safety, NAAS, RDA, Suwon 441‐857, Korea
3Research Institute for Agriculture and Life Sciences, Seoul National University, Seoul 151‐742, Korea Received: 7 October 2010 / Accepted: 10 March 2011
ⓒThe Korean Society of Environmental Agriculture
*교신저자(Corresponding author):
Tel: +82‐63‐840‐2280 Fax:+82‐63‐840‐2118 E‐mail: [email protected]
1
Abstract
BACKGROUND: With increasing public awareness to environment‐friendly agriculture, many efforts have been run to develop organic farming technologies in Korea as of late 90s. The objective of this study was to investigate the effects of different organic farming practices on soil chemical properties and water quality in paddy fields.
METHODS AND RESULTS: Total nitrogen (TN) and total phosphorus (TP) were monitored for a two‐year period (2006 to 2007) from the study organic paddy fields located in Wan‐ju, Jeonbuk Province in Korea. TN and TP of organic paddy water were gradually increased for 2~3 weeks after organic manure application and then gra- dually decreased afterward. The overall variation of TP in the paddy fields was much greater than that of TN.
The phosphorus content in organic paddy field appeared to increase with the organic farming period.
CONCLUSION(s): This indicates that long‐term organic farming is likely to cause phosphorus accumulation in soils and increase vulnerability to rainfall runoff. Thus, appropriate phosphorus management needs to be imple- mented, particularly, to reduce excessive phosphorus supply owing to nitrogen‐based determination of organic manure application amount.
Key Words: Organic farming, Paddy fields, TN, TP, Nonpoint source pollution
Introduction
As environmental friendly agriculture has gained more public attentions in Korea, increasing investment has been made to convert the conventional high input (high rate application of fertilizer and pesticides) agri- cultural practices for the agricultural productivity to environmentally sustainable ones.
Between 2000 and 2005, the number of farmers who adopted environment‐friendly agricultural practices has been increased about 25 times from 2,000 to 53,000 (MAF, 2006). Subsequently, organic farming area has also enlarged about 24 times from 2,000 ha in 2000 to 50,000 ha in 2005. The fraction of environment‐friend- ly agricultural product sold in the market has grown from 0.4 to 4.0% (about 19 times increase). There has been increasing efforts of the Korean government to encourage environment‐friendly agriculture and scale up the size from a village level to the broad complex within a city or large water basins.
However, there is little information regarding the effect of organic farming on the changes of soil and water qualities. The objective of this study is to inves- tigate the changes of the chemical properties of pad- dy soil and stream sediments as affected by organic farming practices through monitoring TN and TP con-
Open Access
Research Article
Site Weed control method
Fertilizer type
before 2006 2007
OF1 Rice‐duck farming for 14 years Rice‐duck farming ‐ Livestock manure OF2 Rice‐duck farming for 3 years Rice‐pond snail farming Rice‐pond snail farming Livestock manure, milk vetch, oil‐cake OF3 Rice‐duck farming for 3 years Rice‐duck farming Rice‐pond snail farming Livestock manure
milk vetch, oil‐cake OF4 Rice‐duck farming for 6 years Rice‐duck farming Rice‐duck farming Livestock manure Table 1. Cultivation methods of the study organic farming area
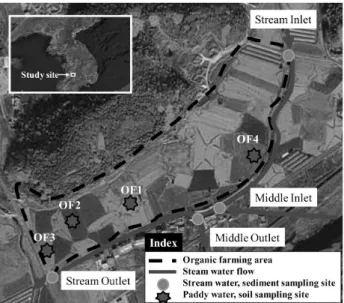
Fig. 1. Location of the study organic farm and sampling sites.
centrations in paddy and stream water.
Materials and Methods
Farming practices
The study site was located at Wanju‐gun, Jeollabuk
‐do Province in Korea (Fig. 1). Organic rice farming practices included rice‐duck farming (5.9 ha), rice‐
pond snail farming (1.8 ha), and other organic farming practices for weed control (1.4 ha) (Gil et al ., 2008).
The sites have been under organic farming practices for 4‐15 years. Depending on the length and type of organic farming practices, four different organic farms were selected including 15 years rice‐duck farming (OF1), 3 years rice‐duck farming followed by 2 years rice‐pond snail farming (OF2), and 4 years rice‐duck farming followed by 1 year rice‐pond snail farming (OF3), and 6 years rice‐duck farming (OF4) (Table 1).
The OF1 treatment was investigated only in 2006 be- cause of the site incorporation into a rice processing plant.
The OF1 site was fertilized once a year with live- stock manure as basal fertilizer for 15 years. The live- stock manure was applied at the rate of N‐P
2O
5, 8.8‐
12.5 kg/10a. The OF2 and OF3 sites were fertilized twice a year. Chinese milk vetch ( Astragalus sinicus L.) was sown at the sites and used as the green manure.
Livestock manure was applied as basal fertilized when the sites with grown milk vetch was plowed. Then oil
‐cake was applied at the panicle initiation stage. About 17 to 23 duck heads per 10 a dwelled in the rice‐duck farming sites of OF1 and OF3. According to Isobe et al . (2005), the duck excretion is equivalent to 0.15‐0.35, 0.21‐0.49 kg/10a in N and P
2O
5, respectively, which is minimal contribution to the farm nutrient supply. In other words, majority of nutrients was supplied as or- ganic sources of the livestock manure, Chinese milk vetch, and oil cake. Water resources used for irriga-
tion included a nearby small stream of the Mankyeong river and groundwater in complex.
Sampling and analysis
The soil of the organic farms was classified as Seok-
cheon series, which is silty loam. The paddy soil sam-
ples were collected from the study sites after harvest
in 2006. Stream sediments were also collected from the
upstream inlet, middle inlet, middle outlet, and downs-
tream outlet in Jan, Apr, Jun, Aug, and Dec in 2007
(Fig. 1). These soil samples were wind dried and sieved
through a 2 mm mesh grid before soil chemical anal-
ysis following the protocol provided by the National
Institute of Agricultural Science and Technology (NIAST,
1988). Available P of soil and stream sediment sam-
ples was measured by Lancater method. Each form of
inorganic P in the soil and stream sediment samples
was determined by the ascorbic acid method as de-
scribed by Zhang and Kova (2004).
2006 year
pH (1:5)
EC (dS/m)
TN (g/kg)
OM (g/kg)
Avail. P (mg P2O5/kg)
OF1 5.9 0.27 2.52 28.1 477
OF2 6.0 0.30 2.51 35.9 258
OF3 5.9 0.27 2.41 27.1 328
2007 Year
pH (1:5)
EC (dS/m)
TN (g/kg)
OM (g/kg)
Avail. P (mg P2O5/kg)
OF2 5.9 0.29 3.27 36.9 259
OF3 5.9 0.45 2.64 31.7 272
OF4 5.8 0.28 1.79 28.2 258
National Average* 5.8 ‐ ‐ 24.0 132
*RDA (2007)
Table 2. Soil chemical properties of the study paddy fields
Fig. 2. Fractionation of inorganic phosphorus in organic paddy farm soil (unit: mg P/kg).
Paddy water samples from the selected fields were collected once a week during the rice growing seasons and analyzed for the TN and TP concentrations from 2006 to 2007. The inflow and outflow water samples of the study site were collected from the same loca- tions where sediment soil samples were taken. Water quality analyses followed the APHA (1992) methods.
Results and Discussion
Soil chemical properties
Table 2 summarized the soil properties of the study sites. The organic matter (OM), and P concentrations were higher in OF fields than national average values (RDA, 2007). Fertilization amount for the organic farms were determined based on the crop N requirement and thus excessive amount of P might have accumu- lated in the soils and resulted in higher P concentra- tions in the organic farming fields (Jin and Yoo, 1999).
According to Chung and Hong (1977) and Jung et al . (2003), accumulation of P in paddy soils may be small- er than in plastic film house, however, the reduced environment of paddy field due to flooding may in- crease P availability substantially. Thus P attached to the suspended matter became susceptible to paddy runoff with rainfall events increasing P loading to the surface water bodies. Shin et al . (1988) reported that P in paddy soils may begin dissolving into water when soil P concentration is greater than 232 mg P
2O
5/kg.
In this study, the P concentrations for all the organic farming soils appeared to exceed this concentration.
Figure 2 shows concentration changes for each phase of phosphorus in paddy soils. The mean TP concen-
trations of OF1, OF2, and OF3 soils were 1110, 776, and 811 mg/kg, respectively. OF1 of which organic farming period was 15 years showed much greater P content compared to those of the other two sites of five years organic farming. This indicates that P may accumulate in paddy soils with longer organic farm- ing practices.
The inorganic P concentration of organic farm soil was higher in the order of Fe‐P (317~445 mg/kg), re- sidual‐P (256~402 mg/kg), Al‐P (123~194 mg/kg), Ca‐
P (51~61 mg/kg), and soluble and loosely bound P (2.2~2.8 mg/kg). The greatest Fe‐P content was con- sistent with the previous study by Chang and Chu (1961). This study has reported that Al‐P content is greater than Fe‐P at the fertilization and then tends to decrease while Fe‐P content increases with time.
A reduced condition when paddy field is flooded
renders P combined with Fe readily soluble and thus
increases dissolved P content in paddy water (Nriagu,
Sample locations
pH (1:5 H2O)
EC (dS/m)
TN (g/kg)
OM (g/kg)
Avail. P (mg P2O5/kg)
Avg Max Min Avg Max Min Avg Max Min Avg Max Min Avg Max Min
Stream inlet 6.8 7.3 6.6 0.30 0.43 0.16 1.0 1.7 0.6 15.9 29.8 6.4 49 73 28 Middle inlet 6.7 7.2 6.4 0.18 0.28 0.10 1.0 1.8 0.3 18.9 29.4 6.3 100 114 87 Middle outlet 7.3 7.4 7.2 0.10 0.20 0.05 0.6 1.0 0.2 9.5 16.8 2.8 46 56 40 Stream outlet 6.5 7.0 6.2 0.38 0.62 0.24 2.0 2.2 1.4 33.9 39.9 29.2 174 222 146 Table 3. Chemical properties of sediments in the stream inlets and outlets
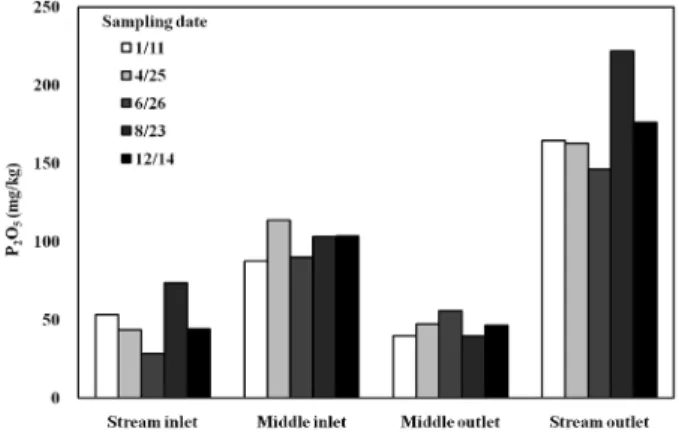
Fig. 3. Seasonal change of available phosphorus content in sediment.
1972). Thus Fe‐P increase in paddy soils due to long‐
term livestock manure application may elevate P con- tent in paddy water.
A substantial amount of accumulated P seemed to exist as residual‐P, which is the amount of TP sub- tracted by inorganic P (Jun and Park, 1989). The re- sidual‐P for the organic farm soils varied from 256 to 402 mg/kg. The accumulated residual‐P over long‐
term application of the applied livestock compost and organic fertilizer seemed to serve as P source to sup- ply inorganic P for paddy water through a time‐rated mineralization process.
Stream sediment chemical properties
Sediment runoff from agricultural fields can affect water quality as well as aquatic ecosystems through attached nutrient dissolution by various processes of decomposition, diffusion, re‐suspension, and biological disturbance (Lee and Lee, 2000).
The mean OM concentrations of stream sediment were 15.9, 18.9, 9.5, and 33.9 g/kg for stream inlet, middle inlet, middle outlet, and stream outlet, respec- tively (Table 3). The mean TN were 1.0, 1.0, 0.6, and 2.0 g/kg, correspondently, showing lowest in the middle
outlet and the highest in the stream outlet. The mean values of available P were 49, 100, 46, and 174 mg P
2O
5/kg for stream inlet, middle inlet, middle outlet, and stream outlet, respectively, indicating P accumu- lation at the stream outlet. This phenomenon probably resulted from the gate regulation of water flow at the middle outlet. The gate was closed for most of time and opened during rainfall events. High flow velocity occurring during rainfall discharge entailed suspended matter as well as sediment runoff at the outlet. As the runoff water reached the stream outlet where the stream slope becomes slow, much of suspended loads settled down along with particle‐adsorbed matter in- cluding P (Fig. 3). This proves why sediment at the steam outlet was observed to contain high P content.
The P content from OF paddy soils was discharged with paddy water runoff and accumulated in the drainage waterways causing a more slow flow near the stream outlet.
Paddy water quality
The concentrations of TP and TN in OF paddy wa- ter increased gradually at the first 2‐3 weeks after rice transplanting and then decreased gradually during the following rainy season (Fig. 4). This trend was differ- ent from that of conventional farms, which in general demonstrated rapid increase in TN and TP concen- trations over a short period time after chemical fertil- ization (Cho et al ., 2006; Hong and Kwun, 1998; Seo et al ., 2002).
After flooding paddy field, the paddy environment with increased water temperature and pH and decrea- sed redox potential seemed to facilitate the dissolu- tion of P combined with Fe or Al and thus increase P content in paddy water (Koski‐Vahala and Hartikainen, 2001; Kim et al . 2010).
Overall TN concentrations for the organic paddy
fields ranged from 0.28 to 5.95 mg/L and the mean
concentrations varied from 1.72 to 2.55 mg/L depend-
2006 year
TN TP
Avg Max Min Avg Max Min
OF1 2.04 5.92 0.30 0.72 2.30 0.17
OF2 2.17 5.22 0.72 0.38 1.55 0.09
OF3 2.32 5.95 0.28 0.39 0.99 0.08
2007 year
TN TP
Avg Max Min Avg Max Min
OF2 2.26 3.43 1.16 0.43 0.89 0.10
OF3 2.55 5.77 1.17 0.54 1.70 0.14
OF4 1.72 2.89 0.81 0.35 0.99 0.11
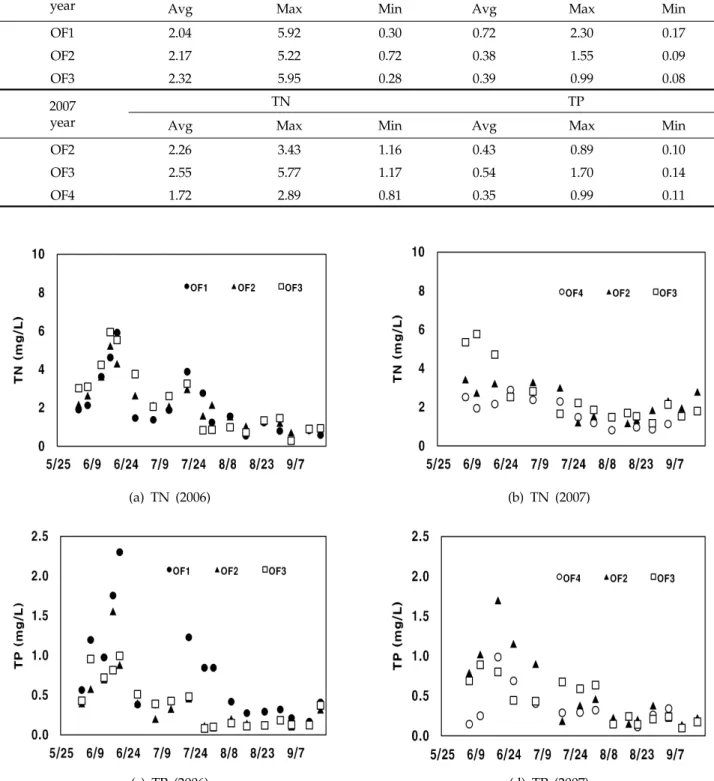
Table 4. TN and TP concentrations of water from the study paddy sites over the two‐year period (unit: mg/L)
(a) TN (2006) (b) TN (2007)
(c) TP (2006) (d) TP (2007)
Fig. 4. Temporal change in TN and TP concentrations for the organic paddy water (2006‐2007).
ing on the cultivation years and methods (Table 4).
The TP concentrations of paddy water varied from 0.08 to 1.70 mg/L (0.35 to 0.54 mg/L on average) and from 0.17 to 2.30 mg/L (0.72 mg/L on average) in fields after 4 and 15 years organic farming, respectively. The
TP concentration after 15 years organic farming was
nearly twice as high as that of 4 years organic farm-
ing which implies that P has accumulated in paddy
soils with continuous application of livestock‐compost
manure over a long period of time.
Sampling location
2006 2007
TN TP TN TP
Avg Max Min Avg Max Min Avg Max Min Avg Max Min
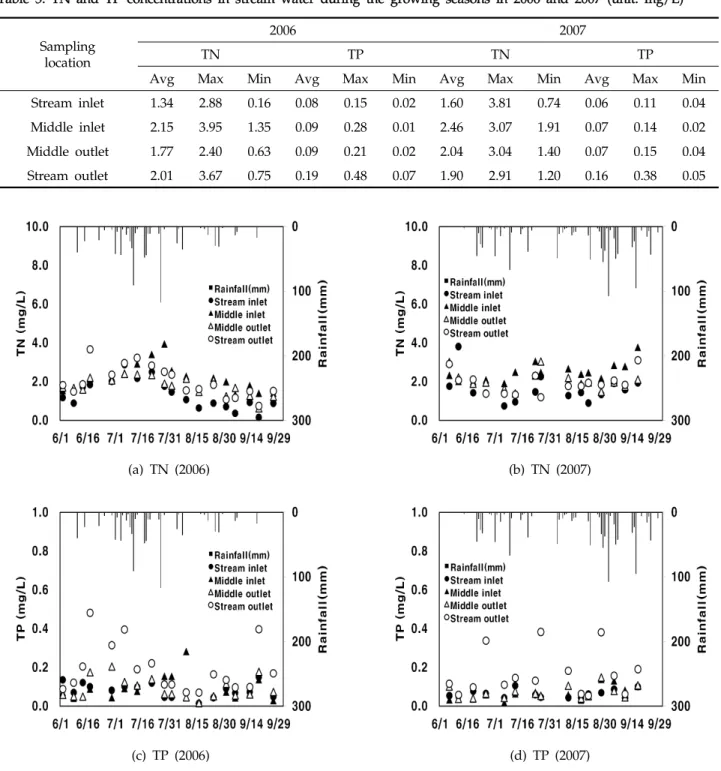
Stream inlet 1.34 2.88 0.16 0.08 0.15 0.02 1.60 3.81 0.74 0.06 0.11 0.04 Middle inlet 2.15 3.95 1.35 0.09 0.28 0.01 2.46 3.07 1.91 0.07 0.14 0.02 Middle outlet 1.77 2.40 0.63 0.09 0.21 0.02 2.04 3.04 1.40 0.07 0.15 0.04 Stream outlet 2.01 3.67 0.75 0.19 0.48 0.07 1.90 2.91 1.20 0.16 0.38 0.05 Table 5. TN and TP concentrations in stream water during the growing seasons in 2006 and 2007 (unit: mg/L)
(a) TN (2006) (b) TN (2007)
(c) TP (2006) (d) TP (2007)
Fig. 5. Temporal change in TN and TP concentrations for the site inlets and outlets.
Stream water quality