경작지대 및 재배방법에 따른 논토양의 비옥도 분포*
1)
김동진**․강다슬**․안병구***․이진호****
Distribution of Soil Fertility in Paddy Fields as Affected by Cultivation Methods and Topographical Regions
Kim, Dong-Jin․Kang, Da-Seul․Ahn, Byung-Koo․Lee, Jin-Ho
Soil chemical properties in paddy fields were found to be varied depending upon different cultivation methods such as environmentally-friendly, conventional, and two-crop farming systems and different topographical regions, namely plain, middle mountainous, and reclaimed land regions. Overall soil pH was found to be in optimal range (pH 5.5~6.5) for rice cultivation, except with conventional cultiva- tion fields of the reclaimed lands in Jeonnam province. Electrical conductivity (EC) was relatively higher in the two-crop cultivation fields than in others. How- ever, the concentrations of available phosphate as P
2O
5were exceptionally higher in the two-crop farming fields, thus in submerged paddy condition the phosphate could be released into streams and rivers. Soil organic matter (SOM) contents were mostly in optimal range (25~30 g k
g-1) for paddy field in Jeonbuk province, but in Jeonnam province they were slightly higher values of the range. The concentra- tions of available silicate (SiO
2) were mostly depended on the cultivation methods and the region, but some of paddy fields contained extremely high SiO
2concentra- tion. Statistical relationships among the soil chemical properties showed as follows:
Correlations between EC values and exchangeable cation concentrations, between SOM contents and CEC values, and between available SIO
2concentrations and pH, EC, exchangeable cations, and CEC values were positively significant, whereas total nitrogen concentrations were significantly negatively correlated with the concentrations of exchangeable K and Mg. These results might be very useful to establish benchmark paddy fields contained with certain levels of soil fertility.
Key words : cultivation method and topographical region, paddy field, soil
* 본 연구는 농촌진흥청 공동연구사업(과제번호 : PJ009197)의 연구비지원에 의하여 수행되었음.
** 전북대학교 대학원 농화학과
*** 전라북도농업기술원 기후변화대응과
**** Corresponding author, 전북대학교 생물환경화학과([email protected])
chemical properties, soil fertility
Ⅰ. 서 론
최근 인간 건강과 환경문제에 대한 관심이 대두되면서 농업적 측면에서도 안전한 농산 물 생산을 위한 친환경적 재배 방법을 선호하고 있으며, 토양의 질 개선을 위한 노력이 이 루어지고 있다(Yoon et al., 2002; OECD, 2001). 2013년 현재, 우리나라의 논 면적은 964천 ha로서 전체 국토면적의 9.6%를 차지하고 있으며, 2000년 1,149천 ha, 2005년 1,105천 ha, 2010년 984천 ha로서 매년 감소 추세에 있다(MAFRA, 2014). 특히, 논은 홍수조절, 여름철 대기 냉방효과 등의 천연적 만능댐 기능, 토양유실방지, 대기정화, 수질정화 등의 환경정화 기능, 토양산성화 완화, 연작장해방지, 자연적 제초효과 등의 농업적 부가가치가 있어 공익 기능적 측면에서 매우 중요하다 (Eom et al., 1993). 논 면적의 감소로 인하여 단위면적당 생 산량 향상을 도모하여야 하며, 식량안보적 측면에서 논토양 재배관리를 위하여 국가적 차 원에서 논토양 관리 대책을 위한 주기적인 토양비옥도 조사가 필요하다(Kang et al., 2012).
과거에는 작물 생산성을 높일 목적으로 토양 비옥도를 증진시켰으나(Peters, 2000), 최근에 는 토양 집적 및 불균형 양분관리와 2차 오염 예방이 중요하게 되었다(Cho et al., 2002; Lee et al., 2012). 유럽의 각국에서는 특정 지역의 작물생산에 있어 농약, 화학비료 등의 외부 농 자재 투입으로 발생한 토양 내 물질에 대한 지속적인 모니터링 사업이 실시되고 있으며 (EEA, 2001), 미국에서는 토양 중 인산이 환경으로 유출되어 수계 부영양화가 발생함에 따 라 토양 중 인산 함량 기준에 대하여 법제화가 진행되고 있다(Sharpley et al., 2003). 국내에 서는 농업환경 및 토양자원 실태조사에 따라 1999년부터 현재까지 전국 규모의 농업환경 변동 조사가 수행되고 있다(RDA, 2008; RDA, 2012). 또한, 농경지의 효율적 이용, 생산성 향상, 지속 농업 실천을 위해서는 경작 토양에 대한 정밀조사와 평가가 이루어져야 하며, 이렇게 얻어진 자료는 농업정책 수립, 연구 및 교육 등에 이용된다(Ahn et al., 2012). 그리 고, 전라남북도의 논 재배 면적 및 쌀 생산량을 2013년 기준으로 살펴보면, 전라남도와 전 라북도는 전체 경작지의 20.5%, 15.2%를 차지하고, 쌀 생산량은 각각 19.5%, 16.1%를 차지 한다(MAFRA, 2014). 이렇듯, 전라남북도는 전국에서 높은 논 재배 면적과 쌀 생산량을 차 지하고 있으며, 논의 공익적 기능과 식량안보의 장기적 대안 측면에서 논 토양환경의 지속 적인 조사와 모니터링은 필수 조건으로 여겨진다. 따라서, 본 연구에서는 전라남도와 전라 북도 지역의 논토양 비옥도를 조사하고, 이를 토대로 체계적인 관리 시스템을 구축하고, 대 표필지 선정에 필요한 기초자료로 활용하고자 하였다.
Ⅱ. 재료 및 방법
본 연구에서는 전라남북도 지역에서 논토양을 지대에 따라 평야지, 중산간지, 간척지로 구분하고, 각 지대 중 재배방법에 따라 친환경재배, 관행재배, 이모작재배로 구분한 후, 시 비이력이 명확한 재배지를 시료채취구로 선정하였다. 이를 바탕으로 전라남도 66지점과 전 라북도 88지점에서 모내기 전 3~5월에 토양시료를 채취하였다. 채취한 토양은 풍건쇄토 후 2.0 mm 토양체로 체걸음하여 분석시료로 사용하였다. 토양의 화학적 특성 분석은 국립농 업과학원의 토양 화학성 분석법에 준하여 실시하였다(NAAS, 2010). 토양의 pH와 전기전도 도(electrical conductivity, EC)는 토양시료와 증류수를 1:5 (w/v) 비율로 혼합 진탕 후 pH meter (Orion 3 star, Thermo Scientific, USA)와 EC meter (Orion star A215, Thermo Scientific, USA)로 측정하였다. 토양유기물(soil organic matter, SOM)은 Tyurin’s 방법으로 정량하였고, 총질소(total nitrogen, T-N)는 Kjeldahl 증류법(Vapodest 10s, Gerhardt, German)을 이용하여 분 석하였으며, 유효인산(available phosphate, avail. P2O5)은 Lancaster 방법으로 발색하여 UV/Vis Spectrophotometer (DU 720, Beckman Coulter, USA)로 측정 후 정량하였다. 치환성양 이온 (exchangeable cations)은 1.0N CH3COONH4 (pH 7.0)으로 추출 후 Inductively Coupled Plasma Optical Emission Spectrometry (ICP-OES, Optima 7300DV, Perkin Elmer, USA)로 측정 하였고, 양이온치환용량(cation exchange capacity, CEC)은 ammonium acetate 방법을 이용하 였다. 유효규산(available silicate, avail. SiO2) 함량은 1.0N CH3COONa (pH 4.0)으로 추출하여 발색 후 UV/Vis Spectrophotometer (DU 720, Beckman Coulter, USA)로 측정하였다. 그리고, 얻어진 분석결과는 SPSS (statistical package for the social sciences, ver. 18.0, SPSS Inc., Chicago, IL, USA)를 이용하여 통계분석하였다. 재배방법에 따른 토양화학성의 유의성 검정 을 위하여, 친환경재배지, 관행재배지, 이모작재배지의 3그룹으로 구성된 지대는 Duncan’s Multiple Range Test로, 친환경재배지, 관행재배지의 2그룹으로 구성된 지대는 T-test로 분석 하였다. 그리고, 토양 화학특성간 상관관계는 Pearson’s Correlation Analysis를 실시하였다.
Ⅲ. 결과 및 고찰
논토양 비옥도 평가를 위하여 전라북도와 전라남도 지역의 논 재배지 토양화학성을 조 사한 결과는 Table 1과 Table 2에 각각 나타나 있다.
Table 1. Values of soil chemical properties in different paddy fields depended on cultiva- tion methods and topographical regions in Jeonbuk province
Type
1)pH EC
3)SOM T-N Avail.
P
2O
5Exch. Cations
CEC Avail.
SiO
2K Ca Mg Na
(1:5) dS m
-1g kg
-1g kg
-1mg kg
-1--- cmol
ckg
-1--- mg kg
-1Plain
PE (11)
Min 4.8 0.27 22.0 1.27 18 0.17 3.84 1.02 0.08 10.2 75
Max 6.5 0.62 32.2 2.05 147 0.46 7.84 3.70 0.45 14.0 936
Mean
4)5.5
c0.44
b24.7
b1.60
a91
b0.27
b6.04
a2.07
b0.27
b11.7
a237
aPC
(10)
Min 5.2 0.26 23.2 0.73 61 0.10 4.85 1.22 0.08 10.6 92
Max 6.6 0.54 39.4 2.52 113 0.19 10.40 2.13 0.28 14.6 1063 Mean 5.9
b0.37
b30.3
a1.78
a72
b0.14
b7.07
a1.79
b0.19
b12.3
a303
aPT
(10)
Min 5.9 1.01 16.4 0.79 337 0.33 5.60 3.03 0.27 8.8 118
Max 7.0 3.98 27.1 1.63 937 1.25 8.74 4.29 1.47 10.7 336
Mean 6.6
a1.99
a22.0
b1.16
b522
a0.84
a6.91
a3.50
a0.64
a9.8
b200
aMiddle mountainous region
ME (15)
Min 4.6 0.22 17.9 1.03 27 0.10 3.10 0.43 0.10 7.8 105
Max 6.2 0.67 43.0 3.54 332 0.44 7.42 2.52 1.45 12.9 697
Mean 5.5
b0.35
b27.1
a1.78
a102
b0.20
b4.63
b1.01
b0.35
a10.2
a223
aMC
(12)
Min 4.8 0.21 11.1 0.93 14 0.06 3.15 0.71 0.07 7.2 57
Max 5.8 0.39 30.9 2.47 303 0.32 5.72 1.20 0.18 10.3 212
Mean 5.3
b0.29
b19.0
b1.33
a125
b0.19
b4.15
b0.85
b0.11
a8.7
b125
bMT
(12)
Min 5.0 0.63 8.8 0.56 114 0.15 4.25 1.17 0.12 7.5 86
Max 7.1 1.93 28.4 1.77 903 1.07 7.71 2.38 0.29 11.5 322
Mean 6.2
a1.11
a18.3
b1.32
a332
a0.63
a5.50
a1.62
a0.20
a9.7
ab195
abReclaimed land
RE (8)
Min 5.3 0.51 10.6 0.61 6 0.24 2.73 0.86 0.07 7.4 58
Max 6.7 2.23 14.2 0.95 33 0.51 4.09 3.15 1.93 9.2 254
Mean 5.8 1.33 12.6 0.79 19 0.38 3.42 1.95 0.80 8.2 147
RC (10)
Min 5.1 0.68 9.9 0.87 14 0.10 3.10 1.14 0.12 7.4 65
Max 6.5 3.22 48.5 3.25 148 0.42 9.64 3.24 1.20 20.0 306
Mean 5.8 1.54 16.7 1.29 74 0.21 4.75 2.01 0.48 9.9 144
Pr>|t|
5)ns ns ns ns * * ns ns ns ns ns
OV
2)5.5~6.5 - 25~30 - 80~120 0.25~0.30 5.0~6.0 1.5~2.0 - 10~15 157~180
1)
P, plain; M, middle mountainous region; R, reclaimed land; E, environmentally-friendly cultivation; C, conventional cultivation; T, two-cropping cultivation.
2)
OV, optimal value for rice cultivation (NAAS, 2010).
3)
EC, electrical conductivity; SOM, soil organic matter; T-N, total-nitrogen; CEC, cation exchange capacity.
4)
Numbers followed by the different letter within a mean value are significantly different at p<0.05 by Duncan’s multiple range test.
5)
* and ns are significant and no significant in mean value, respectively, at p<0.05 t-test.
Table 2. Values of soil chemical properties in different paddy fields depended on cultiva- tion methods and topographical regions in Jeonnam province
Type
1)pH EC
3)SOM T-N Avail.
P
2O
5Exch. Cations
CEC Avail.
SiO
2K Ca Mg Na
(1:5) dS m
-1g kg
-1g kg
-1mg kg
-1--- cmol
ckg
-1--- mg kg
-1Plain
PE (13)
Min 5.6 0.27 37.1 1.07 22 0.12 4.18 0.72 5.46 7.2 143
Max 7.0 0.65 53.2 2.98 176 0.39 8.15 2.13 6.04 14.3 1026
Mean 6.3 0.41 44.5 1.93 75 0.24 5.95 1.25 5.70 12.1 343
PC (11)
Min 5.2 0.39 38.9 1.17 57 0.07 3.46 0.76 0.15 7.3 72
Max 6.6 1.15 52.1 2.81 350 0.53 7.29 4.79 5.86 15.1 517
Mean 5.7 0.59 46.0 1.91 139 0.21 5.18 1.69 1.27 10.8 217
Pr>|t|
4)* * ns ns * ns ns ns * ns ns
Middle mountainous region
ME (10)
Min 5.4 0.10 39.5 1.02 20 0.08 1.48 0.28 0.08 6.8 21
Max 6.3 0.23 56.5 2.27 521 0.73 12.74 3.63 0.33 16.1 135
Mean 5.9 0.16 48.3 1.49 108 0.33 6.28 1.58 0.17 10.7 83
MC (11)
Min 5.6 0.21 26.0 1.20 11 0.04 3.37 0.63 0.15 8.6 71
Max 6.6 0.45 45.1 3.07 282 0.28 5.97 1.27 0.26 11.6 448
Mean 6.0 0.29 34.8 2.07 100 0.14 4.76 0.89 0.19 9.6 180
Pr>|t| ns * * ns ns * ns ns ns ns *
Reclaimed land
RE (10)
Min 5.6 0.43 21.4 1.02 27 0.13 4.64 1.96 0.34 9.5 96
Max 7.6 4.47 31.8 2.12 257 0.75 6.15 4.71 3.51 11.7 451
Mean 6.5 1.37 27.4 1.62 133 0.40 5.22 3.42 1.46 10.6 186
RC (11)
Min 7.1 0.84 23.1 0.97 1 0.46 4.70 3.22 0.65 8.9 376
Max 8.4 3.80 33.0 1.69 115 0.94 11.17 5.57 3.56 13.2 1243
Mean 8.0 2.35 27.4 1.25 29 0.70 7.71 4.01 2.53 11.0 622
Pr>|t| * ns ns * * * * ns * ns *
OV
2)5.5~6.5 - 25~30 - 80~120 0.25~0.30 5.0~6.0 1.5~2.0 - 10~15 157~180
1)
P, plain; M, middle mountainous region; R, reclaimed land; E, environmentally-friendly cultivation; C, conventional cultivation.
2)
OV, optimal value for rice cultivation (NAAS, 2010).
3)
EC, electrical conductivity; SOM, soil organic matter; T-N, total-nitrogen; CEC, cation exchange capacity.
4)
* and ns are significant and no significant in mean value, respectively, at p<0.05 t-test.
전라북도 지역 평야지의 경우, 토양 pH는 친환경재배지 평균 5.5, 관행재배지 평균 5.9, 이모작재배지 평균 6.6으로서, 국립농업과학원(NAAS, 2010)에서 권장하는 벼 재배지 적정 pH 5.5~6.5에 근접하는 것으로 나타났다. 그리고, 친환경재배지와 관행재배지의 pH는 Sohn et al. (1999)이 보고한 전북지역 토양 pH 5.7과 비슷한 수준이었으며, Kang et al. (2012)이 보고한 우리나라 논토양 평균 pH 5.8과도 비슷하였다. 전기전도도(EC, electrical conductivity) 는 이모작재배지(평균 1.99 dS m-1)가 친환경재배지와 관행재배지보다 높게 나타났는데, 선 작물 재배시 비료 및 퇴비 시용이나 시설하우스 재배가 원인인 것으로 판단된다. 토양유기 물(SOM, soil organic matter) 함량은 친환경재배지나 이모작재배지에서 평균적으로 적정기 준(25~30 g kg-1)보다 낮았고, 유효인산(avail. P2O5) 함량은 이모작재배지의 경우 평균 522 mg kg-1로서 적정기준(80~120 mg kg-1)보다 매우 높게 나타났다. 치환성 칼륨, 칼슘, 마그네 슘, 나트륨 이온(exch. K, Ca, Mg, and Na ions) 함량은 이모작재배지에서 높게 나타났으며, 이로 인하여 이모작재배지의 EC 농도에 영향을 준 것으로 보인다. 양이온치환용량(CEC, cation exchange capacity)은 평균적으로 적정기준(10~15 cmolc kg-1) 수준으로 나타났다. 유효 규산(avail. SiO2) 함량은 친환경재배지, 관행재배지, 이모작재배지 모두에서 적정기준(157~
180 mg kg-1)보다 높은 것으로 나타났고, 1,000 mg kg-1을 초과하는 재배지도 존재하였다.
중산간지의 경우 토양 pH는 평균적으로 적정기준(pH 5.5~6.5) 수준이었으며, EC는 이모 작재배지에서 1.11 dS m-1로서 친환경재배지와 관행재배지 보다 상대적으로 높았다. EC의 경우 이모작재배지의 치환성양이온 함량이 상대적으로 높은 것과 상호 관련성이 있는 것 으로 판단된다. 그리고 평야지의 경우와 마찬가지로 선작물 재배시 비료 및 퇴비 시용 또 는 시설 재배가 이루어지는 경우가 원인인 것으로 보이며, 특히 집약적으로 재배되는 시설 재배지는 염류집적이 문제가 되고 있다(Kang et al., 2011). SOM은 대체적으로 적정기준 (25~30 g kg-1) 보다 낮게 나타났고, 유효인산 함량은 평야지 경우와 같이, 이모작재배지에 서 매우 높게 나타났다. 논토양의 유효인산 함량이 높게 되면 담수상태에서 유효인산의 수 계로 유출 가능성이 높아 부영양화 등의 2차 오염이 우려된다(Cho et al., 2002; Tang et al., 2008). CEC는 대체적으로 적정기준(10~15 comolc kg-1) 보다 낮게 나타났으며, 유효규산 함 량은 적정기준(157~180 mg kg-1) 보다 약간 낮거나 높은 수준이었다.
간척지의 경우, 토양 pH는 친환경재배지 및 관행재배지에서 평균 5.8로서 적정기준(pH 5.5~6.5) 범위에 있었다. SOM, 유효인산, 치환성칼슘 함량은 적정기준(SOM, 25~30 g kg-1; avail. P2O5, 80~120 mg kg-1; exch. Ca, 5.0~6.0 cmolc kg-1) 수준보다 낮게 나타났다. CEC와 유효규산 또한 평균값이 적정기준보다 낮은 실정이었다.
전라남도 지역 논토양의 화학적 특성(Table 2) 중 평야지의 경우 토양 pH는 친환경재배 지 평균 6.3, 관행재배지 평균 5.7로서 적정기준(pH 5.5~6.5) 범위에 있었고, SOM 함량은 친 환경재배지 평균 44.5 g kg-1, 관행재배지 평균 46.0 g kg-1로서 적정기준(25~30 g kg-1)보다 매우 높게 나타났다. 유효인산 함량은 평균적으로 적정기준(80~120 mg kg-1)보다 약간 낮거
나 높은 수준이었다. 치환성칼륨은 평균값을 기준으로 적정기준(0.25~0.30 cmolc kg-1) 보다 약간 낮은 수준이었고, 치환성 칼슘과 마그네슘은 평균적으로 적정기준(exch. Ca, 5.0~6.0 cmolc kg-1; exch. Mg, 1.5~2.0 cmolc kg-1) 범위에 있었다. CEC는 평균적으로 적정기준(10~15 cmolc kg-1) 수준이었으며, 유효규산 함량은 평균값이 적정기준(157~180 mg kg-1) 보다 높게 나타났다.
중산간지의 경우, 토양 pH는 친환경재배지 평균 5.9, 관행재배지 평균 6.0으로서 적정범 위 수준이었으며, SOM은 친환경재배지 평균 48.3 g kg-1, 관행재배지 평균 34.8 g kg-1로서 적정범위보다 높게 나타났고, 유효인산 함량은 친환경재배지 평균 108 mg kg-1, 관행재배지 100 mg kg-1로서 적정범위였다. 관행재배지에서 치환성 칼륨, 칼슘, 마그네슘 함량은 평균 값으로 적정범위보다 낮은 것으로 나타났고, 친환경재배지의 유효규산 함량이 평균 83 mg kg-1로서 적정기준보다 낮은 수준이었다.
간척지의 경우, 관행재배지의 pH는 평균 8.0으로서 적정기준 보다 높게 나타났고, EC는 평야지나 중산간지보다 매우 높은 값을 나타내었으며, SOM은 평균값으로 적정범위였다.
유효인산은 관행재배지 평균 29 mg kg-1로서 적정기준보다 현저히 낮은 수준이었으나, 치 환성양이온은 친환경재배지의 치환성칼슘 평균 5.22 cmolc kg-1을 제외하고, 대체적으로 적 정기준보다 높은 것으로 나타났다. CEC는 평균값으로 적정범위였고, 유효규산 함량은 평 균적으로 적정기준보다 높게 나타났다. 간척지 농경지는 간척초기의 높은 염농도와 높은 지하수위로 인하여 작물 생육 불리한 조건이다(Yoo et al., 2007).
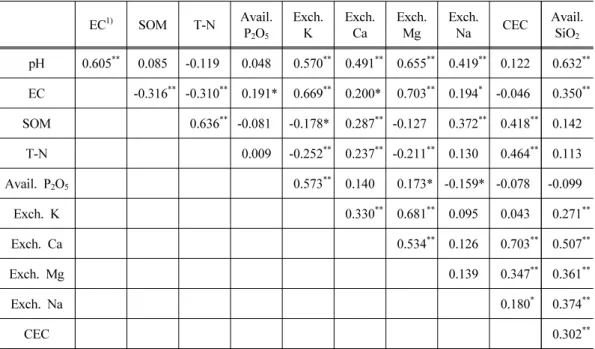
논토양의 화학적 특성간 상관관계는 Table 3과 같다. pH는 EC, exch. K, exch. Ca, exch.
Mg, exch. Na, avail. SiO2와 고도로 유의한 정의 상관관계(p<0.01)를 나타내었다. Ahn et al.
(2012)은 지형특성에 따른 전북지역 논토양의 화학성 변화 연구에서 pH가 exch, K, exch.
Ca, exch. Mg, exch. Na, avail. SiO2와 유의한 정의 상관관계가 있는 것으로 보고한바 있는 데, 본 연구에서도 동일한 결과가 나타났다. EC는 SOM, T-N과는 고도로 유의한 부의 상관 관계(p<0.01)를 나타낸 반면, 치환성 양이온과는 유의한 정의 상관관계를 나타내었는데, 이 는 전라북도 이모작재배지에서 치환성양이온 함량이 높을수록 EC가 높다는 것을 증명할 수 있는 결과라 할 수 있다. SOM은 T-N, exch. Ca, exch. Na, CEC와 유의한 정의 상관관계 (p<0.01)를 나타내었다. T-N은 exch. K 및 Mg과는 유의한 부의 상관관계를, exch. Ca, CEC 와는 유의한 정의 상관관계를 나타내었다. Avail. P2O5는 exch. K 및 Mg과는 유의한 정의 상관관계를 나타내었고, exch. Na와는 유의한 부의 상관관계(p<0.05)를 나타내었다. Lee et al. (2012)은 토양 pH와 avail. P2O5가 유의한 정의 상관관계인 것으로 보고한 반면, Ahn et al. (2012)은 토양 pH와 avail. P2O5가 부의상관이 나타난 것으로 보고하였다. 그러나 본 연 구에서는 토양 pH와 avail. P2O5가 정의 상관관계로 추정할 수 있었으나 유의성은 나타나지 않았다. Exch. K은 exch. Ca, exch. Mg, avail. SiO2와 고도로 유의한 정의 상관관계(p<0.01)를 보였다. Exch. Ca은 exch. Mg, CEC, avail. SiO2와 유의한 정의 상관관계(p<0.01)가 있는 것
으로 나타났다. Exch. Mg과 Na은 CEC, avail. SiO2와 유의한 정의 상관관계(p<0.05 또는 p<0.01)를 보였다. 그리고 CEC는 avail. SiO2와 유의한 정의 상관관계(p<0.01)가 나타났다.
Table 3. The values of correlation coefficient (r) among the chemical properties of paddy field soils (n=154)
EC
1)SOM T-N Avail.
P
2O
5Exch.
K
Exch.
Ca
Exch.
Mg
Exch.
Na CEC Avail.
SiO
2pH 0.605
**0.085 -0.119 0.048 0.570
**0.491
**0.655
**0.419
**0.122 0.632
**EC -0.316
**-0.310
**0.191* 0.669
**0.200* 0.703
**0.194
*-0.046 0.350
**SOM 0.636
**-0.081 -0.178* 0.287
**-0.127 0.372
**0.418
**0.142
T-N 0.009 -0.252
**0.237
**-0.211
**0.130 0.464
**0.113
Avail. P
2O
50.573
**0.140 0.173* -0.159* -0.078 -0.099
Exch. K 0.330
**0.681
**0.095 0.043 0.271
**Exch. Ca 0.534
**0.126 0.703
**0.507
**Exch. Mg 0.139 0.347
**0.361
**Exch. Na 0.180
*0.374
**CEC 0.302
**1)
EC, electrical conductivity; SOM, soil organic matter; T-N, total nitrogen; CEC, cation exchange capacity.
2)
Correlation coefficient (r) was determined by Pearson correlation analysis to evaluate the relationship between parameters. Result were evaluated with 95% and 99% confidence intervals; *, significant at p<0.05 and **, significant at p<0.01 level.
Ⅳ. 적 요
논토양의 화학적 특성은 경작지대 및 재배방법에 따라 차이가 나타났다. 토양 pH는 전라 남도 간척지의 관행재배지를 제외하고 대체적으로 적정기준(pH 5.5~6.5) 범위로 나타났다.
EC는 이모작재배지에서 다소 높게 나타나긴 하였으나 우려할 수준은 아니었고, 이모작재 배지에서 유효인산(avail. P2O5) 함량이 매우 높게 나타나 담수상태에서 유효인산의 하천 유 출로 인한 2차 오염이 우려된다. 토양유기물(SOM) 함량은 전라북도 지역 논토양에서는 대 체적으로 적정기준 (25~30 g kg-1) 보다 낮게 나타났으나, 전라남도 지역 논토양은 적정범위 이거나 초과하는 것으로 나타났다. CEC는 일부 재배지를 제외하고는 적정기준(10~15 cmolc
kg-1) 범위로 나타났고, 유효규산 (avail. SiO2) 함량은 적정기준(157~180 mg kg-1)보다 매우
높게 나타나는 경우도 있었으나, 대체로 경작 지대 및 재배방법에 따라 특이적 함량차이가 나타났다. 토양 화학성 상관성 분석에서 EC와 치환성 K, Ca, Mg, Na 이온은 유의성 있는 정의 상관관계로 나타났다. SOM 함량과 CEC는 유의성 있는 정의상관관계가 나타났고, avail. SiO2는 pH, EC, 치환성 양이온(exch. K, Ca, Mg, Na), CEC와 유의성 있는 정의 상관관 계를 보였다. 그러나 T-N은 치환성 K 및 Mg 이온과는 유의한 부의 상관관계를 나타내었 다. 이러한 결과를 토대로 비옥도의 기준이 되는 대표적인 논토양을 설정하는데 귀중한 자 료가 될 것으로 판단된다.
[Submitted, September. 2, 2015 ; Revised, September. 9, 2015 ; Accepted, September. 14, 2015]
Reference
1. Ahn, B. K., J. H. Lee, K. C. Kim, H. G. Kim, S. S. Jeong, H. W. Jeon, and Y. S. Zhang.
2012. Changes in chemical properties of paddy field soils as influenced by regional topography in Jeonbuk province. Korean J. Soil Sci. Fert. 45(3): 393-398.
2. Cho, J. Y., K. W. Han, J. K. Choi, Y. J. Kim, and K. S. Yoon. 2002. N and P losses from a paddy field plot in central Korea. Soil Sci. Plant Nutr. 48: 301-306.
3. EEA (European Environment Agency). 2001. European soil monitoring and assessment framework. EIONET workshop proceedings. Copenhagen, Denmark.
4. Eom, K. C., S. H. Yun, S. W. Hwang, S. G. Yun, and D. S. Kim. 1993. Public benefit from paddy soil. Korean J. Soil Sci. Fert. 26(4): 314-333.
5. Kang, B. G., S. Y. Lee, S. C. Lim, Y. S. Kim, S. D. Hong, K. Y. Chung, and D. Y.
Chung. 2011. Establishment of application level for the proper use of organic materials as the carbonaceous amendments in the greenhous soil. Korean J. Soil Sci. Fert. 44(2): 248- 255.
6. Kang, S. S., A. S. Roh, S. C. Choi, Y. S. Kim, H. J. Kim, M. T. Choi, B. K. Ahn, H. W.
Kim, H. K. Kim, J. H. Park, Y. H. Lee, S. H. Yang, J. S. Ryu, Y. S. Jang, M. S. Kim, Y. K. Sonn, C. H. Lee, S. G. Ha, D. B. Lee, and Y. H. Kim. 2012. Status and changes in chemical properties of paddy soil in Korea. Korean J. Soil Sci. Fert. 45(6): 968-972.
7. Lee, Y. H., Y. K. Sonn, S. T. Lee, J. Y. Heo, M. K. Kim, E. S. Kim, W. D. Song, Y. S.
Zhang, W. T. Jeon, and Y. S. Oh. 2012. Topographical chemical properties of paddy soils in Gyeongnam province. Korean J. Soil Sci. Fert. 45(2): 143-148.
8. MAFRA (Ministry of Agriculture, Food and Rural Affairs). 2014. Agricultur, Food and Rural statistical yearbook. Ministry of Agriculture, Food and Rural Affairs, Sejong, Korea.
9. NAAS (National Academy of Agricultural Science). 2010. Fertilization standard on crops.
National Academy of Agricultural Science, Rural Development Administration, Suwon, Korea.
10. NAAS (National Academy of Agricultural Science). 2010. Methods of soil chemical analysis.
National Academy of Agricultural Science, Rural Development Administration, Suwon, Korea.
11. OECD (Organization for Economic Co-operation and Development). 2001. Environmental indicators for agriculture. Methods and results, Volume 3: 171-193. Organization for Econo- mic Co-operation and Development, Paris, France.
12. Peters, J. B. 2000. Gambian soil fertility trends, 1991-1998. Commun. Soil Sci. Plant Anal.
31: 2201-2210.
13. RDA (Rural Development Administration). 2008. Monitoring project on agri-environment quality in Korea. One cycle project workshop. Rural Development Administration, Suwon, Korea.
14. RDA (Rural Development Administration). 2012. 2011 annual report of the monitoring project on agro-environmental quality. Rural Development Administration, Suwon, Korea.
15. Sharpley, A. N., J. L. Weld, D. B. Beegle, P. J. A. Kleinman, W. J. Gburek, P. A. Moore, Jr., and G. Mullings. 2003. Development of phosphorus indices for nutrient management plannings strategies in the United States. J. Soil Water Conserv. 58(3): 137-152.
16. Sohn, B. K., J. S. Cho, J. G. Kang, J. Y. Cho, K. Y. Kim, H. W. Kim, and H. L. Kim.
1999. Physico-chemical properties of soils at red pepper, garlic and onion cultivation ares in Korea. Korean J. Soc. Soil Sci. Fert. 32: 123-131.
17. Tang, J., B. Zhang, C. Gao, and H. Zeppa. 2008. Hydrological pathway and source area of nutrient losses idenfitied by a multi-scale monitoring in an agricultural catchment. Catena 72:
374-385.
18. Yoo, C. H., C. H. Yang, T. K. Kim, J. H. Ryu, J. H. Jung, S. W. Kang, J. D. Kim, and K. Y. Jung. 2007. Physico-chemical properties of paddy soil and actual farming conditions in Gyehwa reclaimed tidal land. Korean J. Soil Sci. Fert. 40(2): 109-113.
19. Yoon, J. H., I. Y. Kim, P. K. Jung, J. S. Suh, and H. J. Jun. 2002. Development of soil quality indicator, 240-258. Research Report of Dept. of Agricultural Environment, National Institute of Agricultural Science and Technology, RDA, Suwon, Korea.