BIOLOGICAL RESPONSES OF OSTEOBLAST-LIKE CELLS TO DIFFERENT TITANIUM SURFACE BY ANODIZING MODIFICATION
Myung-Joo Kim, D.D.S., M.S., Chang-Whe Kim, D.D.S., M.S.D., Ph.D., Young-Jun Lim, D.D.S., M.S.D., Ph.D., Hyun-Joo Park, D.D.S., M.S.D., Ph.D.
Department of Prosthodontics, Graduate School, Seoul National University
Statement of problem.To improve a direct implant fixation to the bone, various strategies have been developed focusing on the surface of materials. The surface quality of the implant depends on the chemical, physical, mechanical and topographical properties of the surface. The different properties will interact with each other and a change in thickness of the oxide layer may also result in a change in surface energy, the surface topography and surface, chemical composition. However, there is limited the comprehensive study with regard to changed sur- face and biologic behavior of osteoblast by anodization.
Purpose of study.The aim of this study was to analyze the characteristics of an oxide lay- er formed and to evaluate the cellular biologic behaviors on titanium by anodic oxidation (anodiza- tion) by cellular proliferation, differentiation, ECM formation and gene expression. And the phospholipase activity was measured on the anodized surface as preliminary study to understand how surface properties of Ti implant are transduced into downstream cellular events.
Methods and Materials.The surface of a commercially pure titanium(Grade 2) was modi- fied by anodic oxidation. The group 1 samples had a machined surface and other three experimental specimens were anodized under a constant voltage of 270 V(Group 2), 350 V(Group 3), and 450 V(Group 4). The specimen characteristics were inspected using the following five categories; the surface morphology, the surface roughness, the thickness of oxide layer, the crys- tallinity, and the chemical composition of the oxide layer. Cell numbers were taken as a mark- er for cell proliferation. While the expression of alkaline phosphatase and Runx2 (Cbfa1) was used as early differentiation marker for osteoblast. The type I collagen production was determined, which constitutes the main structural protein of the extracellular matrix.
Phospholipase A2and D activity were detected.
Results. (1) The anodized titanium had a porous oxide layer, and there was increase in both the size and number of pores with increasing anodizing voltage. (2) With increasing voltage, the surface roughness and thickness of the oxide film increased significantly (p<0.01), the TiO2 phase changed from anatase to rutile. During the anodic oxidization, Ca and P ions were more incor- porated into the oxide layer. (3) The in vitro cell responses of the specimen were also dependant on the oxidation conditions. With increasing voltage, the ALP activity, type I collagen production, and Cbfa 1 gene expression increased significantly (p<0.01), while the cell proliferation decreased. (4) In preliminary study on the relation of surface property and phospholipase, PLD activity was increased but PLA2activity did not changed according to applied voltage.
Conclusion. The anodized titanium shows improved surface characteristics than the machined titanium. The surface properties acquired by anodization appear to give rise more mature osteoblast characteristics and might result in increased bone growth, and contribute to the achievement of a tight fixation. The precise mechanism of suface property signaling is not known, may be related to phospholipase D.
Key Words
J Korean Acad Prosthodont : Volume 43, Number 6, 2005
P
ure titanium (Ti) and titanium alloys are frequently used as dental and orthopedic implant materials because of their excellent mechanical strength, chemical stability, and biocompatibili- ty.1Biocompatibility of titanium is closely relat- ed to the properties of the surface oxide layer, in terms of its structure, morphology and compo- sition. Various physical and chemical treatments of the Ti surface have been proposed with a view to obtaining the most biocompatible implant surface. Among the techniques, which have been found to be beneficial to the biological performance of the implants, are increasing the surface rough- ness and the oxidation of Ti to form a TiO2layer on the surface. The method used in this study for preparing porous oxide surface was anodic oxi- dation, an electrochemical method. In anodic oxidation (anodization), the ionic current and the processes at the electrode lead to the growth of an eventually oxide film (anodic oxide). The rough and porous oxide layer can be formed by anodization. The chemical composition, crys- tallinity, roughness, and topography of the implant surface are changed after the anodiz- ing procedure.2The response of cell and tissue to implant is affected by not only the chemical properties but also the surface topography or roughness of the implant surface. Therefore, we investigated TiO2layers with different thickness and roughness on the Ti surface, by controlling the applied voltage used in this study, The crystal structure, composition and morphology of the oxide layer were monitored with respect to the applied voltage for anodization. To identify the effect of anodization, the biological properties of the layers were evaluated by in vitro tests, in terms of the proliferation, differentiation, ECM for- mation, and gene expression. The preliminary study was also carried out to confirm the involve-ment of phospholipases during signaling of sur- face property modified by anodic oxidation treat- ment of Ti surface in MG63 cells.
MATERIALS AND METHODS
1. Ti disc preparation using anodic oxida- tion
Commercially available pure Ti (grade 2) machined into disks with dimensions of 23mm diameter and 1mm thickness. Prior to use, degre- asing and acid prepickling of all discs were done.
The pretreated discs were further processed, as described below, to produce surface of varying roughness.
Group 1: Machined, used as control.
Group 2: Anodized under constant voltage, 270V.
Group 3: Anodized under constant voltage, 350V.
Group 4: Anodized under constant voltage, 450V.
All discs were ultrasonically cleaned in trichloroethylene for 15min followed by soaking in 70% ethanol for 10 min three times and distilled water overnight. The samples were autoclaved and dried prior to cell culture experiments.
2. Characterization of oxide layer
The crystal structure and microstructure of the specimens were evaluated by X-ray diffraction (XRD; M18XHF-SRA, Mac Science Co., Yokohama, Japan) analysis and scanning electron microscopy (SEM; JSM-5600, JEOL, Tokyo, Japan), respec- tively. The composition of the surface layer was analyzed with EDS(INCA, Oxford, England).
The surface roughness was measured by means of an optical interferometer (Accura 2000�,
Intekplus Co., Seoul, Korea). The area of mea- surement was 80㎛×80㎛. Three parameters, the average roughness (Ra), 10 point average roughness (Rz) and Peak-to-Valley height (Rmax) were used to characterize the roughness of the spec- imens. The oxide thickness was estimated by disc sectioning and the sectioned surface was examined with SEM. These images were also analyzed by image program (Image access, Bildanalys system AB, Sweden) for the mea- surement of oxide’s thickness.
3. Biological properties
1) Cell culture
For experiments rat calvarial osteoblast-like cells and human osteosarcoma MG63 cells were used. Cells were isolated from calvaria of 1-2 day old rats and collected and cultured in α- minimal essential medium (α- MEM : Gibco, USA) containing 10% fetal bovine serum (FBS) and 1% antibiotics-antimycotics (Gibco, USA). MG63 cells were obtained from the American Type Culture Collection (Rockvill, MD, USA). Cells were sedded of 2×10⁵cells in RPMI1640 medium (Gibsco BRL, Grand Island, NY, USA) 10% heat inactivated FBS and 10U/ml penicilline/strep- tomycin. Control group was cultured on the plastic culture surfaces. Experimental groups were cells cultured on the titanium surfaces in 6 well culture plates. For the RT-PCR and phos- pholipase detection experiments, cells were cul- tured on 8 discs of each group placed in 100 mm dishes (Corning, IL, USA). The media were changed every second day throughout the exper- iment. After reaching visual confluence, growth medium were suctioned, extra cells and growth medium were washed with PBS (phosphate buffered saline) solution. The discs of each group were transferred to new dishes and cells were har-
vested with a hand scrapper or trypsin-EDTA solu- tions.
2) Cell number
At visual confluence, the MG63 cells were washed twice with PBS and then transferred discs and released from the cultured surface by addition of 0.25% trypsin-EDTA. Cell suspen- sions from both trysinizations centrifuged at 500
×g for 10min. Cell number was determined using a Coulter counter (Hialeach, FL, USA).
Cells harvested in this manner exhibited more than 95% viability based on trypan blue exclusion.
3) Alkaline phosphatase activity
The ALP activity was determined colorimetri- cally using an ALP kit as described by the man- ufactures (Sigma, USA). At visual confluence of rat calvarial osteoblast cells, alkaline phosphatase activity was assayed as the release of ρ-nitro- phenol from ρ-itrophenylphosphate at pH 10.4. The reaction was stopped after 30 min using 2N sodi- um hydroxide and the absorbance read was per- formed at 405nm using ELISA reader (Bio-tek, USA). The specific activity was calculated refer- ring to protein concentration of lysates. Experiments were performed in 6 replicates, and the activity was averaged from four independent experiments.
4) Type I collagen measurement
The type I collagen production was determined in rat calvarial osteoblast. Collagen assay was based on the binding of a dye, Sirius Red F3BA (Chroma, Stuttgart, Germany), to the triple helical collagen fibril. At visual confluence of rat calvarial osteoblastlike cells grown on each Ti surface groups, 50 ㎕/well of cell lysate was dispersed into 24-well plates, incubated at 37℃ for 16 hours in humidified atmosphere and then for 24 hours in dried atmosphere. The staining was performed
with 100 ㎕/well of 0.1% Sirius Red F3BA in saturated picric acid for 1 hour at room temper- ature. The plates were rinsed five times with 200 ㎕ of 10mM HCl, then washed with 0.1M NaOH and absorbance was read at 540 nm. The optical density values were compared to the standard curve of type I collagen samples.
5) RT-PCR
MG63 cells were cultured (1×10⁶cells) on to tita- nium surfaces for 1, 3 and 1 day after visual confluence (6~7days). Total cellular RNA was extracted using the RNeasy Protect kit (Qiagen, Germany), DNAse 1-treated then quantified by measuring absorbance at λ260nm on a UV160U spectrophotometer. For the first strand cDNA synthesis, an initial RT mixture was treated and incubated at 65℃ for 5 minutes, then quenched on ice. 10μl of diluted cDNA was transferred into a 10μl PCR reaction mixture that contained 5pmol/
μl of sense and antisense oligonucleotide primers, 1×PCR buffer(10mM Tris-HCl, 50mM KCl, 1.5mM MgCl2), 0.1mM dNTPs, and 0.5U TaqDNA polymerase. The forward primer (5-TCTG- GCCTTCCACTCTCAG T-3) and reverse primer (5-TATGGAGTGCTGCTGGTCTG-3) of Runx2 were synthesized based on the Runx2 mRNA sequence. Amplification reactions for the Runx- 2 cDNA and the house keeping gene glycer- aldehydes phosphate dehydrogenase (GAPDH) were carried out. Amplifications were performed using a thermal cycler (Eppendorf, Germany), with the temperature cycling being set as follows: 94
℃ for 60s, 58℃ for 30s, 72℃ for 60s: 5cycles, 94℃
for 30s 56℃ for 30s, 72℃ for 60s: 5cycles, 94℃ for 30s, 54℃ for 30s, 72℃ for 60s: 25cycles, followed by a final extension at 72 ℃ for 10minutes. PCR products were analyzed by 1% agarose gel elec- trophoresis containing 0.01% ethidium bromide.
Visualized PCR product bands were sliced from the gel and fluorescence within the gel was
detected using a Lumi-imager F1 Workstation (Roche Molecular Biochemicals, Indianapolis, IN). The relative intensity of each band was determined and analyzed as the relative abundance of Runx2(Cbfa1)/ GAPDH.
6) Phospholipase assay (1) PLA2assay
PLA2activity was assayed as described else- where,3except that, for separation of [3H]arachi- donic acid (AA), authentic AA was added and a heptane/diethylether/acetic acid (60:40:2) sol- vent system was used. MG63 cells in RPMI con- taining FBS were plated on different surface of Ti disc and tissue culture plastic to a density of 2×
105cells per dish and were cultured for visual con- fluence of 80% at 37℃. Then, 2 mCi/mL of [3H]AA were added to each well, incubated for 6 h washed at least twice with PBS containing 10% FBS. The [3H] AA released into the medium measured using liguid scintillation counter. At the end of the experiments, the cells were solubi- lized with 0.5 mL of methanol to determine the intracellular total incorporation. Counts were corrected for intracellular pools of AA.
(2) PLD Assay
PLD activity in intact cells was determined by measuring PBt, the unique transphosphatidyla- tion product of PLD in the presence of n-butanol, as described previously.4After culturing on tissue culture plate and anodized Ti surface at 37 ℃ to visual confluence of 80~90%, cells were labeled to [3H]myristic acid and incubated for 3 hours and were resuspended in the assay medium supple- mented with 0.3 % n-butanol. [3H]PBt produced was separated on a TLC plate using a solvent sys- tem of ethylacetate/isooctane/acetic acid/water (13/2/3/10) and counted in a liquid scintilla- tion counter (Wallac, Finland).
RESULTS
1. Surface analysis of Ti modified by an- odization
1) Surface morphology
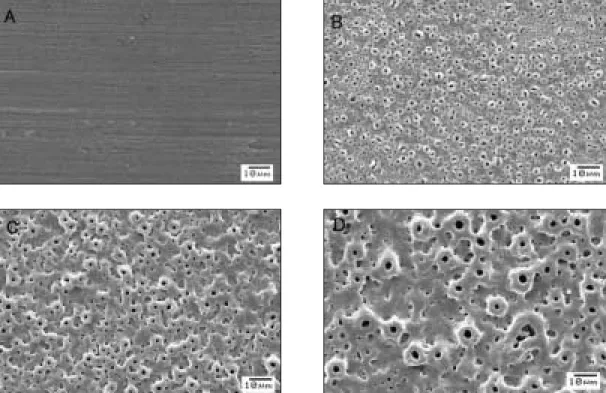
The surface morphologies of the Ti after anodiza- tion using different treatment conditions are shown in Fig. 1. Before the oxidation treatment, only the machining grooves were observed on the surface. When a pulsed DC field of 270V was applied, a porous oxide layer became uniformly porous. The resulting layer was actually composed of small craters with holes at the center. When the voltage was increased to 350V, the size of these craters became so large that they were connected together, and the presence of tiny cracks was
observed. When the voltage attained 450V, the size of the holes, as well as that of the craters, became much larger. Table Ⅰ shows the average pore size of the experimental specimens.
2) Surface Roughness
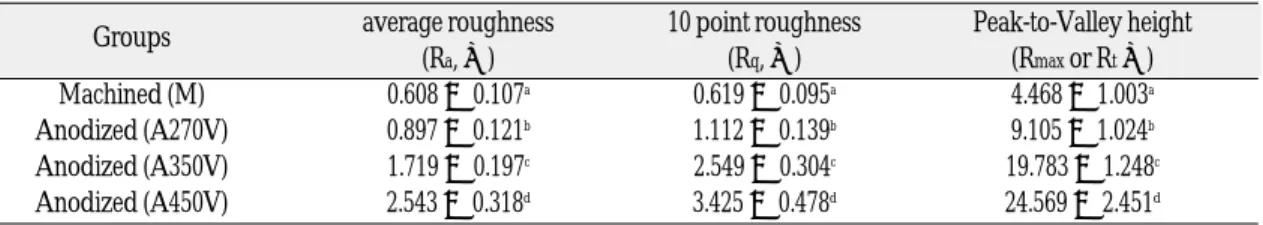
Table Ⅱ is showed the optical interferometer analysis results. The anodized discs showed a rougher surface than the machined discs. The Ra value of the anodic groups was significantly higher than that of machined group (p<0.05).
As the applied voltage increased, the values of Ra, Rzand Rmaxincreased.
3) Oxide thickness of anodized Ti discs The oxide layer which was anodized at the higher voltage, had a thicker oxide layer. TableⅢ
Fig. 1. SEM surface morphologies of Ti surfaces treated with anodization at different voltages: (A) machined (B) 270V, (C) 350V and (D) 450V. Magnification × 1000
Table II. The surface roughness(Ra) of the titanium discs
Groups average roughness 10 point roughness Peak-to-Valley height
(Ra, ㎛) (Rq, ㎛) (Rmaxor Rt㎛)
Machined (M) 0.608 ± 0.107a 0.619 ± 0.095a 4.468 ± 1.003a
Anodized (A270V) 0.897 ± 0.121b 1.112 ± 0.139b 9.105 ± 1.024b Anodized (A350V) 1.719 ± 0.197c 2.549 ± 0.304c 19.783 ± 1.248c Anodized (A450V) 2.543 ± 0.318d 3.425 ± 0.478d 24.569 ± 2.451d
Data were expressed as mean values and standard deviation (S.D.).
Statistical significance were tested by ANOVA (P<0.01).
The matching letters indicate significant difference between groups based on Scheffe’s multiple comparison test.
is showed the average thickness of the oxide layer of each specimen. With increasing volt- age, the layer became significantly thicker.
4) Phase and structure of oxide layer
The phase of the oxide layers formed by the anodic oxidation process was characterized by XRD analysis, as shown in Fig. 2. Group 1 specimens showed peaks of titanium substrate on X-ray diffraction pattern. They did not show features of the crystal structure of the oxide film. The Group 2 specimens showed many anatase peaks (Fig. 2).
After further increasing the voltage, the intensi- ty of the anatase and rutile phase increased. In con- clusion, the Group 1 specimens have an amorphous oxide layer. The Group 2 specimens have an anatase structure while Group 3 and 4 speci- mens have an anatase and rutile structure in the oxide layer.
5) Chemical Composition
The chemical composition of the surface layer formed by the anodic oxidization process was determined by EDS analysis, as shown in Table Table I. The pore size of the experimental group specimens
A 270 V A 350 V A 450 V
Mean±SD (㎛) 0.79±0.27a 1.87±0.45b 2.63±0.62c
Data were expressed as mean values and standard deviation (S.D.).
Statistical significance were tested by ANOVA (P<0.01).
The matching letters indicate significant difference between groups based on Scheffe’s multiple comparison test.
Table III. The average thickness of the oxide layer of each specimen
A 270 V A 350 V A 450 V
Mean±SD (㎛) 2.89±0.42* 7.07±1.02* 10.19±2.45*
Data were expressed as mean values and standard deviation (S.D.).
Statistical significance were tested by Kruskall-Wallis test.
* indicates significant difference on machined group (P<0.01).
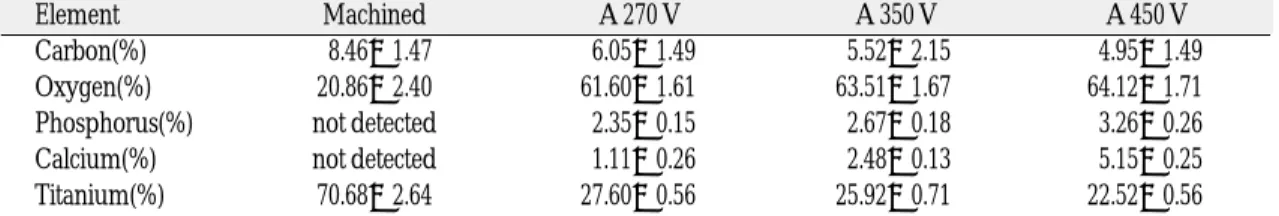
Ⅳ. Oxygen and titanium were the major ele- ments in the oxide layers. The concentrations of Ca, P and O increased with increasing voltage, while that of Ti decreased steadily.
2. Biologic response of osteoblast-like cells grown on anodized Ti
1) Cell numbers in MG63 cells
The number of cells was counted after culturing them for 7 days (1day after visual confluence). In all cases, the cells proliferated at least 10 times com- pared to the originally plated cells. When the Ti was anodized at 270V, the proliferation rate was the highest but significantly low than machined Ti surface. As the voltage used for the oxidation process increased, the number of cells decreased steadily (Table Ⅴ).
2) The ALP activity and type Ⅰcollagen pro- duction in rat calvarial osteoblast cells
The differentiation behavior of the cells was quite different from the proliferation behavior.
The ALP activities of the rat calvarial osteoblast- Fig. 2. XRD patterns of machined and anodized spec-
imens.
Table IV. The chemical composition of oxide layer of experimental group
Element Machined A 270 V A 350 V A 450 V
Carbon(%) 8.46±1.47 6.05±1.49 5.52±2.15 4.95±1.49
Oxygen(%) 20.86±2.40 61.60±1.61 63.51±1.67 64.12±1.71
Phosphorus(%) not detected 2.35±0.15 2.67±0.18 3.26±0.26
Calcium(%) not detected 1.11±0.26 2.48±0.13 5.15±0.25
Titanium(%) 70.68±2.64 27.60±0.56 25.92±0.71 22.52±0.56
Data were expressed as mean values and standard deviation (S.D.).
All anodic groups were significantly different on machined group based on Kruskall-Wallis test (p<0.01)
Table V. Number of MG63 cells after culturing for visual confluence
Groups Cell number (106cells) % of cell number
Control (tissue culture plate) 1.885 ± 0.098 100 ± 5.1a
Machined (M) 1.603 ± 0.096 86.4 ± 5.1b
Anodized (A 270V) 1.541 ± 0.077 81.8 ± 4.1b
Anodized (A 350V) 1.246 ± 0.092 66.1 ± 4.9c
Anodized (A 450V) 1.046 ± 0.085 55.5 ± 4.5d
Data were expressed as mean values and standard deviation (S.D.).
Statistical significance were tested by ANOVA (P<0.01).
The same letters indicate non-significant difference between groups based on Scheffe’s multiple comparison tests.
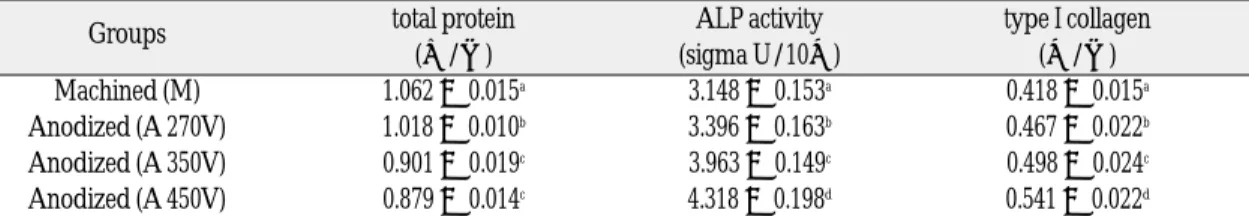
like cells cultured for 1day after visual confluence (6~7days) on various specimens are shown in Table Ⅵ. The ALP activity was not much affect- ed by the aodization process when the applied volt- age was 270V than machined Ti surface. However, when the voltage was 350 and 450, the activity of the cells significantly increased rapidly. Table
Ⅵ also showed the amounts of type I collagen pro- duced by primary rat calvarial osteoblast-like cells at 1day after confluent cultures. The type I collagen productions of anodized Ti were high- er those on the MA surface (P<0.01).
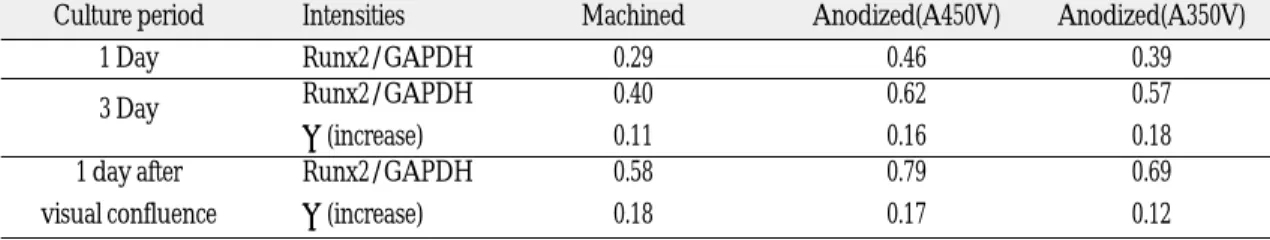
3) Cbfa 1 (Runx 2) gene expression in MG63 cells To investigate the potential influences of anodized treatments on the osteogenic key mark- er Runx2 gene expression, MG63 cells were incu- bated on different discs for 1 days, 3 days, and 1day after visual confluence. The expression of Runx2 gene was examined using Reverse transcription PCR and the electrophoresis result is shown in Fig.
3. The Runx2 gene expression increased consis- tantly from 1 day to 1day after visual conflu- ence in all groups. The Runx2 mRNA from cells cultured showed highest level expression in 450 V anodized surface discs. The time course results demonstrate more rapid Runx2 expression in cells grown on 450 V anodized surface at day 1 of
culture, on 350 V anodized surface at day 3 of cul- ture, on machined surface at day 5 ~ 6 (1 day after visual confluence) of culture. The patterns of the gene expression with anodized surface treat- ment were noted along the time table. These results were identified with relative intensities mea- sured from transilluminated, ethidium bromide stained gels (Table Ⅶ).
4) The phospholipase activity in MG63 cells In order to examine the role of phospholipase in mediating cell signaling by surface property of Ti, the PLA2and PLD activity was measured after cul- turing on anodized surface of Ti response with respect to proliferation or differentiation of osteoblast. Phospholipase A2(PLA2) hydrolyzes the acyl group of glycerophospholipids, generating free fatty acids and lysophospholipids. The prod- ucts of the PLA2-catalyzed reaction can potentially act as second messengers, or be further metabo- lized to eicosanoids, platelet-activating factor, and lysophosphatidic acid. Neither machined Ti surface nor anodized Ti surface activated the release of arachidonic acid in a significant man- ner (Fig. 4). Furthermore, we did not observe any significant increase in PLA2activity for rougher sandblasted and electric discharge machined specimens (data not shown).
Table VI. ALP activity and type Ⅰcollagen of rat calvarial osteoblast-like cells
Groups total protein ALP activity type I collagen
(㎎/㎖) (sigma U/10㎍) (㎍/㎖)
Machined (M) 1.062 ± 0.015a 3.148 ± 0.153a 0.418 ± 0.015a
Anodized (A 270V) 1.018 ± 0.010b 3.396 ± 0.163b 0.467 ± 0.022b Anodized (A 350V) 0.901 ± 0.019c 3.963 ± 0.149c 0.498 ± 0.024c Anodized (A 450V) 0.879 ± 0.014c 4.318 ± 0.198d 0.541 ± 0.022d
Data were expressed as mean values and standard deviation (S.D.).
Statistical significance were tested by ANOVA (P<0.01).
The same letters indicate non-significant difference between groups based on Scheffe’s multiple comparison tests.
Under physiological conditions, PLD is the primary enzyme for the hydrolysis of phos- phatidylcholine, which leads to the generation of choline and phosphatidic acid. We next examined PLD activity in response to modified surface by measuring PBt formation in the presence of 1- butanol. The MG63 cells grown on A450V surface resulted in a fourfold increase of PLD activity (Fig.
7), in contrast, there was no significant activation of PLA2. As increase of surface roughness and oxide layer by anodization, PLD activity was stimulated with surface-dependent pattern.
Table VII. The calculated Runx2/GAPDH relative intensities(%)
Culture period Intensities Machined Anodized(A450V) Anodized(A350V)
1 Day Runx2/GAPDH 0.29 0.46 0.39
3 Day Runx2/GAPDH 0.40 0.62 0.57
�(increase) 0.11 0.16 0.18
1 day after Runx2/GAPDH 0.58 0.79 0.69
visual confluence �(increase) 0.18 0.17 0.12
Fig. 3. Cbfa1 (Runx2) mRNA expression in MG63 cells grown on machined and anodized surface.
Fig. 4. PLA2activity in MG63 cells grown on modified Ti surface.
The results are plotted as a percentage of the PLD activity in control cells and represent the means±SD of four independent experiments with 6 replicates.
Statistical significance were tested by ANOVA (P>0.05).
Fig. 5. Stimulation of PLD activity by anodized surface in MG63 cells.
The results are plotted specific PLD activity as a the per- centage of [3H]PBt in total lipid and represent the means ± SD of four independent experiments with 6 replicates. Statistical significance were tested by ANO- VA. The asterica indicate significant difference between groups (P<0.01).
Cbfa1 GAPDH
day confluence
day 1
M A450 A350 M A450 A350 M A450 A350 day 3
DISCUSSION
The properties of the oxide layer, such as its thick- ness, microstructure, roughness, and concentra- tions of Ca and P are easily controllable by adjust- ing the voltage, current, processing time, and the concentration of the electrolyte during the anod- ic oxidization.5-8The microstructural change of the oxide layer was found to be closely related to the voltage used for the anodization. Increasing the voltage resulted in an increase in both the rough- ness and pore size, as well as in the thickness of the oxide layer (TableⅠ and Table Ⅱ). The phase and composition changes were also closely relat- ed to the processes involved in the anodization.
With increasing voltage, rutile TiO2was formed along with the anatase (Fig. 2). Analogous behav- ior was observed during the thermal oxidation of Ti; at low temperature, anatase is formed, and at higher temperatures, the rutile phase becomes more stable than the anatase phase.1During the anod- ic oxidation, the energy supplied to the system is proportional to the applied voltage. Therefore, the formation of rutile TiO2at higher voltage is a reasonable phenomenon. The concentrations of Ca or P ions in the oxide layer are strongly dependent on the applied voltage (TableⅣ). When the applied voltage was increased, more Ca or P ions present in the electrolyte were incorporated into the oxide layer.
The changes in chemical composition, oxide layer and roughness of the Ti surface played crucial roles in the biocompatibility of the implant.
Cell numbers were taken as a marker for cell proliferation. While the expression of alkaline phosphatase and Runx2 (Cbfa1) was used as early differentiation marker for osteoblast. The type I collagen production was determined, which constitutes the main structural protein of the extracellular matrix and thus may be a reliable indi- cator of bone matrix synthesis. The prolifera-
tion rate was highest when the specimen was oxidized at the relatively low voltage of 270V, and it decreased steadily with increasing voltage (TableⅤ). Even though there was some variation depending on the applied voltage, the number of cells increased more than 10 times compared to the originally plated cells. These proliferation results simply indicate that all of the specimens offered a biologically favorable environment. In contrast to the proliferation behavior, the ALP activ- ity of the cells increased when the applied voltage was increased (Table Ⅵ). Generally, surface roughness affects cell proliferation and differ- entiation: increasing surface roughness decreas- es the cell proliferation rate, but increases ALP activity.9,10Our result shows that the roughness and the amount of Ca and P ions incorporated into the titanium oxide layer strongly affect the cell response. Especially, the ALP activity signifi- cantly increased at higher voltages, which is deemed to be closely related to the increase in sur- face roughness and the increased amount of Ca and P contained in the oxide layer. There were con- troversies about the relationship of oxide thick- ness and cellular responses. Ellingen and Videm11 showed that there was no significant correla- tion between oxide thickness of titanium implants and the bony responses. They explained the rea- son why the outermost molecular layer of the bio- materials is the most important part for the bone response, because the only surface of oxide lay- er is exposed to the tissue. But, Li et al.12report- ed that the level of ALP activity was higher in the anodized group with higher roughness and thick- er oxide layer than in MA groups and described that the anodized surface was more favorable than other surface in osteoblast differentiation. In this study, thicker oxide film between aodized groups showed higher alkaline phosphatase activity. Our results suggested that rougher sur- face and surface with thick oxide film were more
favorable than other surfaces in osteoblast dif- ferentiation. In present study, collagen production on anodized surface was significantly high level.
It seems that collagen synthesis was clearly influ- enced by oxide layer and surface roughness.
Previous studies that have supported similar responses have already been reported for osteoblast-like cells.13-15The cellular growth and type I collagen production was influenced either by the chemical nature of the substratum or by the con- figuration of its surface.
The transcription factor Cbfa1 (Core binding fac- tor a 1, Runx2) regulates osteoblast differentiation and expression of genes necessary for the devel- opment of a mineralized phenotype.16,17Runx2 plays an essential role in steering multipotent mes- enchymal precursor cells toward an osteoblastic lineage18and promotes osteoblast differentiation at an ealry stage, but inhibits osteoblast differ- entiation at a late stage.19Shui et al. demonstrat- ed that human BMSC (bone marrow stromal cell) constitutively express Cbfa1 mRNA and protein and the activity of Cbfa1 binding to DNA was markedly increased in a time-dependent manner.20 We studied the effects of anodized treatments to a titanium surface on the expression of Cbfa1 in MG63 cells. Human osteosarcoma MG63 cells are committed osteoblasts that are more mature compared to a preosteoblast or bone marrow stromal cell but more immature than other osteoblasts. Therefore, early expression and activity of Runx2 during that time in MG63 cells could be more meaningful. The amounts and patterns of Cbfa1 gene expressions differ with time according to applied voltage (Fig. 4). In cells on machined surface, the lowest expression level was noted. The expression level was highest in the 1 day sample and was maintained to 5 days in cells on A450V disc. More rapid expression of Cbfa1 in cells grown on A450V surface at 1 day culture, on
face at 5 days culture, were noted (Table Ⅶ).
Roughness and oxide layer were increased M, A350V and A450V in turn. From this result, we hypothesize the rougher implant surface, the sooner the Cbfa1 gene expresses. The early expression of Cbfa1 in MG63 cells on Ti disc of increased surface roughness or topographic com- plexity is congruent with in vivo observations regarding the extent of osteogenesis on implants of increasing surface roughness. Bowers et al.
reported that the increased Cbfa1 gene expression was noted on rougher surfaces.21Another paper reported that differentiation of preosteoblasts is affected by implant surface microtopographies.22 Among the surface characteristics, only roughness differences could not explain our results. We should consider the effect and interaction of not only roughness but also chemical composition and the characteristics of surface microstructure on Cbfa1 expression. Therefore, further studies that focus on the different effects of chemical com- position, microstructure and oxide layer with same roughness on cell behaviors will be required.
Boyan et al. reported upon the relationship between phospholipid metabolism and osteoblast differentiation in MG63 cells.23The main objective of present preliminary study was to evaluate the potential and differential activation of phos- pholipases, such as PLA2or PLD, by modified sur- face property of Ti in MG63 cells based on the our experimental results of lipid composition analy- sis (Data are not shown). These enzymes are considered to play an important role as effec- tor enzymes in membrane lipid mediated signal transduction. Boyan et al. suggested that pro- tein kinase A and PLA2is involved in surface roughness-induced osteogenic differentiation in MG63 cells. Sung et al. reported the activation of phospholipase C and D may contribute to neuronal differentiation by neurogenic PDGF in the HiB5
Although a previous report upon the relation- ship between phospholipid metabolism and osteoblast differentiation in MG63 cells implied that PLA2is involved in surface roughness- induced osteogenic differentiation, our current report shows that the activation of PLA2does not occur during the surface roughness-dependent dif- ferentiation on of MG63 cells. The results obtained from Boyan et al. suggested that surface rough- ness of Ti is mediated with accumulated PGE2 though PLA2activation via integrin receptor.25The increase of PLA2activity was deduced from the accumulated PGE2compared with our study.
Otherwise PLD activity was increased during the surface properties-dependent differentiation on of MG63 cells. In a variety of cell lines phos- phatidic acid serves as an important second mes- senger. Important regulatory proteins whose activities are known to be activated directly by PA in vitro include Raf-1 kinase, PKC , protein tyro- sine phosphatase 1C and PLCγ.26-27The present study suggests that the activation of phospholi- pases D may play an important role in the trans- duction of signals by modified surface property (increased roughness and/or oxide layer of sur- face) in MG63 cells. Further analysis of down- stream signaling pathways activated by differential phospholipases may give deeper insights into the mechanism of different biological outcomes induced by surface roughness of Ti.
CONCLUSIONS
The present study demonstrated that the anodized surface treatment could affect the sur- face properties and the surface roughness, oxide thickness and surface chemical composition have an effect on osteoblast-like cell proliferation, dif- ferentiation and matrix production. Within the lim- itation of this study, the following conclusions could be drown.
1. The anodized titanium had a porous oxide layer, and there was increase in both the size and number of pores with increasing anodiz- ing voltage.
2. With increasing voltage, the surface roughness and thickness of the oxide film increased sig- nificantly (p<0.01), the TiO2phase changed from anatase to rutile. During the anodic oxi- dization, Ca and P ions were more incorporated into the oxide layer.
3. The in vitro cell responses of the specimen were also dependant on the oxidation condi- tions. With increasing voltage, the ALP activ- ity, type I collagen production, and Cbfa 1 gene expression increased, while the cell pro- liferation decreased.
4. In preliminary study on the relation of surface property and phospholipase, PLD activity was increased, but PLA2 activity did not changed according to applied voltage.
Acknowledgements
The authors are grateful to professor Myung-Un Choi for providing constructs to assay phos- pholipase and to Seong-Joo Heo for helpful dis- cussion. This work was supported in a part by a grant from the Korea Health 21 R&D project, ministry of Health & Welfare of Korea (02-PJ3-PG6- EV11-0002)
REFERENCES
1. D.M. Brunette, P. Tengvall, M. Textor and P.
Thomsen, Titanium in medicine. Springer; Berlin;
2001.
2. Lausmaa J. Surface oxides on titanium: Preparation, characterization and biomaterial applications. Ph D thesis. Department of Physics University of Go¨teborg. 1991:67-68.
3. Peppelenbosch MP, Tertoolen LG, de Hage WJ, Laat SW. Epidermal growth factor-induced actin re- modeling is regulated by 5-lipoxygenase and cy- clooxygenase products. Cell 1993;74:565-575.
4. Lee SY, Park NG, Choi M-U. Effects of mastoparan B and its analogs on the phospholipase D activity
in L1210 cells. FEBS Letter 1998;432:50-54.
5. Yerokhin AL, Nie X, Leyland A, Matthews A, Dowey SJ. Plasma electrolysis for surface engi- neering. Surf Coat Technol 1999;122:73-93.
6. Ishizawa H, Ogino M. Formation and characteri- zation of anodic titanium oxide films containing Ca and P. J Biomed Mater Res 1995;29:65-72.
7. Ishizawa H, Ogino M. Characterization of thin hydroxyapatite layers formed on anodic titani- um oxide films containing Ca and P by hy- drothermal treatment. J Biomed Mater Res 1995;29:1071-1079.
8. Ishizawa H, Fujino M, Ogino M. Histomorphometric evaluation of the thin hydroxyapatite layer formed through anodization followed by hydrothermal treatment. J Biomed Mater Res 1997;35:199-206.
9. Sul YT, Johansson CB, Jeong Y, Albrektsson T.
The electrochemical oxide growth behaviour on ti- tanium in acid and alkaline electrolytes. Med Eng Phys 2001;23:329-346.
10. Sul YT, Johansson CB, Petronis S, Krozer A, Jeong Y, Wennerberg A, Albrektsson T. Characteristics of the surface oxides on turned and electrochem- ically oxidized pure titanium implants up to di- electric breakdown: the oxide thickness, microp- ore configurations, surface roughness, crystal structure and chemical composition. Biomaterials 2002;23:491-501.
11. Ellingen JE. Surface configurations of dental im- plants. Periodontology 2000 1998; 17:36-46.
12. Li L-H, Kong Y-M, Kim H-W, Kim Y-W, Kim H-E, Heo S-J et al. Improved biological performance of Ti implants due to surface modification by micro- arc oxidation. Biomaterial 2004;25:2867-2875.
13. Hott M, Noel B, Rey C, Marie PJ. Proliferation and differentiation of human trabecular osteoblastic cells on hydroxyapatite. J Biomed Mater Res 1997;
37(4):508-516.
14. Ferraz MP, Knowles JC, Olsen I, Monteiro FJ, Santos JD. Flow cytometry analysis of effects of glass on response of osteosarcoma cells to plasma- sprayed hydroxyapatite/CaO-P(2)O(5) coatings.
J Biomed Mater Res 1999;47(4):603-611.
15. Puleo DA, Holleran LA, Doremus RH, Bizios R.
Osteoblast responses to orthopedic implant materials in vitro. J Biomed Mater Res 1991;25(6):711-723.
16. Xiao G, Wang D, Benson MD, Karsenty G, Franceschi RJ. Role of the alpha2-integrin in os- teoblast-specific gene expression and activation of the osf2 transcription factor. J Biol Chem 1998;273:32988-32994.
17. Ducy P, Zhang R, Geoffroy V, Ridall AL, Karsenty G. Osf2/Cbfa1: a transcriptional activator of os- teoblast differentiation. Cell 1997 May 30;89(5):747- 754.
18. Komori T. A fundamental transcription factor for bone and cartilage. Biochem Biophys Res Commun.
2000 Oct 5; 276(3):813-816. Review.
19. Toshihisa Komori. Runx2, A multifunctional tran- scription factor in skeletal development, J Cell biochem 2002;87:1-8.
20. Shui C, Spelsberg TC, Riggs BL, Khosla S. Changes in Runx2/Cbfa1 expression and activity during os- teoblastic differentiation of human bone marrow stromal cells. J Bone Miner Res. 2003 Feb;18(2):213- 221.
21. Schneider GB, Perinpanayagam H, Clegg M, Zaharias R, Seabold D, Keller J. et al. Implant surface roughness affects osteoblast gene expres- sion. J Dent Res 2003; 82(5):372-377.
22. Schneider GB, Zaharias R, Seabold D, Keller J, Stanford C. Differentiation of preosteoblasts is affected by implant surface microtopographies. J Biomed Mater Res 2004 Jun 1;69A(3):462-8.
23. Boyan BD, Sylvia VL, Dean DD, Del Toro F, Schwartz Z. Differential regulation of growth plate chondrocytes by 1a,25-(OH)2D3and 24R,25- (OH)2D3involves cell-maturation-specific membrane receptor activated phospholipids metabolism.
Crit Rev Oral Biol Med 2002;13:143-154.
24. Sung JY, Lee SY, Min DS, Eom TY, Choi M-U, Kim Y. et al. Differential activation of phospholi- pases by mitogenic EGF and neurogenic PDGF in immortalized hippocampal stem cell lines. Journal of Neurochemistry 2001;78:1044-1053.
25. Boyan BD, Sylvia VL, Liu Y, Sagun R, Cochran DL, Dean DD. et al. Surface roughness mediates on os- teoblasts via protein kinase A and phospholipase A2. Biomaterials 1999;20:2305-2310.
26. Exton JH. New developments in phospholipase D.
J Biol Chem 1997;272:15579-15582.
27. Exton JH. Phospholipase D: enzymology, mech- anisms of regulation, and function. Physiol Rev 1997;77:303-320.
Reprint request to:
CHANG-WHEKIM D.D.S., M.S.D., PH.D.
DEPARTMENT OFPROSTHODONTICS,COLLEGE OFDENTISTRY,
SEOULNATIONALUNIVERSITY
28-1, YEONGUN-DONG,GHONRO-GU,SEOUL, 110-749, KOREA
Silk1@ snu.ac.kr