INTRODUCTION
Survival estimates of patients registered by population- based cancer registries reflect the average prognosis from a given cancer, since they are based on unselected patients with a variety of natural histories as well as treatment patterns.
Population-based cancer survival data are also useful for eval- uating effectiveness and efficiency of cancer-directed health services in a given region. Although survival data have been reported for selected cancer sites from hospitals, the survival data from population-based registry data have been rarely reported in Korea (1, 2).
The Korea Central Cancer Registry (KCCR) began as a nationwide hospital-based program in 1980. The operational details of cancer registration have been previously described (3). The KCCR constructed the Korea National Cancer Inci- dence DataBases (KNCIDB) by merging the KCCR data- bases and eight Population-Based Regional Cancer Registry databases, the site-specific cancer registry databases (breast, ovary, uterus, and liver cancer) and additional data from medical record review surveys. Using this KNCIDB and other sources such as mortality data from National Statisti- cal Office, it became possible to produce national survival rates. In this paper, we report the results from survival analy-
sis for cancer patients diagnosed during 1993-2002 in Korea at primary cancer sites.
MATERIALS AND METHODS
The data in this study were based on the KNCIDB. A total of 935,325 cancer patients diagnosed from January 1, 1993 to December 31, 2002 were included.
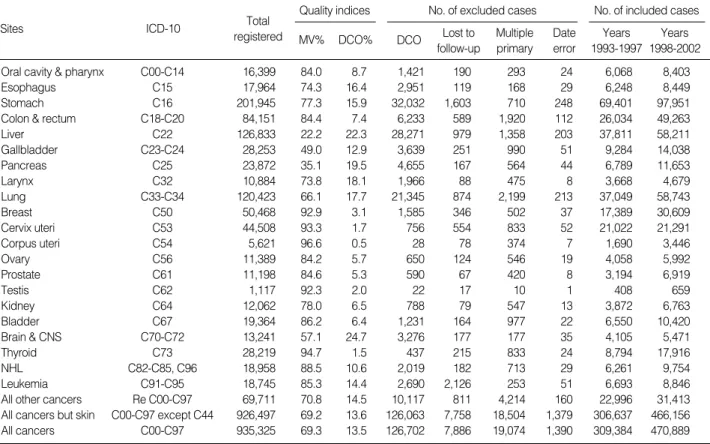
Table 1 shows the quality indices, numbers and proportion of included and excluded cases. The Morphological Verifica- tion (MV) %, an indicator of the validity of the diagnostic information, is the percentage of cases for which the diagno- sis was based on morphological verification of a tissue speci- men. Overall, MV% was 69.3% (n=648,615), ranging from 22.2% in liver to 94.7% in thyroid. Death certificate only (DCO) % was the percent of cancer cases recognized by only the mortality records, which is another indicator for the vali- dity of the data. Overall, DCO% was 13.5% (n=126,702), ranging from 0.5% in Corpus uteri to 24.7% in Brain and CNS.
A total of 126,702 DCO cases (13.5%) were excluded from the survival analysis. Furthermore, 7,886 cases (0.8%), that could not be followed up due to mismatched Personal Iden-
Kyu-Won Jung, Seon-Hee Yim, Hyun-Joo Kong, Soon-Young Hwang, Young-Joo Won, Jong-Koo Lee*, Hai-Rim Shin
Cancer Registration and Biostatistics Branch, National Cancer Control Research Institute, National Cancer Center, Goyang; Office for Health and Medical Care Policy*, Ministry of Health and Welfare, Gwacheon, Korea
Address for correspondence Hai-Rim Shin, M.D.
National Cancer Control Research Institute, National Cancer Center, 809 Madu1-dong, Ilsandong-gu, Goyang, 410-769, Korea
Tel : +82.31-920-2175, Fax : +82.31-920-2179 E-mail : [email protected]
*This work was supported by a grant 0410010-3 from the National Cancer Center, and the 2006 National Health Promotion Program grant 0660160-1 from the Ministry of Health and Welfare, Republic of Korea.
S5
Cancer Survival in Korea 1993-2002: A Population-Based Study
Population-based survival reflect the average prognosis of unselected patients with a variety of natural histories as well as treatment patterns and are also useful for evaluating effectiveness and efficiency of cancer-directed health services in a given region. Although survival data have been reported based on hospital data, the sur- vival data from population-based registry have been rarely reported in Korea. Based on the Korea National Cancer Incidence Database, we report the results from sur- vival analysis for cancer patients diagnosed during 1993-2002 and followed up until 31 December 2005 at primary cancer sites. The five-year relative survival rates (RSR) were calculated using the Ederer II method. The Kaplan-Meier method was used to estimate median survival and the 95% confidence intervals. In males, the five-year RSR for all cancers was 32.5% during 1993-1997 and was 37.8% during 1998-2002. In females, the five-year RSR for all cancers was 53.7% during 1993- 1997 and was 57.0% during 1998-2002. The largest improvement in survival was shown in prostate cancer in males and breast and stomach cancer in females. The median survival durations were 16.3 months in males and 81.6 months in females.
This result will be useful for evaluation of cancer treatment outcomes in Korea.
Key Words : Cancer Registry; Survival; Korea
Received : 14 September 2006 Accepted : 18 December 2006
tification Number, 19,074 cases (2.0%), that were not first primary sites, and 1,390 cases (0.1%) with mismatched dates were excluded from the analysis.
A total of 780,273 cases (83.4%) were eligible for final analysis. Passive follow-up was performed until 31 Decem- ber 2005. The survival duration of each case was determined as the time difference (in months) from the date of initial diagnosis to the date of death, date of loss to follow-up, or the closing date for follow-up. Cancer was classified accord- ing to the International Classification of Diseases, the 10th revision (ICD-10).
Five-year relative survival rates (RSRs) and the median survival time were calculated. Relative survival was defined as the ratio of the observed survival rate to the expected rate;
this was based on a group of people in the general popula- tion similar to the patient group with respect to race, sex, age and calendar period of observation (4). It means the sur- vival experience of patients are adjusted for normal life expec- tancy of the general population of the same age, which makes relative survival rate an estimate of the chance of surviving the effects of cancer (5).
The RSRs were calculated using the Ederer II method (6).
Relative survival analyses were based on an algorithm written in SAS by Paul Dickman (7) with some minor adaptations.
Asymmetric observed survival confidence intervals (CIs) were
formed from standard errors estimated using the Greenwood’s method (8) and the log (-log) transformation. RSR confidence limits were derived by dividing the observed survival limits by the corresponding expected survival rate (4).
The median survival using the Kaplan-Meier method and its CIs were also calculated (8).
RESULTS
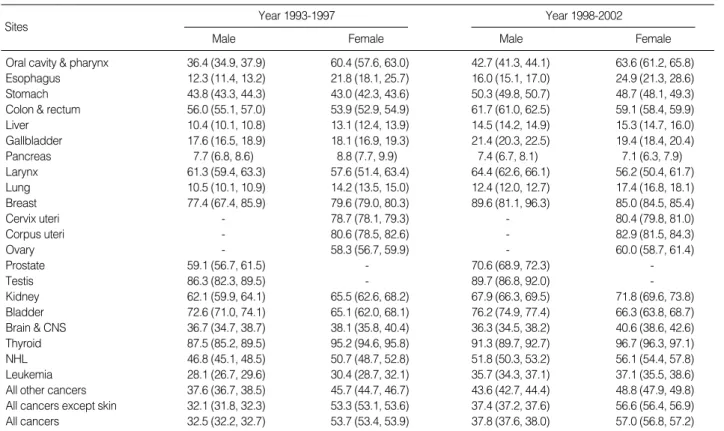
Relative survival(Table 2, Fig. 1, 2)
In males, the five-year RSR for all cancers combined was 32.5% (95% CI 32.2-32.7) during the period 1993-1997 and was 37.8% (95% CI 37.6-38.0) during 1998-2002. In females, the five-year RSR for all cancers was 53.7% (95%
CI 53.4-53.9) during 1993-1997 and was 57.0% (95% CI 56.8-57.2) during 1998-2002.
The 10 most common cancer sites in males were stomach, liver, lung, colon and rectum, bladder, esophagus, gallblad- der, pancreas, prostate, and oral cavity & pharynx and five- year RSRs for these cancer sites were 43.8% (95% CI 43.3- 44.3), 10.4% (95% CI 10.1-10.8), 10.5% (95% CI 10.1- 10.9), 56.0% (95% CI 55.1-57.0), 72.6% (95% CI 71.0- 74.1), 12.3% (95% CI 11.4-13.2), 17.6% (95% CI 16.5-
Sites ICD-10
Quality indices
MV% DCO%
Total registered
No. of excluded cases
DCO Lost to follow-up
Multiple primary
Date error
No. of included cases Years
1993-1997 Years 1998-2002
Oral cavity & pharynx C00-C14 16,399 84.0 8.7 1,421 190 293 24 6,068 8,403
Esophagus C15 17,964 74.3 16.4 2,951 119 168 29 6,248 8,449
Stomach C16 201,945 77.3 15.9 32,032 1,603 710 248 69,401 97,951
Colon & rectum C18-C20 84,151 84.4 7.4 6,233 589 1,920 112 26,034 49,263
Liver C22 126,833 22.2 22.3 28,271 979 1,358 203 37,811 58,211
Gallbladder C23-C24 28,253 49.0 12.9 3,639 251 990 51 9,284 14,038
Pancreas C25 23,872 35.1 19.5 4,655 167 564 44 6,789 11,653
Larynx C32 10,884 73.8 18.1 1,966 88 475 8 3,668 4,679
Lung C33-C34 120,423 66.1 17.7 21,345 874 2,199 213 37,049 58,743
Breast C50 50,468 92.9 3.1 1,585 346 502 37 17,389 30,609
Cervix uteri C53 44,508 93.3 1.7 756 554 833 52 21,022 21,291
Corpus uteri C54 5,621 96.6 0.5 28 78 374 7 1,690 3,446
Ovary C56 11,389 84.2 5.7 650 124 546 19 4,058 5,992
Prostate C61 11,198 84.6 5.3 590 67 420 8 3,194 6,919
Testis C62 1,117 92.3 2.0 22 17 10 1 408 659
Kidney C64 12,062 78.0 6.5 788 79 547 13 3,872 6,763
Bladder C67 19,364 86.2 6.4 1,231 164 977 22 6,550 10,420
Brain & CNS C70-C72 13,241 57.1 24.7 3,276 177 177 35 4,105 5,471
Thyroid C73 28,219 94.7 1.5 437 215 833 24 8,794 17,916
NHL C82-C85, C96 18,958 88.5 10.6 2,019 182 713 29 6,261 9,754
Leukemia C91-C95 18,745 85.3 14.4 2,690 2,126 253 51 6,693 8,846
All other cancers Re C00-C97 69,711 70.8 14.5 10,117 811 4,214 160 22,996 31,413
All cancers but skin C00-C97 except C44 926,497 69.2 13.6 126,063 7,758 18,504 1,379 306,637 466,156
All cancers C00-C97 935,325 69.3 13.5 126,702 7,886 19,074 1,390 309,384 470,889
Table 1.Data quality indices, numbers and proportion of included and excluded cases
CNS, central nervous system; NHL, non-Hodgkin’s lymphoma; MV, Morphological verification; DCO, death certificate only.
18.9), 7.7% (95% CI 6.8-8.6), 59.1% (95% CI 56.7-61.5), and 36.4% (95% CI 34.9-37.9) during 1993-1997, and were 50.3% (95% CI 49.8-50.7), 14.5% (95% CI 14.2- 14.9), 12.4% (95% CI 12.0-12.7), 61.7% (95% CI 61.0- 62.5), 76.2% (95% CI 74.9-77.4), 16.0% (95% CI 15.1- 17.0), 21.4% (95% CI 20.3-22.5), 7.4% (95% CI 6.7-8.1), 70.6% (95% CI 68.9-72.3), and 42.7% (95% CI 41.3-44.1) during 1998-2002, respectively.
In the females, the 10 most common cancer sites were sto- mach, breast, cervix uteri, colon and rectum, lung, thyroid, liver, gallbladder, ovary, pancreas, and the five-year RSRs for
these cancer sites were 43.0% (95% CI 42.3-43.6), 79.6%
(95% CI 79.0-80.3), 78.7% (95% CI 78.1-79.3), 53.9%
(95% CI 52.9-54.9), 14.2% (95% CI 13.5-15.0), 95.2%
(95% CI 94.6-95.8), 13.1% (95% CI 12.4-13.9), 18.1%
(95% CI 16.9-19.3), 58.3% (95% CI 56.7-59.9), 8.8%
(95% CI 7.7-9.9) during 1993-1997, and were 48.7%
(95% CI 48.1-49.3), 85.0% (95% CI 84.5-85.4), 80.4%
(95% CI 79.8-81.0), 59.1% (95% CI 58.4-59.9), 17.4%
(95% CI 16.8-18.1), 96.7% (95% CI 96.3-97.1), 15.3%
(95% CI 14.7-16.0), 19.4% (95% CI 18.4-20.4), 60.0%
(95% CI 58.7-61.4), and 7.1% (95% CI 6.3-7.9) during
Bladder Prostate Colon & rectum Oral cavity &
pharynx Stomach
Gallbladder Esophagus Liver Lung Pancreas
0 20 40 60 80 100
%
1993-1997
Fig. 1.Five-year relative survival of 10 major cancers in Korea, male, 1993-2002.
1998-2002
Thyroid
All cancer All cancer
Breast Cervix Ovary Colon & rectum Stomach Gallbladder Liver Lung Pancreas
0 20 40 60 80 100
%
1993-1997
Fig. 2.Five-year relative survival of 10 major cancers in Korea, female, 1993-2002.
1998-2002 Sites
Year 1993-1997
Male Female
Year 1998-2002
Male Female
Oral cavity & pharynx 36.4 (34.9, 37.9) 60.4 (57.6, 63.0) 42.7 (41.3, 44.1) 63.6 (61.2, 65.8)
Esophagus 12.3 (11.4, 13.2) 21.8 (18.1, 25.7) 16.0 (15.1, 17.0) 24.9 (21.3, 28.6)
Stomach 43.8 (43.3, 44.3) 43.0 (42.3, 43.6) 50.3 (49.8, 50.7) 48.7 (48.1, 49.3)
Colon & rectum 56.0 (55.1, 57.0) 53.9 (52.9, 54.9) 61.7 (61.0, 62.5) 59.1 (58.4, 59.9)
Liver 10.4 (10.1, 10.8) 13.1 (12.4, 13.9) 14.5 (14.2, 14.9) 15.3 (14.7, 16.0)
Gallbladder 17.6 (16.5, 18.9) 18.1 (16.9, 19.3) 21.4 (20.3, 22.5) 19.4 (18.4, 20.4)
Pancreas 7.7 (6.8, 8.6) 8.8 (7.7, 9.9) 7.4 (6.7, 8.1) 7.1 (6.3, 7.9)
Larynx 61.3 (59.4, 63.3) 57.6 (51.4, 63.4) 64.4 (62.6, 66.1) 56.2 (50.4, 61.7)
Lung 10.5 (10.1, 10.9) 14.2 (13.5, 15.0) 12.4 (12.0, 12.7) 17.4 (16.8, 18.1)
Breast 77.4 (67.4, 85.9) 79.6 (79.0, 80.3) 89.6 (81.1, 96.3) 85.0 (84.5, 85.4)
Cervix uteri - 78.7 (78.1, 79.3) - 80.4 (79.8, 81.0)
Corpus uteri - 80.6 (78.5, 82.6) - 82.9 (81.5, 84.3)
Ovary - 58.3 (56.7, 59.9) - 60.0 (58.7, 61.4)
Prostate 59.1 (56.7, 61.5) - 70.6 (68.9, 72.3) -
Testis 86.3 (82.3, 89.5) - 89.7 (86.8, 92.0) -
Kidney 62.1 (59.9, 64.1) 65.5 (62.6, 68.2) 67.9 (66.3, 69.5) 71.8 (69.6, 73.8)
Bladder 72.6 (71.0, 74.1) 65.1 (62.0, 68.1) 76.2 (74.9, 77.4) 66.3 (63.8, 68.7)
Brain & CNS 36.7 (34.7, 38.7) 38.1 (35.8, 40.4) 36.3 (34.5, 38.2) 40.6 (38.6, 42.6)
Thyroid 87.5 (85.2, 89.5) 95.2 (94.6, 95.8) 91.3 (89.7, 92.7) 96.7 (96.3, 97.1)
NHL 46.8 (45.1, 48.5) 50.7 (48.7, 52.8) 51.8 (50.3, 53.2) 56.1 (54.4, 57.8)
Leukemia 28.1 (26.7, 29.6) 30.4 (28.7, 32.1) 35.7 (34.3, 37.1) 37.1 (35.5, 38.6)
All other cancers 37.6 (36.7, 38.5) 45.7 (44.7, 46.7) 43.6 (42.7, 44.4) 48.8 (47.9, 49.8) All cancers except skin 32.1 (31.8, 32.3) 53.3 (53.1, 53.6) 37.4 (37.2, 37.6) 56.6 (56.4, 56.9)
All cancers 32.5 (32.2, 32.7) 53.7 (53.4, 53.9) 37.8 (37.6, 38.0) 57.0 (56.8, 57.2)
Table 2.Five-year relative survival rates and 95% confidence intervals by cancer site and sex Unit: % (95% CI)
CNS, central nervous system; NHL, non-Hodgkin’s lymphoma.
1998-2002, respectively. The largest improvement in sur- vival was shown in prostate cancer in males, and stomach and breast cancer in females. Most cancers diagnosed during 1998-2002 had higher relative survival than during 1993- 1997, except for pancreatic cancer.
Median survival (Table 3)
The median survival time by sex was shown in Table 3. The median follow-up time was 16.3 months in males and 44.4 months in females.
The median survival time for all cancer patients was 16.3 months in males and 81.6 months in females. Female cancer patients survived significantly longer than male cancer patients.
The median survival time for stomach, liver, lung, and colon and rectal cancer in males were 30.9 (95% CI 30.2-31.5), 5.8 (95% CI 5.7-5.9), 7.6 (95% CI 7.6-7.7), and 68.2 (95% CI 66.2-70.3) months, respectively. In females, the median sur- vival time for stomach, colon and rectum, lung, and liver cancer patients were 31.8 (95% CI 30.9-33.0), 72.6 (95%
CI 69.9-75.8), 8.9 (95% CI 8.7-9.1), and 6.6 (95% CI 6.4- 6.7) months, respectively. The median survival of breast and uterine cervical cancer in females were not calculated because of the high survival rates. The median survival for pancreatic cancer was the lowest.
DISCUSSION
Monitoring the survival trends of cancer patients is essen- tial for assessment of the progress in cancer treatment (9).
However, reports on survival are limited especially in devel- oping countries (10, 11); in Korea, there is only one article on population-based survival of cancer patients diagnosed in 1995 (1).
This study first reports that survival rates for cancer pa- tients have improved substantially in Korea during the last decade.
For all cancers combined, females appeared to have a much better prognosis than males, which has been previously ob- served in other countries (12). This apparent female advan- tage is partly explained by the high frequency of female can- cers (e.g., thyroid, breast, and uterine cervix) known to have relatively good prognosis. In addition, it is possible that be- havioral, environmental, and genetic factors and their com- plex interrelations, may influence cancer prognosis, and play a role in determining the survival differences between males and females found in the present study (13).
Cancer survival improved steadily for most cancers in both sexes between 1993-1997 and 1998-2002. For males, the five-year survival increased between 1993 and 2002 for most cancers except for pancreas, brain and central nervous system.
Sites
Male
Median survival (95% CI) Median FU
in months No.
Female
Median survival (95% CI) Median FU
in months No.
Oral cavity & pharynx 10,972 25.4 25.4 (24.5, 26.5) 3,499 52.0 118.0 (105.4, 132.3)
Esophagus 13,492 9.1 9.1 (8.9, 9.2) 1,205 10.8 10.8 (9.8, 11.7)
Stomach 111,165 30.9 30.9 (30.2, 31.5) 56,187 31.8 31.8 (30.9, 33.0)
Colon & rectum 41,463 44.3 68.2 (66.2, 70.3) 33,834 45.1 72.6 (69.9, 75.8)
Liver 73,426 5.8 5.8 (5.7, 5.9) 22,596 6.6 6.6 (6.4, 6.7)
Gallbladder 11,735 8.6 8.6 (8.3, 8.9) 11,587 7.7 7.7 (7.5, 8.0)
Pancreas 10,740 4.4 4.4 (4.2, 4.5) 7,702 4.6 4.6 (4.4, 4.7)
Larynx 7,615 48.8 78.5 (73.4, 83.2) 732 46.3 62.1 (49.4, 74.9)
Lung 72,446 7.6 7.6 (7.6, 7.7) 23,346 8.9 8.9 (8.7, 9.1)
Breast 325 60.6 126.7 (110.3, -) 47,673 65.5 NA
Cervix uteri - - - 42,313 75.5 NA
Corpus uteri - - - 5,136 65.0 NA
Ovary - - - 10,050 51.8 123.0 (108.9, 141.7)
Prostate 10,113 44.6 58.2 (56.4, 60.4) - - -
Testis 1,067 74.4 NA - - -
Kidney 7,173 49.8 119.4 (110.5, 126.0) 3,462 54.8 NA
Bladder 13,592 55.3 117.8 (111.0, 124.6) 3,378 50.8 102.5 (89.4, 120.5)
Brain & CNS 5,282 20.2 20.2 (18.9, 21.9) 4,294 23.7 23.7 (21.7, 26.2)
Thyroid 3,923 68.7 NA 22,787 71.3 NA
NHL 9,560 37.9 41.4 (38.3, 45.7) 6,455 43.0 67.4 (60.3, 77.8)
Leukemia 8,729 16.2 16.2 (15.4, 16.9) 6,810 16.1 16.1 (15.2, 17.2)
All other cancers 29,618 20.4 20.4 (19.5, 21.1) 24,791 36.0 36.0 (34.3, 38.0)
All cancers except skin 438,736 16.0 16.0 (15.8, 16.1) 334,057 44.2 79.5 (77.8, 81.2)
All cancers 442,436 16.3 16.3 (16.2,16.4) 337,837 44.4 81.6 (80.0, 83.3)
Table 3.Median survival and 95% confidence intervals (in months) by cancer site and gender during the period 1993-2002
CNS, Central nervous system; NHL, Non-Hodgkin’s lymphoma; NA, Not available, If more than 50% of the subjects are alive at the end of the study, then median survival cannot be computed; FU, Follow up; CI, Confidence interval.
For females, the five-year survival increased for most cancers during the same period except for pancreas and larynx.
The greatest survival improvement was observed in pro- state cancer. The five-year relative survival rate increased from 59.1% to 70.6% between 1993 and 2002. These rapid increases should be interpreted with caution. Widespread use of Prostate Specific Antigen (PSA) test in Korea may have led to diagnosis and treatment of many asymptomatic pro- state cancers that might never have been diagnosed during a man’s lifetime (14). This has led to a rapid increase in the incidence of prostate cancer, and prostate cancer became the seventh most commonly diagnosed cancer in Korean males, with more than 1,600 cases diagnosed in 2001 (15). Since the PSA test detects asymptomatic tumors possibly show- ing excellent prognosis, population-based survival rates could have increased. These trends are not an artefact, but reflect the effect of new diagnostic techniques.
In females, the greatest improvements in survival of com- mon cancers were observed in stomach and breast cancer.
Stomach and breast cancer were the most common cancers in Korean females in 2001; there were about 7,500 and 7,000 newly-diagnosed cases, respectively (15).
There were several types of cancers, showing slight decreas- es or almost no change in survival during 1993-2002. Sur- vival for pancreatic cancers fell slightly in both males and females. For lung cancer, the survival rates increased slightly over the decade. Lack of progress in early detection and treat- ment could explain no improvement in the survival rates of lung and pancreas cancers (16).
However, we should interpret the results of the present study with caution. Survival trends could be affected by var- ious factors such as completeness of registration, changes in
definition of disease, and introduction of screening programs as well as genuine improvements in diagnosis and treatment.
The validity of survival estimates may depend on com- pleteness of cancer registration (17, 18). In particular, selec- tive under-ascertainment of patients with a good prognosis may lead to underestimation of cancer patient survival, whe- reas an opposite effect could result from selective under-ascer- tainment of patients with a poor prognosis. One example of the latter case is the exclusion of DCO cases.
In our result, DCO %, an important validity index for can- cer registration data, ranges from 0.5% for the corpus uteri to 24.7% for the brain and CNS. The ‘‘true’’ survival of cases registered by DCO is generally poorer than those of others in the registry population (19). Exclusion of DCO cases may increase survival estimates, particularly in cancers with pro- portionately more DCO cases. However, the magnitude of such increases was known to be generally low (19).
Compared to the cancer survival of US, survivals of all can- cers in Korea (37.8% in males, and 57.0% in females dur- ing 1998-2002) were lower than those of US (66.3 % in males, and 56.6% in females during 1996-2002) (20). By contrast, RSRs of much more common cancers in Korea, such as stomach and cervix uteri, were much higher than those of US. Compared to the survivals of Japan, RSRs were lower than those of Japan, but the high RSRs of Japan are thought to be due to poor completeness of registration in Japan (21) (Table 4).
Considering the fact that cancer has been the leading cause of death in Korea since 1980s and newly diagnosed cancer cases are rapidly increasing, the information on survival pro- vides clinically useful information for practitioners and can- cer patients as well as for health policy makers to measure the effectiveness of cancer treatment. The publication of this report will be used to prompt more research to identify fac- tors associated with the observed increases of cancer survival in Korean population and to compare survival experience according to socioeconomic status, geographical regions, and the presence of co-morbidities.
ACKNOWLEDGMENTS
The authors appreciate the administrative help provided by the Ministry of Health and Welfare, Ministry of Govern- ment administration and Home affairs, National Statistical Office, and National Health Insurance Corporation in Korea.
REFERENCES
1. Bae JM, Won YJ, Jung KW, Suh KA, Yun YH, Shin MH, Ahn YO, Lee DH, Shin HR, Ahn DH, Oh DK, Park JG, 134 KCCR-affiliated Hospitals. Survival of Korean cancer patients diagnosed in 1995.
Cancer Res Treat 2002; 34: 319-25.
*Colon/rectum; �Uterus.
Countries Korea
(1993-1997) Korea (1998-2002)
US* (20) (1998-2002)
Japan�(21) (1993-1996) Site
Male
Stomach 43.8 50.3 22.8 59.0
Lung 10.5 12.4 13.6 18.3
Liver 10.4 14.5 9.5 17.0
Colon & rectum 56.0 61.7 66.0 72.3/65.1*
Prostate 59.1 70.6 99.9 -
All cancers 32.5 37.8 66.3 46.0
Female
Stomach 43.0 48.7 25.5 57.0
Lung 14.2 17.4 17.8 24.1
Liver 13.2 14.9 11.0 17.4
Colon & rectum 53.9 59.1 64.3 65.1/62.7*
Breast 79.6 85.0 89.0 84.6
Cervix uteri 78.7 80.4 73.3 74.3�
All cancers 53.7 57.0 65.8 50.1
Table 4.International comparison of 5-yr relative survival rates by cancer sites and sex Unit: %
2. Lee KH, Kwon Y, Lee TY. Survival rate and factors affecting sur- vival among patients of lung cancer lived in Daejeon city. Korean J Epidemiol 2003; 25: 62-75.
3. Shin HR, Won YJ, Jung KW, Kong HJ, Yim SH, Lee JK, Noh HI, Pisani P, Park JG, Ahn YO, Lee SY, Lee CW, Woo ZH, Lee TY, Choi JS, Yoo CI, Bae JM. Nationwide cancer incidence in Korea, 1999-2001; First result using the National Cancer Incidence Data- base. Cancer Res Treat 2005; 37: 325-31.
4. Parkin DM, Hakulinen T. Cancer registration: principles and meth- ods. Analysis of survival. IARC Sci Publ 1991; 95: 159-76.
5. National Center for Health Statistics. NCHS Definitions: Relative Survival Rate. Available at http://www.cdc.gov/nchs/datawh/nchs- defs/relsurvrate.htm [accessed 25 May 2006].
6. Ederer F, Heise H. Instructions to IBM 650 programmers in pro- cessing survival computations. Methodological note No. 10. End Results Evaluation Section. Bethesda MD: National Cancer Insti- tute, 1959.
7. Dickman PW. Available at http//www.pauldickman.com [accessed 07 June 2006].
8. Greenwood M. The errors of sampling of the survivorship table. In Great Britain, Her Majesty’s Stationery Office, eds. Reports on pub- lic health and medical subjects. (vol 33) London, U.K: Her Majesty’s Stationery Office; 1926.
9. Brenner H, Gefeller O. An alternative approach to monitoring can- cer patient survival. Cancer 1996; 78: 2004-10.
10. Chia KS, Du WB, Sankaranarayanan R, Sankila R, Seow A, Lee HP. Population-based cancer survival in singapore, 1968 to 1992:
an overview. Int J Cancer 2001; 93: 142-7.
11. Swaminathan R, Black RJ, Sankaranarayanan R. Database on can- cer survival from developing countries. IARC Sci Publ 1998; 145:
19-25.
12. Coleman MP, Gatta G, Verdecchia A, Esteve J, Sant M, Storm H,
Allemani C, Ciccolallo L, Santaquilani M, Berrino F; EUROCARE Working Group. EUROCARE-3 summary: cancer survival in Europe at the end of the 20th century. Ann Oncol 2003; 14 (Suppl 5): 128-49.
13. Micheli A, Mariotto A, Giorgi Rossi A , Gatta G, Muti P. The prog- nostic role of gender in survival of adult cancer patients. Eur J Can- cer 1998; 34: 2271-8.
14. Evans HS, Moller H. Recent trends in prostate cancer incidence and mortality in southeast England. Eur Urol 2003; 43: 337-41.
15. Ministry of Health and Welfare. 2001 Annual Report of National Cancer Registration, 2005.
16. Dickman PW, Adami HO. Interpreting trends in cancer patient sur- vival. J Intern Med 2006; 260: 103-17.
17. Monnet E, Faivre J, Raymond L, Garau L. Comparability of colorec- tal cancer survival data in three European population-based regis- tries. Eur J Cancer Prev 1998; 7: 127-34.
18. Prior P, Woodman CB, Collins S. International differences in sur- vival from colon cancer: more effective care versus less complete cancer registration. Br J Surg 1998; 85: 101-4.
19. Berrino F, Esteve J, Coleman MP. Basic issues in estimating and comparing the survival of cancer patients. IARC Sci Publ 1995; 132:
1-14.
20. Ries LAG, Harkins D, Krapcho M, Mariotto A, Miller BA, Feuer EJ, Clegg L, Eisner MP, Horner MJ, Howlader N, Hayat M, Han- key BF, Edwards BK, eds. SEER Cancer Statistics Review, 1975- 2003, Bethesda, MD: National Cancer Institute; 2006. Available at http://seer.cancer.gov/csr/1975_2003/ [accessed 24 November 2006].
21. Tsukuma H, Ajiki W, Ioka A, Oshima A; Research Group of Popu- lation-Based Cancer Registries of Japan. Survival of cancer patients diagnosed between 1993 and 1996: a collaborative study of popula- tion-based cancer registries in Japan. Jpn J Clin Oncol 2006; 36:
602-7.