Endocrinol Metab 2013;28:288-296
http://dx.doi.org/10.3803/EnM.2013.28.4.288 pISSN 2093-596X · eISSN 2093-5978
Original Article
Effects of Chronic Restraint Stress on Body Weight, Food Intake, and Hypothalamic Gene Expressions in Mice
Joo Yeon Jeong, Dong Hoon Lee, Sang Soo Kang
Department of Anatomy and Neurobiology, Institute of Health Sciences, Medical Research Center for Neural Dysfunction, Gyeongsang National University School of Medicine, Jinju, Korea
Background: Stress affects body weight and food intake, but the underlying mechanisms are not well understood.
Methods: We evaluated the changes in body weight and food intake of ICR male mice subjected to daily 2 hours restraint stress for 15 days. Hypothalamic gene expression profiling was analyzed by cDNA microarray.
Results: Daily body weight and food intake measurements revealed that both parameters decreased rapidly after initiating daily restraint stress. Body weights of stressed mice then remained significantly lower than the control body weights, even though food intake slowly recovered to 90% of the control intake at the end of the experiment. cDNA microarray analysis revealed that chron- ic restraint stress affects the expression of hypothalamic genes possibly related to body weight control. Since decreases of daily food intake and body weight were remarkable in days 1 to 4 of restraint, we examined the expression of food intake-related genes in the hypothalamus. During these periods, the expressions of ghrelin and pro-opiomelanocortin mRNA were significantly changed in mice undergoing restraint stress. Moreover, daily serum corticosterone levels gradually increased, while leptin levels significantly decreased.
Conclusion: The present study demonstrates that restraint stress affects body weight and food intake by initially modifying ca- nonical food intake-related genes and then later modifying other genes involved in energy metabolism. These genetic changes appear to be mediated, at least in part, by corticosterone.
Keywords: Restraint stress; Body weight; Eating; Hypothalamus; Microarray
INTRODUCTION
Stress is well known to change body weight and food intake in animal models. Of the various stress models available for the study of the effects of stress, the restraint stress model is most commonly employed, as it effectively mimics potent physical and psychological stress [1]. The restraint stress model has also been used as an animal model of depression and anorexia nervosa. Thus, many studies have shown that restraint stress
suppresses body weight gain and food intake in rodents [2,3].
The central regulation of body weight and food intake oc- curs in the hypothalamus, which contains multiple neuronal systems that play important roles in the regulation of energy homeostasis [4]. These systems involve the interaction of mul- tiple neuropeptides. Food intake reflects a functional balance between hypothalamic orexigenic peptides (such as neuropep- tide Y [NPY] and agouti-related protein [AgRP]) and anorexi- genic peptides (such as pro-opiomelanocortin [POMC] and
Received: 1 April 2013, Accepted: 9 August 2013 Corresponding author: Sang Soo Kang
Department of Anatomy and Neurobiology, Gyeongsang National University School of Medicine, 15 Jinju-daero 816beon-gil, Jinju 660-751, Korea Tel: +82-55-772-8033, Fax: +82-55-772-8039, E-mail: [email protected]
Copyright © 2013 Korean Endocrine Society
This is an Open Access article distributed under the terms of the Creative Com- mons Attribution Non-Commercial License (http://creativecommons.org/
licenses/by-nc/3.0/) which permits unrestricted non-commercial use, distribu- tion, and reproduction in any medium, provided the original work is properly cited.
pISSN 2093-596X · eISSN 2093-5978
cocaine- and amphetamine-regulated transcript [CART]) [5].
In addition, ghrelin, a peptide that is predominantly produced by the stomach, is also expressed by the hypothalamus and regulates growth hormone secretion, food intake, and energy homeostasis [6,7]. Another factor that regulates food intake and energy homeostasis is leptin, an anorexigenic hormone se- creted by adipose tissue [8]. Leptin is well known for its criti- cal role in the regulation of food intake in adult mammals.
Furthermore, leptin participates in the control of several neu- roendocrine functions, including those of the hypothalamic- pituitary-adrenal (HPA) axis. In response to the nutritional sta- tus and energy storage levels, leptin signals hypothalamic feeding centers by controlling the expression and release of orexigenic and anorexigenic neuropeptides [9,10].
Chronic stress increases serum corticosterone levels. How- ever, the effects of chronic stress-induced elevated corticoste- rone on food intake and body weight are not clear [11]. Fur- thermore, the precise mechanism by which stress affects ener- gy metabolism as well as food intake and body weight control is not well understood, especially at the hypothalamic gene expression level. In this study, to identify the central genes that regulate body weight and food intake and to characterize the molecular mechanisms involved, we extensively analyzed the hypothalamic gene expression profiles of chronically re- straint stressed mice using large-scale cDNA microarray anal- ysis.
METHODS
Animals and restraint stress
Male 7-week-old ICR mice were purchased from Central Lab- oratory Animal Inc. (Seoul, Korea) and housed individually in clear plastic cages in a temperature- and humidity-controlled environment under a 12 hours light/dark cycle (light on at 0600 hour) with free access to lab chow and water. The experi- ments were performed after the animals had been habituated to the experimental environment for 1 week. The mice were divided into two weight-matched (31 to 33 g) groups, controls, and stressed mice. The stressed mice were exposed daily for 15 days to 2 hours of restraint (0930 to 1130 hours) in an acrylic cylindrical animal restrainer (Φ25×[H] 85 mm, Dae- jong Instrument Industry, Seoul, Korea) with holes that permit the restrainer to be adjusted according to the size of the sub- ject. The restrainer allows unlimited breathing but restricts the movement of the limbs. After being restrained, the mice were returned to their home cage and given food and water ad libi-
tum. The food consumption and body weight of the mice were monitored daily (0830 to 0900 hours). All animal procedures adhered to the Animal Care and Use Guidelines of Gyeongsang National University (Approval No., GLA-060502-M0002 and GLA-070802-M0035).
Preparation of hypothalamic RNAs
One day after stress ended, days 1 to 5 or day 16 (depending on the experiment), the animals were sacrificed and their hy- pothalami were rapidly extracted (0930 to 1130 hours). Total RNA was isolated using TRIzol reagent (Invitrogen, Carlsbad, CA, USA). The purity and quantity of the RNAs were assess ed by spectrophotometry.
Microarray analysis
Gene expression analysis was conducted on the day 16 hypo- thalamic mRNAs using the Agilent Mouse oligo microarray kit (Digital Genomics, Seoul, Korea). The scanned images were analyzed with GenePix Pro 6.0 software (Axon Instruments, Union City, CA, USA) to obtain gene expression ratios. The transformed data were normalized by LOWESS regression and analyzed using GeneSpring GX 7.3 software program (Agilent Technologies Inc., Santa Clara, CA, USA).
Elevated plus maze
The elevated plus maze (EPM) has two open arms and two closed arms (30×7 cm each) and a connecting central plat- form (7×7 cm) mounted 50 cm above the floor. Tested mice were placed in the center of the maze facing the open arm, and behavior was recorded for 5 minutes. Arm entry was scored if a mouse moved into the arm.
Measurements of serum corticosterone and leptin levels To measure the basal levels of serum corticosterone and leptin, blood was collected the morning after stress via decapitation.
Serum corticosterone and leptin concentrations were deter- mined using an EIA kit (Assay Designs Inc., Ann Arbor, MI, USA) and an ELISA kit (Millpore, St Charles, MO, USA), re- spectively.
Reverse transcriptase polymerase chain reaction
For the day 0 to 4 samples of 16 hypothalamic mRNAs, a M-MLV RT kit (Promega, Madison, WI, USA) was used to convert the RNAs (1 μg) to cDNAs. The ghrelin and POMC mRNA levels were then determined using a real-time polymerase chain reaction (PCR) kit (LightCycler FastStart DNA Master SYBR Green I,
Roche Applied Science, Mannheim, Germany) with the following primers: ghrelin (292 bp) forward, 5’-CAGTTTGCTGCTACT- CAG-3’, reverse, 5’-GATATCCTGAAGAAACTTCC-3’;
POMC (497 bp) forward, 5’-ATGCCGAGATTCTGCTAC-3’, reverse, 5’-AGCTCCCTCTTGAACTCT-3’; glyceraldehyde- 3-phosphate dehydrogenase (GAPDH; 172 bp) forward, 5’-TG CCGCCTGGAGAAACCTGC-3’, reverse, 5’-TGAGAG- CAATGCCAGCCCCA-3’. The hydroxysteroid (17-β) dehy- drogenase 1 (Hsd17b1), cytochrome P450, family 11, subfami- ly a, polypeptide 1 (Cyp11a1), glycoprotein hormones, α sub- unit (Cga), and growth hormone (Gh) mRNA levels were then determined using a conventional PCR with the following prim- ers: Hsd17b1 (370 bp) forward, 5’-ACTACCTGCGTGGT- TATGAG-3’, reverse, 5’-TGGTAACATGAATTGTCCTG-3’;
Cyp11a1 (375 bp) forward, 5’-CCAAGATGGTACAGTTG- GTT-3’, reverse, 5’-CATCACGGAGATTTTGAACT-3’; Cga (317 bp) forward, 5’-AGCTAGGAGCCCCCATCTAC-3’, re- verse, 5’-GCGTCAGAAGTCTGGTAGGG-3’; Gh (255 bp) for- ward, 5’-TTCTGCTTCTCAGAGACCAT-3’, reverse, 5’-TCAT AGGTTTGCTTGAGGAT-3’. The expression levels of each mRNA are presented throughout as arbitrary units.
Data analysis and statistics
Real-time PCR data were analyzed by LightCycler software ver- sion 4.0 (LightCycler 2.0 Instrument, Roche Applied Science).
Conventional PCR data were analyzed by Gel Doc (Bio-Rad, Hercules, CA, USA) and Quantity One version 4.6.3. Messenger RNA levels were normalized to the levels of the GAPDH refer- ence gene. EPM test were analyzed using a computerized vid- eo-tracking system (EthoVision version 3.0, Noldus Informa- tion Technology, Wageningen, the Netherlands). Statistical analysis were performed using Student unpaired t test and one or two-way analysis of variance (GraphPad Prism, La Jolla, CA, USA). All data are shown as mean±SE.
RESULTS
Effects of restraint stress on body weight and food intake The effects of daily restraint stress for 15 days on body weight and food intake shown in Fig. 1. While the body weights of the control mice gradually increased over the 15 day experi- ment, the body weights of the stressed mice dropped sharply during the first 5 days. As a result, the stressed mice had sig- nificantly lower body weights than the control mice during the entire experimental period (Fig. 1A).
The total food intake of the stressed mice also decreased
Fig. 1. Effects of restraint stress on body weight, food intake, serum corticosterone, and anxiety level. (A) Daily body weight and (B) food intake of mice exposed daily to 2 hours of restraint for 15 con- secutive days. (C) Serum corticosterone levels were significantly in- creased in stressed mice (STR) at the end of the restraint stress peri- od. (D) Stressed mice showed a significant reduction in frequency of open arm entry in the elevated plus maze test. Statistical differences were evaluated by (A, B) two-way analysis of variance and (C, D) Student unpaired t test. Data are presented as mean±SE. aP<0.05;
bP<0.01 vs. control mice (CTL) (n=10 in each group).
40
30
0 35
0 1 2 3 4 5 6 7 8 9 10 11 12 13 14 15
Body weight (g)
Day of experiment
b b b b b b b b b b b b b
b
CTLSTR Restraint
A 8
2 0 6 4
Food intake (g/day)
Day of experiment
b b b a
b
CTLSTR Restraint
0 1 2 3 4 5 6 7 8 9 10 11 12 13 14 15 B
Corticosterone (ng/mL)
CTL STR
120 100 80 60 40 20
0 C
Frequency (open arm entry)
CTL STR 20
15 10 5
0 D
C D
a b
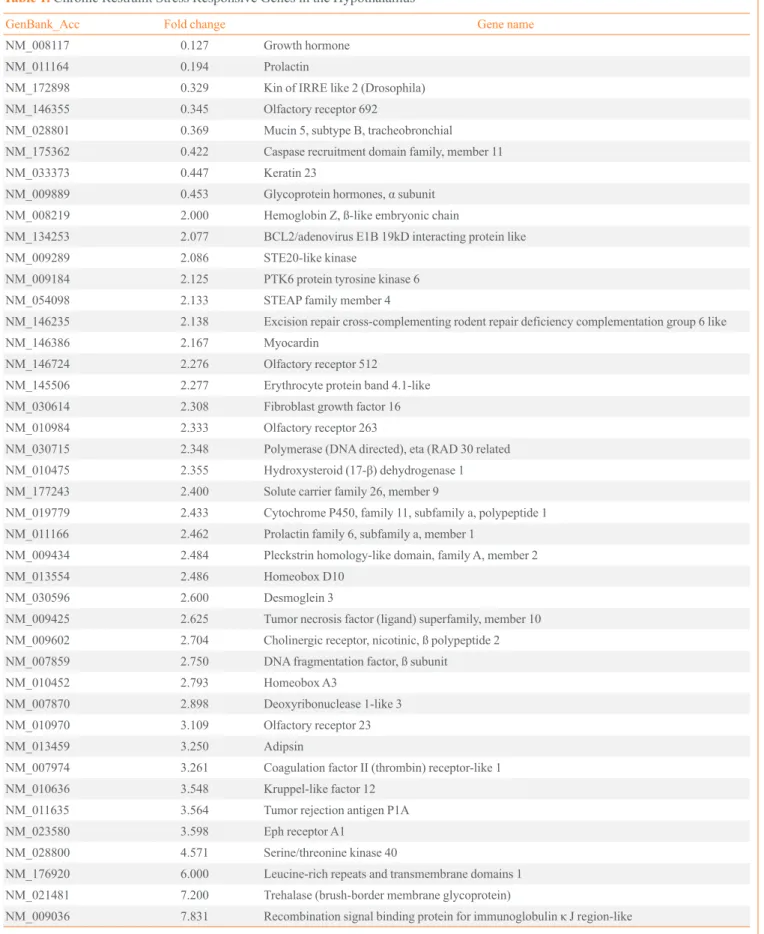
Table 1. Chronic Restraint Stress Responsive Genes in the Hypothalamus
GenBank_Acc Fold change Gene name
NM_008117 0.127 Growth hormone
NM_011164 0.194 Prolactin
NM_172898 0.329 Kin of IRRE like 2 (Drosophila)
NM_146355 0.345 Olfactory receptor 692
NM_028801 0.369 Mucin 5, subtype B, tracheobronchial
NM_175362 0.422 Caspase recruitment domain family, member 11
NM_033373 0.447 Keratin 23
NM_009889 0.453 Glycoprotein hormones, α subunit
NM_008219 2.000 Hemoglobin Z, ß-like embryonic chain
NM_134253 2.077 BCL2/adenovirus E1B 19kD interacting protein like
NM_009289 2.086 STE20-like kinase
NM_009184 2.125 PTK6 protein tyrosine kinase 6
NM_054098 2.133 STEAP family member 4
NM_146235 2.138 Excision repair cross-complementing rodent repair deficiency complementation group 6 like
NM_146386 2.167 Myocardin
NM_146724 2.276 Olfactory receptor 512
NM_145506 2.277 Erythrocyte protein band 4.1-like
NM_030614 2.308 Fibroblast growth factor 16
NM_010984 2.333 Olfactory receptor 263
NM_030715 2.348 Polymerase (DNA directed), eta (RAD 30 related NM_010475 2.355 Hydroxysteroid (17-β) dehydrogenase 1 NM_177243 2.400 Solute carrier family 26, member 9
NM_019779 2.433 Cytochrome P450, family 11, subfamily a, polypeptide 1 NM_011166 2.462 Prolactin family 6, subfamily a, member 1
NM_009434 2.484 Pleckstrin homology-like domain, family A, member 2
NM_013554 2.486 Homeobox D10
NM_030596 2.600 Desmoglein 3
NM_009425 2.625 Tumor necrosis factor (ligand) superfamily, member 10 NM_009602 2.704 Cholinergic receptor, nicotinic, ß polypeptide 2 NM_007859 2.750 DNA fragmentation factor, ß subunit
NM_010452 2.793 Homeobox A3
NM_007870 2.898 Deoxyribonuclease 1-like 3
NM_010970 3.109 Olfactory receptor 23
NM_013459 3.250 Adipsin
NM_007974 3.261 Coagulation factor II (thrombin) receptor-like 1
NM_010636 3.548 Kruppel-like factor 12
NM_011635 3.564 Tumor rejection antigen P1A
NM_023580 3.598 Eph receptor A1
NM_028800 4.571 Serine/threonine kinase 40
NM_176920 6.000 Leucine-rich repeats and transmembrane domains 1 NM_021481 7.200 Trehalase (brush-border membrane glycoprotein)
NM_009036 7.831 Recombination signal binding protein for immunoglobulin κ J region-like
markedly during the first few days of the experiment. The dai- ly food intake of the stressed mice then gradually recovered substantially. However, while food intake of the stressed mice was almost 90% of control intake by day 7, it remained signif- icantly lower at nearly every time point (Fig. 1B).
Serum corticosterone levels were measured on day 16 (with- out stress) and were significantly higher in the stressed mice (Fig. 1C). In addition, we measured anxiety levels using the EPM test. The frequency of entries in open arm was signifi- cantly lower in the stressed group (Fig. 1D). However, the fre- quency of entries into the closed arm tended to be increased compared with control group, although the difference was not significant (data not shown).
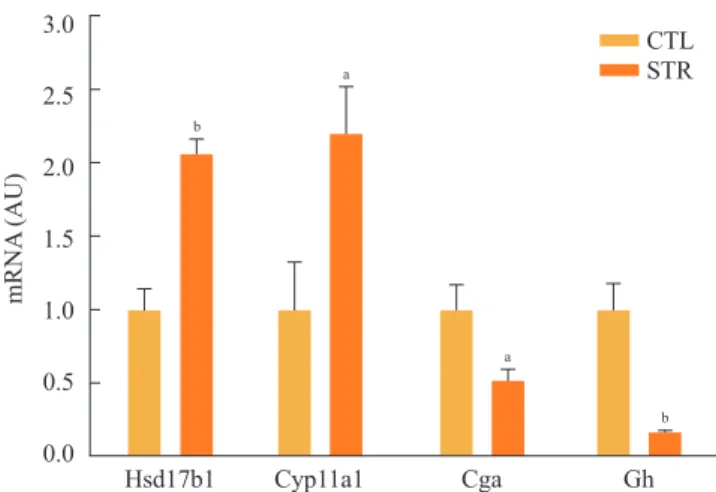
Gene expression profiles of stressed and control mice The restraint stressed or control mice (n=10 in each group) were sacrificed on day 16 without stress, and their hypotha- lamic mRNAs were subjected to large-scale cDNA microarray analysis. Among the 20,868 detected genes, 42 genes showed a significant greater than 2.0-fold increase or 0.5-fold decrease in expression in the stressed mice (Table 1). To confirm the microarray data using conventional PCR analysis, we random- ly selected four genes, two that were up-regulated and two that were down-regulated. The Hsd17b1 and Cyp11a1 mRNA lev- els were significantly increased, while the Cga and Gh mRNA levels showed a significant decrease (Fig. 2).
Effects of restraint stress on hypothalamic ghrelin and POMC mRNA expression
Chronic restraint stress reduced body weight and food intake.
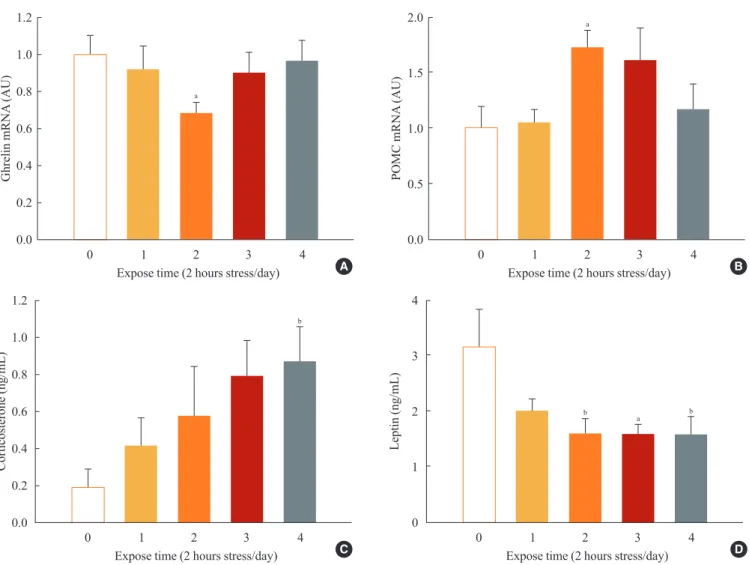
Particularly, in days 1 to 4 of restraint, food intake and body weight were dramatically decreased. Thus, we analyzed the expression of canonical food intake-related genes in this peri- od. To determine the expression of hypothalamic neuropep- tides known to be involved in energy homeostasis, such as ghrelin and POMC, the hypothalamic mRNAs from the group of mice sacrificed on each of the 4 days after initiating re- straint stress were subjected to real-time PCR analysis. On day 2 of restraint stress, the ghrelin mRNA levels showed a signif- icant decrease, while the POMC mRNA levels were signifi- cantly elevated (Fig. 3A, B).
Effects of restraint stress on serum corticosterone and leptin levels
To elucidate the changes of food intake-related hormones lev- els after stress, we collected blood from the animals daily and
measured serum corticosterone and leptin levels. Restraint stress showed gradually increasing serum corticosterone levels (Fig. 3C) and significantly decreased leptin levels on days 2 to 4 of restraint (Fig. 3D).
DISCUSSION
In the present study, we investigated the effects of restraint stress on body weight, food intake, and hypothalamic gene ex- pression levels in mice. Several studies have demonstrated that chronic exposure to restraint stress reduces the body weight and food intake of rodents [12-14]. However, the mechanisms underlying these restraint-induced changes in body weight and food intake remain to be elucidated.
Our results here showed that restraint stress rapidly induces a marked decrease in body weight that may be due to a reduc- tion of food intake. However, while food intake recovered to 90% of control intake, this was not matched by an equivalent recovery in body weight for the duration of the exposure to re- straint. The stress-induced decrease in body weight may be due initially to an early decrease in food intake but then may be subsequently maintained by increases in energy expendi- ture and body temperature during restraint [15]. Especially, a previous report has also shown that rats chronically exposed to restraint showed rapid weight loss that did not recover even
3.0 2.5 2.0 1.5 1.0 0.5 0.0
b
b
Hsd17b1
mRNA (AU)
Cyp11a1 Cga Gh
a
a
CTLSTR
Fig. 2. Reverse transcriptase polymerase chain reaction analysis of the altered gene expression identified from microarray analysis.
The levels of hydroxysteroid (17-β) dehydrogenase 1 (Hsd17b1) and cytochrome P450, family 11, subfamily a, polypeptide 1 (Cy- p11a1) mRNA were increased in stressed mice (STR), while gly- coprotein hormones, α subunit (Cga) and growth hormone (Gh) mRNA levels were decreased. Statistical difference was evaluated by Student unpaired t test. Data are presented as mean±SE.
aP<0.05; bP<0.01 vs. control mice (CTL) (n=6 in each group).
after removal of the stress [13]. Moreover, this study also showed that, while exposure to restraint stress significantly lowered food intake, once the stress ended, the food intake of the stressed group returned to the level of the control group;
there was no attempt to overeat to compensate for the energy deficiency experienced during the restraint period [13]. This may be because stress somehow modifies the pathways that would normally sense and respond to a reduction in weight. It has been reported that stress-related pathways, once activated, act in opposition to the mechanisms that would normally pro- mote the recovery of weight to normal levels [16].
Increased serum corticosterone levels are consistent with the suggestion that physiological responses to repeated stress are associated with the activation of the HPA axis [17]. Also, we showed increasing anxiety levels in the stressed mice;
chronic stress has been shown to increase anxiety and depres- sion-like behavior in animal models [18,19]. Consequently, these results indicate that chronic restraint stress changes physical and psychological responses.
To determine whether chronic restraint stress affects hypo- thalamic gene expression in the mice, we subjected the hypo- thalami of mice that had been exposed to 2 hours of restraint stress daily for 15 consecutive days to cDNA microarray anal- ysis. Many of the genes that showed stress-related changes in expression were related to body weight control. Thus, these genes such as Gh, Prolactin, Cga, STEAP family member 4, Hsd17b1, Cyp11a1, adipsin, and trehalase (see the Genbank_
Acc. No.) may participate in the chronic restraint stress-in- duced reduction of body weight, although this notion remains to be tested (Table 1).
1.2 1.0 0.8 0.6 0.4 0.2
0.0 0 1 2 3 4
Expose time (2 hours stress/day)
Corticosterone (ng/mL)
b
4 3 2 1
0 0 1 2 3 4
Expose time (2 hours stress/day)
Leptin (ng/mL)
b b
a
1.2 1.0 0.8 0.6 0.4 0.2
0.0 0 1 2 3 4
Expose time (2 hours stress/day)
Ghrelin mRNA (AU) a
2.0 1.5 1.0 0.5
0.0 0 1 2 3 4
Expose time (2 hours stress/day)
POMC mRNA (AU)
a
Fig. 3. Effects of restraint stress on hypothalamic gene expression and serum hormone levels. (A) Hypothalamic mRNA expression of ghrelin and (B) pro-opiomelanocortin (POMC) in mice exposed daily to 2 hours of restraint for 4 days. (C) Serum corticosterone and (D) leptin levels for mice exposed daily to 2 hours of restraint for 4 days. Statistical differences were evaluated by one-way analysis of vari- ance and Dunnett t test. Data are presented as mean±SE. aP<0.05; bP<0.01 vs. control mice (n=6 in each group).
A B
C D
Supporting the possible involvement of metabolism-related genes, a recent study showed that restraint stress affects lipid metabolism. In that study, rats exposed to acute or chronic re- straint stress show remarkable changes in plasma lipid and lipo- protein levels; plasma fatty acid, glycerol, and cholesterol levels are increased, while plasma triacylglyceride levels are decreased [20]. Supporting this notion is the finding that chronic restraint stress increases serum corticosterone levels, which may stimu- late the catabolism of skeletal muscle proteins, which in turn may, at least in part, lead to body weight loss [21]. Recently, psy- chological stress has been shown to attenuate body size and lean body mass by reducing muscle mass [22].
The mice that were exposed to chronic restraint stress for 15 days showed sustained reductions in body weight and food in- take. As the initial dramatic decreases in daily food intake and body weight were observed in days 1 to 4 of restraint, we hy- pothesized that canonical food intake-related genes may only participate in this period.
Thus, we analyzed the expression of food intake-related genes, such as NPY, AgRP, POMC, CART, ghrelin, corticotro- pin-releasing factor (CRF), CRF receptors, leptin receptor, in- sulin receptor, and melanocortin receptor, using real-time PCR. Only the hypothalamic mRNA expression of the ghrelin and POMC showed a significant decrease and increase on day 2, respectively. It has been shown that ghrelin is an orexigenic factor, as the central administration of ghrelin strongly stimu- lates food intake and increases body weight [23]. Moreover, when ghrelin is injected in an intracerebroventricular manner, NPY, and AgRP mRNA expressions are increased in the arcu- ate nucleus (Arc) [24]. In relation to the latter observation, hy- pothalamic ghrelin neurons are located within the Arc and in- nervate NPY/AgRP neurons [25]. Thus, it seems that the orex- igenic effect of ghrelin is dependent on NPY/AgRP neurons.
Moreover, NPY/AgRP neurons innervate POMC/α-melanocyte- stimulating hormone (α-MSH) neurons, indicating that the mela- nocortin system also seems to be involved in the action of ghre- lin [26]. It has been suggested that POMC neurons act anorexi- genically by producing and releasing α-MSH, a peptide that acti- vates melanocortin-3, -4 receptors and inhibits food intake [27].
That we observed decreased ghrelin and increased POMC mRNAs early after restraint stress initiation suggests that these proteins may be responsible, at least in part, for the initial weight loss observed after restraint stress induction.
We also observed that the serum corticosterone and leptin levels increased and decreased, respectively, in the 4 days after restraint stress was initiated. Serum leptin levels were decreased
from day 2. In another report, restraint stress decreased serum leptin levels, which were sustained even after restraint stress was eliminated [28]. Sustained reduced leptin levels may re- cover food intake, as shown in our results. During a period of chronic restraint stress, despite the nearly recovered food in- take, discrepancy in body weight between stressed and control mice was not reduced. This continued discrepancy of body weight may be possibly due to the action of increasing corti- costerone levels. Glucocorticoids have a broad range of activity that affects the expression and regulation of genes throughout the body; these glucocorticoid-mediated effects lead to changes in the energy and metabolism requirements of the organism [29]. In our study, initial loss of body weight might be caused by reduction of food intake after stress, and this finding is well match with other reports [12,30]. According to several studies, exposure to chronic stress in rats resulted in an increase in bas- al corticosterone levels [31,32]. These results probably reflect a modified sensitivity to the negative feedback effects of circu- lating glucocorticoid [33]. In addition, food intake and many metabolic processes are mediated by glucocorticoids. Thus, chronic stress has been related to changes in body weight and physiology of different organs [15,32]. In our study, serum cor- ticosterone levels were increased by repeated restraint stress.
Thus, we suggest that the increased serum corticosterone levels after restraint stress could be due to a continuous stress state.
This increased serum corticosterone level might affect discrep- ancies in body weight and food intake recovery in a direct or indirect manner. Daily increased pattern of serum corticoste- rone levels may affect the serum leptin levels. Although de- creased serum leptin levels in early days of stress seemed to have a role in the recovered food intake, the precise role of se- rum leptin and the correlation of leptin with corticosterone needs further evaluation.
In summary, restraint stress affects the body weight and food intake in mice. Chronic restraint stress-induced reduction of body weight is caused by reduction of initial daily food intake through modification of canonical food intake-related genes.
However, chronic restraint stress-induced sustained discrepan- cy of body weight without reduction of food intake may be due to expression of other genes related to body weight control and regulation of stress response through corticosterone.
CONFLICTS OF INTEREST
No potential conflict of interest relevant to this article was re- ported.
ACKNOWLEDGMENTS
This work was supported by the Korea Science and Engineer- ing Foundation (KOSEF) for the Basic Research Program (R01-2006-000-10259-0) and partially supported by the Basic Science Research Program through the National Research Foundation (NRF) of Korea, funded by the Ministry of Educa- tion, Science and Technology (R13-2005-012-02001-0).
REFERENCES
1. Glavin GB, Pare WP, Sandbak T, Bakke HK, Murison R.
Restraint stress in biomedical research: an update. Neuro- sci Biobehav Rev 1994;18:223-49.
2. Krahn DD, Gosnell BA, Majchrzak MJ. The anorectic ef- fects of CRH and restraint stress decrease with repeated exposures. Biol Psychiatry 1990;27:1094-102.
3. Dallman MF, Akana SF, Scribner KA, Bradbury MJ, Walk- er CD, Strack AM, Cascio CS. Stress, feedback and facili- tation in the hypothalamo-pituitary-adrenal axis. J Neuro- endocrinol 1992;4:517-26.
4. Woods SC, Seeley RJ, Porte D Jr, Schwartz MW. Signals that regulate food intake and energy homeostasis. Science 1998;280:1378-83.
5. Korner J, Savontaus E, Chua SC Jr, Leibel RL, Wardlaw SL. Leptin regulation of Agrp and Npy mRNA in the rat hypothalamus. J Neuroendocrinol 2001;13:959-66.
6. Tschop M, Smiley DL, Heiman ML. Ghrelin induces adi- posity in rodents. Nature 2000;407:908-13.
7. van der Lely AJ, Tschop M, Heiman ML, Ghigo E. Bio- logical, physiological, pathophysiological, and pharmaco- logical aspects of ghrelin. Endocr Rev 2004;25:426-57.
8. Proulx K, Richard D, Walker CD. Leptin regulates appe- tite-related neuropeptides in the hypothalamus of develop- ing rats without affecting food intake. Endocrinology 2002;
143:4683-92.
9. Ahima RS, Prabakaran D, Mantzoros C, Qu D, Lowell B, Maratos-Flier E, Flier JS. Role of leptin in the neuroendo- crine response to fasting. Nature 1996;382:250-2.
10. Elmquist JK, Maratos-Flier E, Saper CB, Flier JS. Unrav- eling the central nervous system pathways underlying re- sponses to leptin. Nat Neurosci 1998;1:445-50.
11. Smagin GN, Howell LA, Redmann S Jr, Ryan DH, Harris RB. Prevention of stress-induced weight loss by third ven- tricle CRF receptor antagonist. Am J Physiol 1999;276(5 Pt 2):R1461-8.
12. Marti O, Marti J, Armario A. Effects of chronic stress on food intake in rats: influence of stressor intensity and dura- tion of daily exposure. Physiol Behav 1994;55:747-53.
13. Harris RB, Zhou J, Youngblood BD, Rybkin II, Smagin GN, Ryan DH. Effect of repeated stress on body weight and body composition of rats fed low- and high-fat diets.
Am J Physiol 1998;275(6 Pt 2):R1928-38.
14. Gamaro GD, Manoli LP, Torres IL, Silveira R, Dalmaz C.
Effects of chronic variate stress on feeding behavior and on monoamine levels in different rat brain structures. Neu- rochem Int 2003;42:107-14.
15. Bhatnagar S, Vining C, Iyer V, Kinni V. Changes in hypo- thalamic-pituitary-adrenal function, body temperature, body weight and food intake with repeated social stress exposure in rats. J Neuroendocrinol 2006;18:13-24.
16. Harris RB, Palmondon J, Leshin S, Flatt WP, Richard D. C hronic disruption of body weight but not of stress peptides or receptors in rats exposed to repeated restraint stress. Horm Behav 2006;49:615-25.
17. Ottenweller JE, Servatius RJ, Tapp WN, Drastal SD, Ber- gen MT, Natelson BH. A chronic stress state in rats: effects of repeated stress on basal corticosterone and behavior.
Physiol Behav 1992;51:689-98.
18. Pardon MC, Gould GG, Garcia A, Phillips L, Cook MC, Miller SA, Mason PA, Morilak DA. Stress reactivity of the brain noradrenergic system in three rat strains differing in their neuroendocrine and behavioral responses to stress:
implications for susceptibility to stress-related neuropsy- chiatric disorders. Neuroscience 2002;115:229-42.
19. Strekalova T, Spanagel R, Dolgov O, Bartsch D. Stress-in- duced hyperlocomotion as a confounding factor in anxiety and depression models in mice. Behav Pharmacol 2005;
16:171-80.
20. Ricart-Jane D, Cejudo-Martin P, Peinado-Onsurbe J, Lo- pez-Tejero MD, Llobera M. Changes in lipoprotein lipase modulate tissue energy supply during stress. J Appl Physi- ol (1985) 2005;99:1343-51.
21. Sato T, Yamamoto H, Sawada N, Nashiki K, Tsuji M, Muto K, Kume H, Sasaki H, Arai H, Nikawa T, Taketani Y, Takeda E. Restraint stress alters the duodenal expression of genes important for lipid metabolism in rat. Toxicology 2006;227:248-61.
22. Allen DL, McCall GE, Loh AS, Madden MC, Mehan RS.
Acute daily psychological stress causes increased atrophic gene expression and myostatin-dependent muscle atrophy.
Am J Physiol Regul Integr Comp Physiol 2010;299:R889-
98.
23. Lawrence CB, Snape AC, Baudoin FM, Luckman SM.
Acute central ghrelin and GH secretagogues induce feed- ing and activate brain appetite centers. Endocrinology 2002;
143:155-62.
24. Kohno D, Gao HZ, Muroya S, Kikuyama S, Yada T. Ghre- lin directly interacts with neuropeptide-Y-containing neu- rons in the rat arcuate nucleus: Ca2+ signaling via protein kinase A and N-type channel-dependent mechanisms and cross-talk with leptin and orexin. Diabetes 2003;52:948- 56.
25. Cowley MA, Smith RG, Diano S, Tschop M, Pronchuk N, Grove KL, Strasburger CJ, Bidlingmaier M, Esterman M, Heiman ML, Garcia-Segura LM, Nillni EA, Mendez P, Low MJ, Sotonyi P, Friedman JM, Liu H, Pinto S, Colmers WF, Cone RD, Horvath TL. The distribution and mecha- nism of action of ghrelin in the CNS demonstrates a novel hypothalamic circuit regulating energy homeostasis. Neu- ron 2003;37:649-61.
26. Chan CB, Cheng CH. Identification and functional charac- terization of two alternatively spliced growth hormone se- cretagogue receptor transcripts from the pituitary of black seabream Acanthopagrus schlegeli. Mol Cell Endocrinol 2004;214:81-95.
27. Meister B. Neurotransmitters in key neurons of the hypo- thalamus that regulate feeding behavior and body weight.
Physiol Behav 2007;92:263-71.
28. Harris RB, Mitchell TD, Simpson J, Redmann SM Jr, Youngblood BD, Ryan DH. Weight loss in rats exposed to repeated acute restraint stress is independent of energy or leptin status. Am J Physiol Regul Integr Comp Physiol 2002;282:R77-88.
29. Levine S. Developmental determinants of sensitivity and resistance to stress. Psychoneuroendocrinology 2005;30:
939-46.
30. Marti O, Harbuz MS, Andres R, Lightman SL, Armario A.
Activation of the hypothalamic-pituitary axis in adrenalec- tomised rats: potentiation by chronic stress. Brain Res 1999;
821:1-7.
31. Bhatnagar S, Dallman M. Neuroanatomical basis for facili- tation of hypothalamic-pituitary-adrenal responses to a novel stressor after chronic stress. Neuroscience 1998;84:
1025-39.
32. Dal-Zotto S, Marti O, Armario A. Influence of single or re- peated experience of rats with forced swimming on behav- ioural and physiological responses to the stressor. Behav Brain Res 2000;114:175-81.
33. Mizoguchi K, Yuzurihara M, Ishige A, Sasaki H, Chui DH, Tabira T. Chronic stress differentially regulates glucocorti- coid negative feedback response in rats. Psychoneuroendo- crinology 2001;26:443-59.