고주파열치료(Radiofrequency Ablation)는 간기능저하 등으 로 인해 절제가 어려운 악성간암치료에서 우수한 국소치료효 과를 보인다(1-8). 이 고주파열치료의 치료목표는 종양뿐만 아니라 종양 주변의 0.5-1 cm의 주변 정상조직까지 완전히 제거하여 안전연을 확보하는 것이다(2-8). 따라서 종양이 완 전히 제거되었는지 혹은 부가적인 치료가 필요한지 적합한 영 상으로 정확한 진단을 하는 것이 중요하다. 고주파열치료 후에 남아있는 혹은 국소재발한 종양의 조기발견은 성공적인 치료 를 결정하는 데 있어 매우 중요하다(9-13). MR 영상을 이용 한 고주파열치료 후에 남아있는 혹은 국소 재발한 종양평가는 주로 T2 강조영상과 Gadolinium조영증강 영상을 통해 이루어 져 왔지만 종양을 정확히 나타내는 것은 쉽지 않았다(11, 12).
Ferumoxides와 같은 초상자성산화(Superparamagnetic
iron oxide, 이하 SPIO) 제제는 간특이MR조영제로 철산화물 로 만들어진 초미소립자약물이다. SPIO제제는 간쿠퍼 (Kupffer)세포를 포함한 세망내피계 (Reticuloendothelial System, 이하 RES)에 주로 흡수되어 제거되며, 결과적으로 철 의 상자성효과에 의해 T2 강조영상에서 정상 간의 신호강도 를 감소시킨다. 대부분의 간암은 RES 를 가지지 않기 때문에 T2 강조영상에서 고신호강도를 보인다(14, 15). 최근에 새로 개 발 되 어 임 상 적 으 로 사 용 되 고 있 는 SPIO 제 제 가 Carboxydextran으로 피복된 Ferucarbotran (Resovist, Schering AG)이다. 이 조영제는 Ferumoxides 와는 달리 경 정맥으로 급속주입후 역동영상을 얻을 수 있는 장점이 있다 (16, 17). 그렇지만, Ferucarbotran 조영증강 MR 영상의 고주 파열치료 제거영역에 대한 연구는 아직 보고된 적이 없다. 따 라서 이 연구의 목적은 정상 토끼 간에서의 고주파열치료제거 영역의 Ferucarbotran 조영증강 MR 영상소견을 고식적인 T1, T2 강조영상소견과 비교하고자 하였다
정상 토끼 간에서 고주파열치료제거영역의 Ferucarbotran 조영증강MR 영상: 고식적MR 영상과의 비교1
홍성현・김승권・채승완2・곽현주・이민희・이영래・김병문・홍현표・한 헌3・이지연3
목적: 정상 토끼 간에서 고주파열치료제거영역의 Ferucarbotran 조영증강 MR 영상소견을 고 식적인 T1, T2 강조영상소견과 비교하고자 하였다.
대상과 방법: 흰 토끼 12마리에 17 G의 1 cm의 노출단을 가진 내부냉각형 침을 이용하여 고
주파제거영역을 만들었다. 고주파열치료는 최대출력을 30와트로 3분간 시행하였다. 시술 직후, 시술 후 3일, 2주, 6주에 각각 3마리의 토끼를 희생하였다. 희생 전에 T1, T2 강조영상과 Ferucarbotran 조영증강 T2* 강조영상을 얻었고 고주파열치료제거영역의 신호강도, 신호강도 의 층상형태, 고주파열치료제거영역과 정상간실질의 신호대잡음비를 비교하였다.
결과: T1, T2 강조영상에서 고주파열치료제거영역은 시간에 따라 2-4개 층의 층상형태를 나 타내었다. 그에 비해 Ferucarbotran 조영증강 T2 강조영상에서 고주파열치료제거영역은 시간 에 관계없이 모두 층상형태를 보이지 않는 고신호강도를 나타내었다. 고주파열치료제거영역과 정상간실질의 신호대잡음비는 Ferucarbotran 조영증강 T2* 강조영상(18.2±5.9)이 T1 강조 영상(1.6±1.5)과 T2 강조영상(2.7±1.9)에 비해 유의하게 높았다(p < 0.05).
결론: Ferucarbotran 조영증강 T2* 강조영상에서 고주파열치료제거영역은 층상형태가 아닌 고 신호강도로 보이며 T1, T2 강조영상 보다 유의하게 높은 병변명확도를 보인다. 따라서 Ferucarbotran 조영증강 T2* 강조영상은 T1, T2 강조영상보다 고주파열치료 후 제거영역을 좀 더 정확하고 명확하게 나타낸다.
1성균관대학교 의과대학 강북삼성병원 영상의학과
2성균관대학교 의과대학 강북삼성병원 진단병리과
3강원대학교 의과대학 진단방사선과학교실
This work was supported by Samsung Biomedical Research Institute grant (SBRI C-A4-204-1).
이 논문은 2006년 1월 15일 접수하여 2006년 3월 2일에 채택되었음.
대상과 방법 실험 동물
실험동물은 체중 3.2-3.9 kg(평균, 3.4 kg)의 건강한 뉴질 랜드산 흰 토끼 수컷 12마리를 사용하였다. 토끼는 MR 영상 촬영시기에 따라 다음과 같이 4개의 소 군으로 나누었다. 고주 파열치료 직후 2시간 이내 MR 촬영군, 3일 후에 촬영군(급 성), 2주 후 촬영군(아급성), 6주 후 촬영군(만성)으로 나누었 고 각각 예정된 시간에 MR 영상촬영 후 희생시켰다.
수술
토끼는 케타민(ketamine hydrochloride, 유한양행, 서울, 한 국) 50 mg/kg 과 럼푼(xylazine hydrochloride; Bayer Korea, 서울, 한국) 5 mg/kg을 근육 주사하여 마취를 유도하였고, 마 취의 유지를 위해 케타민 25 mg/kg을 추가로 근육 주사하였 다. 적절한 마취 후 토끼의 복부와 등쪽 털을 제거한 후 접지 패드를 등쪽으로 부착하였다. 흉골 끝에서 배꼽까지 정중선으 로 개복한 후 간을 노출하였다.
고주파열치료
실험에 사용된 전극침은 직경이 17 G인 1 cm의 노출 금속 단을 가진 내부냉각 단일형침(Radionics, Burlington, MA, U.S.A.)을 사용하였고, 고주파발생기(Series CC-1; Radionics, Burlington, MA, U.S.A.)는 최대출력이 200 W인, 480 kHz 의 발생기를 사용하였다.
전극침의 삽입은 Acuson 128 XP/10(Acuson, Mountain View, CA. U.S.A.)의 7 MHz 선형탐촉자 유도하에 시행하였 다.
전극침은 내부에 두 개의 내강이 있어 그 한곳으로는 냉각 수가 유입되고 다른 곳으로는 더워진 유출수가 순환 가능하도 록 설계되었다. 전극침의 내부냉각을 위하여 순환펌프 (Watson-Marlow, Medford, MA, U.S.A.)를 이용하여 0℃의 생리식염수를 10-2 5mL/min 의 속도로 유지되도록 함으로서 전극침의 온도가 20-25℃로 유지되도록 하였다. 고주파열치 료는 최대출력을 30와트로 3분간 시행하였다.
MR 영상
MR 영상은 1.5 T 초전도형 MR 영상기기(Gyroscan Intera, Philips Medical Systems, Best, Netherlands)를 사용하였고, 코일은 무릎 코일을 사용하였다. 고주파열치료직후 두 시간 이 내, 시술 후 3일, 2주, 6주에 각각 MR 영상을 얻었다. 조영제 는 Ferucarbotran(Resovist, SH U 555 A, Schering AG, Berlin, Germany) 0.3 mL를 사용하였다. 토끼 귀정맥에 22 G 도관을 삽입하고 수액 라인을 연결한 후 조영제는 라인을 통 해 5 μm 특수 필터를 이용하여 1초 내에 급속주입하였다. 조 영제주입 후 생리식염수 10 mL 를 추가로 주입하여 수액 라
T2강조스핀에코기법(TR/TE=4045/100)을 횡단영상을 얻었 다. 조영제주입 후 6-10분 사이에 T2*강조고속필드에코기법 (fast field echo) (TR/TE=453.3/13.8, flip angle=18°)을 얻 었다. 영상두께는 3 mm, 영상간격은 1 mm, 격자수는 256×
256, FOV는 16×16 cm 이였다.
MR 영상분석 정성분석
조영 전 T1, T2 강조영상과 Ferucarbotran 조영증강 T2*
강조 MR 영상 분석은 두 명의 영상의학과 의사의 합의하에 하 였다. 고주파열치료 제거영역의 신호강도, 신호강도의 층상 형 태를 분석하였다.
정량분석
한 명의 영상의학과 의사가 PACS 모니터에서 T1, T2 강조 영상, Ferucarbotran 조영증강 T2*강 영상에서 정상간실질, 고 주파열치료제거영역, 배경잡음에 대한 신호강도를 측정하였다.
정상간실질의 신호강도를 구하기 위해 국소신호강도 변화가 없 는 부위에 큰 혈관과 영상인공물(artifact)을 피하여 관심영역 을 설정하였다. 부분용적인공물(Partial volume artifact)을 피 하기 위해 1 cm 이상의 영역을 선택하였고, 배경잡음은 복벽 바깥 배경에 관심영역을 설정하였다. 관심영역은 정상 간에서 256 mm2, 고주파열치료제거영역에서 50 mm2, 배경잡음에서 256 mm2이상으로 설정하였고, 각각 세 번 이상 구하여 평균 값을 얻었다.
고주파제거영역과 간실질의 신호대잡음비(contrast-to- noise ratio)는 다음의 공식으로 산출하였다. 고주파제거영역과 간실질의 신호대잡음비(contrast-to-noise ratio)는 고주파제 거영역의 명확도를 객관적으로 나타낸다.
공식; 고주파열치료제거영역의 신호강도-간실질의 신호강도 /배경잡음의 표준편차
병리표본제작 및 MR 영상과의 비교
고주파열치료시행 직후, 3일, 2주 그리고 6주에 각각 3마리 의 토끼에 대해 MR 영상을 시행한 후 케타민을 정맥주사로 과 량주입하여 희생시킨 후 개복하여 간을 적출하였다. 적출된 간 은 병리표본제작을 위해 10% 희석포르말린용액에 24시간 이 상 고정하였다. 포르말린에 고정된 간은 MR 단면과 유사하게 5 mm 두께로 절제하였으며, 육안사진촬영을 하였다. 조직은 최종적으로 파라핀 절편 후 표준슬라이드유리를 사용하여 조 직표본을 제작한 다음 Hematoxylin-eosin 염색을 하여 광학 현미경으로 한 명의 병리과 의사가 관찰하였다. 고주파열치료 제거영역을 기존의 보고에 따라 세 가지 영역(중심부, 중간부, 경계부)으로 구분하였고 병리소견과 MR 영상을 비교하였다 (18).
통계분석
test)와 함께 one-way analysis of variance (ANOVA) 를 이 용하여 비교하였다.
결 과
T1, T2 강조영상에서 고주파열치료제거영역은 시간에 따라 2-4개 층의 층상 형태를 나타내는 데 비해 Ferucarbotran 조 영증강 T2* 강조영상에서는 시간에 관계없이 모두 층상형태 가 없는 고신호강도로 보였다.
고주파열치료 직후 시행한 MR 영상에서 제거영역은 조영 전 T1, T2 강조 영상에서 3층의 층상형태를 나타냈지만 Ferucarbotran 조영증강 T2*강조 영상에서는 3층 모두 고신 호강도를 나타내었다(Fig. 1).
고주파열치료 3일 후 시행한 급성기의 MR 영상에서는 T1, T2 강조영상에서 3-4층의 층상 형태를 나타내었다. 조영 전 T2 강조영상과 병리소견을 비교할 때, 안쪽에서부터 저-고- 저-고 신호 강도의 4층에 해당하는 부위는 병리조직에서 중 심응고괴사-염증세포침윤 및 세포 괴사-응고괴사-섬유화가 시작되는 부위에 해당하였다. 이에 반해 Ferucarbotran 조영 증강 T2*강조영상에서는 경계부의 섬유화가 시작되는 부위를 포함한 전 층이 고신호강도를 나타내었다(Fig. 2).
고주파열치료 2주, 6주 후에 시행한 아급성, 만성기의 MR 영상에서는 T1, T2 강조영상에서 2-3층의 층상형태를 나타 내었다. 경계부의 섬유화형성부위는 T1 강조영상에서 저신호
강 도 , T2 강 조 영 상 에 서 고 신 호 강 도 를 나 타 내 었 고 Ferucarbotran 조영증강 T2*강조영상에서는 경계부의 섬유화 형성부위까지 포함하여 모두 고신호강도를 나타내었다(Fig 3, 4).
고주파열치료제거영역의 T1, T2 강조영상, Ferucarbotran 조영증강 T2*강조 영상에서의 간실질, 고주파열치료제거영역, 고주파열치료제거영역과 간실질의 신호대잡음비의 평균값은 Table 1과 같다. 고주파열치료제거영역과 간실질의 신호대잡 음비는 Ferucarbotran 조영증강 T2* 강조영상(18.2±5.9)이 T1 강조영상(1.6±1.5)과 T2 강조영상(2.7±1.9)에 비해 유 의하게 높았다(p < 0.05).
고 찰
고주파열치료 후 치료효과는 적합한 영상으로 정확히 진단 하는 것이 매우 중요하며, 현재 치료효과를 진단하는데 조영증 강 CT가 가장 많이 사용되고 있다. 고주파열치료 후 추적 CT 에서 성공적으로 제거된 종양은 제거영역과 경계부에 국소 조 영증강이 없는 저음영을 나타낸다. 추적 CT 에서 제거영역주 변으로 국소 조영증강되는 병변이 있을 때 남아 있는 혹은 재 발한 종양을 의미할 수 있다. 하지만, 조영증강 CT 에서 제거 영역주변부의 반응성과혈류(reactive hyperemia)로 인해 조영 증강이 나타날 수도 있다. 이는 열손상에 의한 염증반응에 의 한 것이며, 고주파열치료 후에 흔히 나타난다. 이러한 제거영
A B
Fig. 1. MR imaging immediately obtained after RF ablation A, B. T1-weighted (A) and T2-weighted (B) images show three laminar patterns of signal intensities (high-low-high from the central zone) in RF ablation zone (arrows).
C. Ferucarbotran-enhanced T2*WI shows high signal intensity without distinct laminar pattern in RF ablation zone (arrows).
C
A B
C D
E F
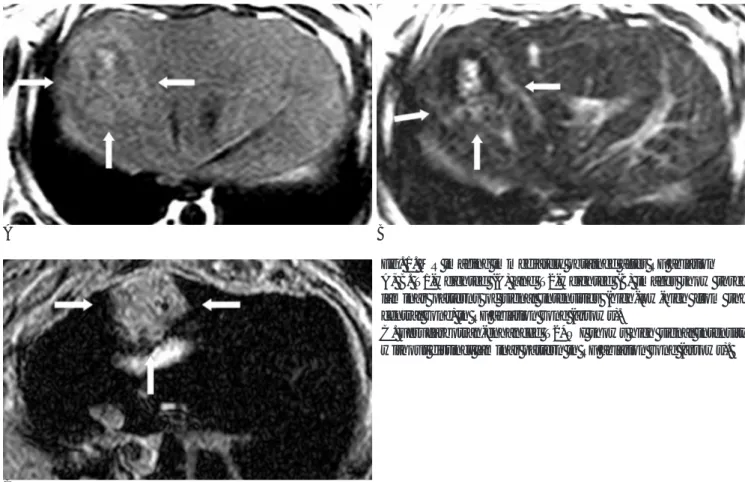
Fig. 2. MR imaging obtained 3 days after RF ablation
A, B. T1-weighted (A) shows three laminar patterns of signal intensities (low-high-low signal intensities from the central zone) and T2-weighted (B) image shows four laminar patterns of signal intensities (low-high-low-high signal intensities from the central zone) in RF ablation zone (arrows).
C. Ferucarbotran-enhanced T2*WI shows high signal intensity without distinct laminar patterns in RF ablation zone (arrows) in- cluding early fibrosis (d on figure F).
D. Gross specimen, E. Microscopic examination (H & E staining, X 1) and F. Microscopic examination (H & E staining, X 40) reveals four laminar patterns. (a) central coagulation necrosis, (b) neutrophil infiltration, (c) coagulation necrosis, (d) early fibrosis.
A B
C D
E F
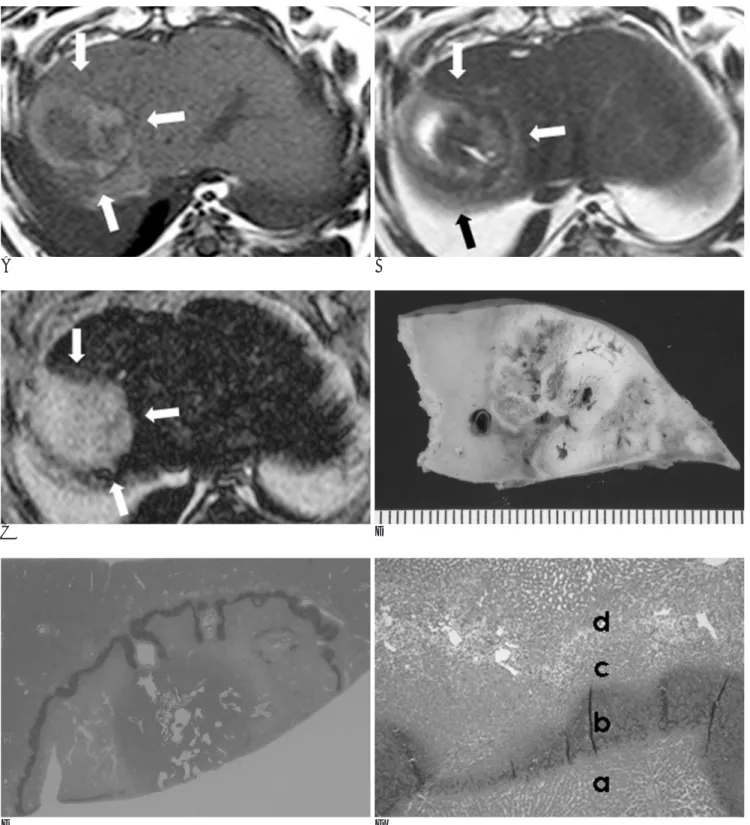
Fig. 3. MR imaging obtained 2 weeks after RF ablation.
A, B. T1-weighted image (A) shows three laminar patterns of signal intensities (low-high-low signal intensities from the central zone) and T2-weighted (B) image shows three laminar patterns of signal intensities (high-low-high signal intensities from the central zone) in RF ablation zone (arrows).
C. Ferucarbotran-enhanced T2*WI shows high signal intensity without distinct laminar patterns in RF ablation zone (arrows) in- cluding fibrous tissue (b on figure D to F).
D. Gross specimen, E. Microscopic examination (H & E staining, X 1) and F. Microscopic examination (H & E staining, X 40) reveals central coagulation necrosis (a) and fibrous tissue (b) in RF ablation zone.
A B
C D
E F
Fig. 4. MR imaging obtained 6 weeks after RF ablation
A, B. T1-weighted image (A) shows three laminar patterns of signal intensities (low-iso-low signal intensities from the central zone) and T2-weighted (B) image shows three laminar patterns of signal intensities (high-low-high signal intensities from the central zone) in RF ablation zone (arrows).
C. Ferucarbotran-enhanced T2*WI shows high signal intensity without distinct laminar patterns in RF ablation zone (arrows) in- cluding fibrous tissue (b on figure D to F).
D. Gross specimen, E. Microscopic examination (H & E staining, X 1) and F. Microscopic examination (H & E staining, X 100) re- veals central coagulation necrosis (a) and fibrous tissue (b) in RF ablation zone.
역 주변의 반응성과혈류는 종양 치료효과에 대한 판단을 어렵 게 한다(9-11).
역동 Gadolinium조영증강 MR 영상은 고주파열치료 후 치료 효과를 진단하는데 또한 유용하게 이용되고 있다. 조영증강 CT 에서와 마찬가지로 Gadolinium 조영증강 MR 영상에서 성공적 으로 제거된 종양은 제거영역과 경계부에 조영증강되는 국소 병변이 남아있지 않아야 한다. 조영증강 되는 국소병변이 있을 때는 남아있는 종양이나 재발한 종양을 의심할 수 있지만, 고 주파열치료 제거영역주변에 생기는 육아조직이나 염증반응 혹 은 미세동정맥단락(microscopic arteriovenous shunting)의 가 능성도 있다(11-13). MR 영상의 고주파열치료 후 치료효과 평가에 대해서는 완전 혹은 부분 괴사한 종양에서 Gadolinium 조영전후 MR 영상이 조영증강 CT 영상과 86%로 일치한다고 보고되고 있다(12). 또 다른 최근 보고에서는 국소재발간암의 조기발견에서 MR 영상이 CT 보다 우수하다고 보고되고 있다 (11).
SPIO는 간특이 MR 조영제로서 간의 RES에 흡수되어 상자 성효과에 의한 T2 이완 시간의 감소를 가져오고 이에 의해 T2 강조영상에서 정상간실질 신호 강도를 감소시켜 정상간과 병 변의 대조도를 증가시키는 효과가 있다. 어떤 연구자들은 Ferumoxides 조영증강 MR 영상이 간암을 진단하는데 있어서, 다상나선 CT 나 Gadolinium 조영증강 MR 영상보다 더 정확 하다고 보고하고 있다(15, 17). Ferucarbotran MR 조영제는 최근에 새로 개발되어 임상적으로 사용되고 있는 SPIO제제로 ferumoxides와는 달리 경정맥으로 급속주입 후 역동영상을 얻 을 수 있는 장점이 있다(16, 17).
고주파열치료제거영역의 SPIO조영증강 MR 영상에 관한 한 연구 보고가 있었는데, 이 연구에서 SPIO조영증강 MR 영상은 고주파열치료후 2주와 4주에 시행되었고, 고주파열치료제거영 역은 정상간조직에 비해 고신호강도를 나타내었다(19). 하지 만, 이 연구에서는 고주파열치료제거영역의 시간에 따른 변화 는 기술되지 않았고, T1, T2 강조영상과의 직접적인 비교는 시행되지 않았다. 그리고 고주파열치료병변의 Ferucarbotran 조영증강 MR 영상에 관한 연구는 아직 보고된 적이 없다.
Ferucarbotran 조영증강 MR 영상에서 고주파열치료제거영 역은 T1, T2 강조영상과는 달리 층상 형태가 아닌 고신호강 도를 나타내었다. 병리조직학적으로는 열치료제거영역의 경계 부인 섬유화시작부위 혹은 섬유화 형성부위 까지 포함하여 고 신호강도를 나타내었다. 따라서 Ferucarbotran 조영증강 T2*
강조영상은 기존의 Gadolinium 조영증강 MR 영상 평가에 문 제가 되었던 고주파열치료 제거영역주변에 생기는 섬유화조직, 육아조직, 염증반응 혹은 미세동정맥 단락에 영향을 받지 않고 제거영역 자체를 정확을 나타낼 수 있을 것이라 생각한다. 또 한, Ferucarbotran 조영증강 T2* 강조영상의 고주파열치료 제 거영역과 간실질의 신호대잡음비가 T1 강조영상과 T2 강조영 상에 비해 유의하게 높은 수치를 나타내었다. 이러한 결과들을 종합하여 볼 때 Ferucarbotran 조영증강 T2*강조영상은 기존 의 T1, T2 강조영상보다 고주파열치료제거영역을 보다 정확 하고 명확하게 나타낸다고 할 수 있다.
Ferucarbotran 조영증강 T2* 강조영상의 단점은 남아있는 종양이나 재발한 종양 역시 고신호강도를 나타내기 때문에 고 주파열치료 후 추적검사로의 제한점이 있다는 것이지만 Ferucarbotran 조영증강영상의 장점인 역동조영증강T1 강조 MR을 같이 시행한다면 이러한 단점이 해결될 것으로 생각하 며 고주파열치료후 치료효과의 평가에 있어 좋은 추적검사방 법이 될 것으로 생각한다.
이 연구는 몇 가지 제한점이 있다. 첫째로 종양모델을 대상 으로 시행되지 않아 고주파열치료 후 남아있는 혹은 재발한 국 소 종양의 연구가 시행되지 못하였다. 둘째로 Ferucarbotran 조영제의 장점인 역동조영증강 T1 강조영상에 대한 분석을 시 행하지 못하였다. 이 연구에서 역동조영증강 T1 강조영상을 시행하였으나 실험동물의 호흡에 의한 인공물이 심하여 정확 한 평가를 할 수 없어 분석에서 배제하였다. 셋째로 고식적인 조영 전 T1, T2 강조영상과의 비교만 시행하였고, 역동 Gadolinium 조영증강 MR 영상과의 비교는 시행하지 않았다.
따라서 역동 Ferucarbotran 조영증강 T1 강조 MR 영상과 역 동 Gadolinium 조영증강 T1 강조MR 영상과의 비교연구를 시 행하면 고주파열치료 제거영역의 치료 후 평가에 도움이 될 것 으로 기대된다.
결론적으로 Ferucarbotran 조영증강 T2* 강조영상에서 고 주파열치료제거영역은 층상 형태가 아닌 고신호강도로 보였으 며 고식적인 T1, T2강조영상 보다 유의하게 높은 병변명확도 를 보였다. 따라서 Ferucarbotran 조영증강 T2* 강조영상은 T1, T2 강조영상보다 고주파열치료 후 제거영역을 좀 더 정 확하고 명확하게 나타낸다.
Table 1. Mean Values of the SNR of the Liver Parenchyma, the SNR of the RF Ablation Zone, and the CNR of RF Ablation Zone to Liver Parenchyma on T1-weighted, T2-weighted and Ferucarbotran-enhanced T2*-weighted Images
SNR of liver parenchyma SNR of RF ablation zone CNR of RF ablation zone to liver parenchyma
T1WI 0.35±8.2 0.35±8.8 1.6±1.5
T2WI 12.5±3.5 11.6±5.7 2.7±1.9
Ferucarbotran-enhanced T2*WI 01.9±0.3 20.1±6.0 18.2±5.9*
Note.- Data are the mean±the standard deviation (SD).
RF = radiofrequency, T1WI = T1-weighted image, T2WI = T2-weighted image, SNR = signal to noise ratio, CNR= contrast to noise ratio
* The CNR of ablation zone to liver parenchyma on ferucarbotran-enhanced T2*WI was significantly higher than those of TIWI and T2WI (p < 0.05).
참 고 문 헌
1. Jiao LR, Hansen PD, Havlik R, Mitry RR, Pignatelli M, Habib N.
Clinical short-term results of radiofrequency ablation in primary and secondary liver tumor. Am J Surg 1999;177:303-306
2. Gazelle GS, Goldberg SN, Solbiati L, Livraghi T. Tumor ablation with radio-frequency energy. Radiology 2000;217:633-646 3. Goldberg SN, Gazelle GS, Dawson SL, Rittman WJ, Mueller PR,
Rosenthal DI. Tissue ablation with radiofrequency: effect of probe size, gauge, duration, and temperature on lesion volume. Acad Radiol 1995;2:399-404
4. Rossi S, Di Stasi M, Buscarini E, Quaretti P, Garbagnati F, Squassante L, et al. Percutaneous RF interstitial thermal ablation in the treatment of hepatic cancer. AJR Am J Roentgenol 1996;167:
759-768
5. Solbiati L, Ierace T, Goldberg SN, Sironi S, Livraghi T, Fiocca R, et al. Percutaneous US-guided radio-frequency tissue ablation of liver metastases: treatment and follow-up in 16 patients. Radiology 1997;202:195-203
6. Curley SA, Izzo F, Delrio P, Ellis LM, Granchi J, Vallone P, et al.
Radiofrequency ablation of unresectable primary and metastatic hepatic malignancies: results in 123 patients. Ann Surg 1999;230:1- 8
7. Livraghi T, Goldberg SN, Lazzaroni S, Meloni F, Ierace T, Solbiati L, et al. Hepatocellular carcinoma: radio-frequency ablation of medium and large lesions. Radiology 2000;214:761-768
8. Solbiati L, Goldberg SN, Ierace T, Livraghi T, Meloni F, Dellanoce M, et al. Hepatic metastases: percutaneous radio-frequency abla- tion with cooled-tip electrodes. Radiology 1997;205:367-373 9. 정우경, 임현철, 김용수, 고병희, 조온구, 서흥석 등. 간암의 고주파
열치료 후 국소재발에 관련된 인자: 나선식CT를 이용한 분석. 대한 방사선의학회지 2002;46:473-478
10. Lim HK, Choi D, Lee WJ, Kim SH, Lee SJ, Jang HJ, et al.
Hepatocellular carcinoma treated with percutaneous radio-fre-
quency ablation: evaluation with follow-up multiphase helical CT.
Radiology 2001;221:447- 454
11. Dromain C, de Baere T, Elias D, Kuoch V, Ducreux M, Boige V, et al. Hepatic tumors treated with percutaneous radio-frequency ab- lation: CT and MR imaging follow-up. Radiology 2002;223:255-262 12. Sironi S, Livraghi T, Meloni F, De Cobelli F, Ferrero C, Del
Maschio A. Small hepatocellular carcinoma treated with percuta- neous RF ablation: MR imaging follow-up. AJR Am J Roentgenol 1999;173:1225-1229
13. Kim SK, Lim HK, Kim YH, Lee WJ, Lee SJ, Kim SH, et al.
Hepatocellular carcinoma treated with radio-frequency ablation:
spectrum of imaging findings. Radiographics 2003;23:107-21 14. Weissleder R, Stark DD, Engelstad BL, Bacon BR, Compton CC,
White DL, et al. Superparamagnetic iron oxide: pharmacokinetics and toxicity. AJR Am J Roentgenol 1989;152:167-173
15. Saini S, Stark DD, Hahn PF, Bousquet JC, Introcasso J, Wittenberg J, et al. Ferrite particles: a superparamagnetic MR contrast agent for enhanced detection of liver carcinoma. Radiology 1987;162:217- 222
16. Reimer P, Balzer T. Ferucarbotran (Resovist): a new clinically ap- proved RES-specific contrast agent for contrast-enhanced MRI of the liver: properties, clinical development, and applications. Eur Radiol 2003;13:1266-1276
17. Reimer P, Jahnke N, Fiebich M, Schima W, Deckers F, Marx C, et al. Hepatic lesion detection and characterization: value of nonen- hanced MR imaging, superparamagnetic iron oxide-enhanced MR imaging, and spiral CT-ROC analysis. Radiology 2000;217:152-158 18. Tsuda M, Rikimaru H, Majima K, Yamada T, Saito H, Ishibashi T,
et al. Time-related changes of radiofrequency ablation lesion in the normal rabbit liver: findings of magnetic resonance imaging and histopathology. Invest Radiol 2003;38:525-531
19. Merkle EM, Boll DT, Boaz T, Duerk JL, Chung YC, Jacobs GH, et al. MRI-guided radiofrequency thermal ablation of implanted VX2 liver tumors in a rabbit model: demonstration of feasibility at 0.2 T. Magn Reson Med 1999;42:141-149
J Korean Radiol Soc 2006;54:515-523
Address reprint requests to : Seung Kwon Kim, M.D., Department of Radiology, Kangbuk Samsung Hospital,
Sungkyunkwan University School of Medicine, 108, Pyung-Dong, Jongro-ku, Seoul, 110-746, Korea Tel. 82-2-2001-2336 Fax. 82-2-2001-1030 E-mail: [email protected]
Ferucarbotran-Enhanced MR Imaging of the Radiofrequency Ablation Zones in the Normal Rabbit Liver:
Comparison with the Conventional MR Imaging
1Sung Hyun Hong, M.D., Seung Kwon Kim, M.D., Seoung Wan Chae, M.D.2, Hyon Joo Kwag, M.D., Min Hee Lee, M.D., Young Rae Lee, M.D., Byung Moon Kim, M.D.,
Hyun Pyo Hong, M.D., Heon Han, M.D.3, Ji Yeon Lee, M.D.3
1Department of Radiology, Kangbuk Samsung Hospital, Sungkyunkwan University School of Medicine, Seoul, Korea
2Department of Pathology, Kangbuk Samsung Hospital, Sungkyunkwan University School of Medicine, Seoul, Korea
3Department of Radiology, Kangwon National University Hospital, Gangwon, Korea
Purpose: We wanted to evaluate the findings of ferucarbotran-enhanced MR imaging of the radiofrequency (RF) ablation zones in normal rabbit livers and we compared the findings with the conventional MR imaging.
Materials and Methods: RF ablation zones were created in the livers of 12 rabbits in vivo by using a 17-gauge internally cooled electrode with 1-cm active tip, and RF energy (maximum power: 30 Watt) was applied for three minutes. Three rabbits were sacrificed immediately and then at three days, two weeks and six weeks af- ter RF ablation. Before sacrifice, the T1- and T2-weighted images (WI) and the ferucarbotran-enhanced T2*WIs were obtained and compared regarding the signal intensity of ablation zone, the laminar pattern of the signal intensity and the contrast-to-noise ratio (CNR) of the ablation zone to the liver parenchyma.
Results: On T1- and T2WIs, the RF ablation zones showed two to four laminar patterns of signal intensity ac- cording to the time. Meanwhile, on the ferucarbotran-enhanced T2WIs, the RF ablation zones showed high signal intensity without a laminar pattern regardless of time. The CNRs of the ablation zones to the liver parenchyma on the ferucarbotran-enhanced T2*WIs (18.2±5.9) were significantly higher than those of the TIWIs (1.6±1.5) and T2WIs (2.7±1.9) (p < 0.05).
Conclusion: On the ferucarbotran-enhanced T2*WI, the RF ablation zones showed high signal intensity with- out a distinct laminar pattern and significantly higher lesion conspicuity than did the conventional T1- and T2WIs. Therefore, the ferucarbotran-enhanced T2*WI shows the RF ablation zone more accurately and clear- ly than do the conventional T1- and T2WIs.
Index words :Radiofrequency (RF) ablation Liver, MR
Liver, interventional procedure Experimental study