Abstract
Table 2. The Age Distribution of Group A Table 2. The Age Distribution of Group A Table 2. The Age Distribution of Group A Table 2. The Age Distribution of Group A
Table 1. The Gender and Constitutional Distributions of Group A Table 1. The Gender and Constitutional Distributions of Group A Table 1. The Gender and Constitutional Distributions of Group A Table 1. The Gender and Constitutional Distributions of Group A
대상군 선정 대상군 선정 대상군 선정 대상군 선정 1.
1.
1.
1.
신뢰도 검증 신뢰도 검증 신뢰도 검증 신뢰도 검증 2.
2.
2.
2.
타당도 검증 타당도 검증 타당도 검증 타당도 검증 3.
3.
3.
3.
신뢰도 연구 신뢰도 연구 신뢰도 연구 신뢰도 연구 1.1.
1.1.
대상군의 일반적 특성 1)
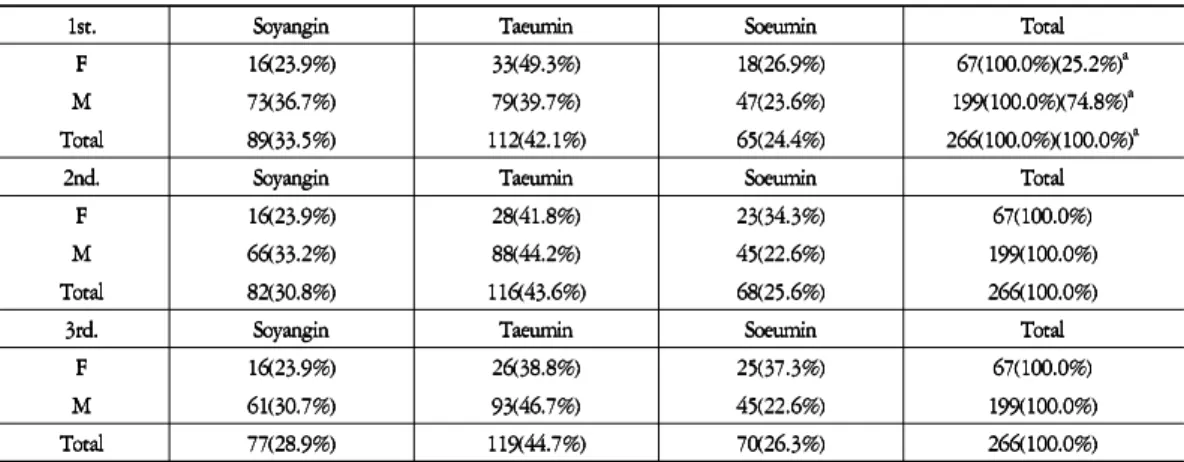
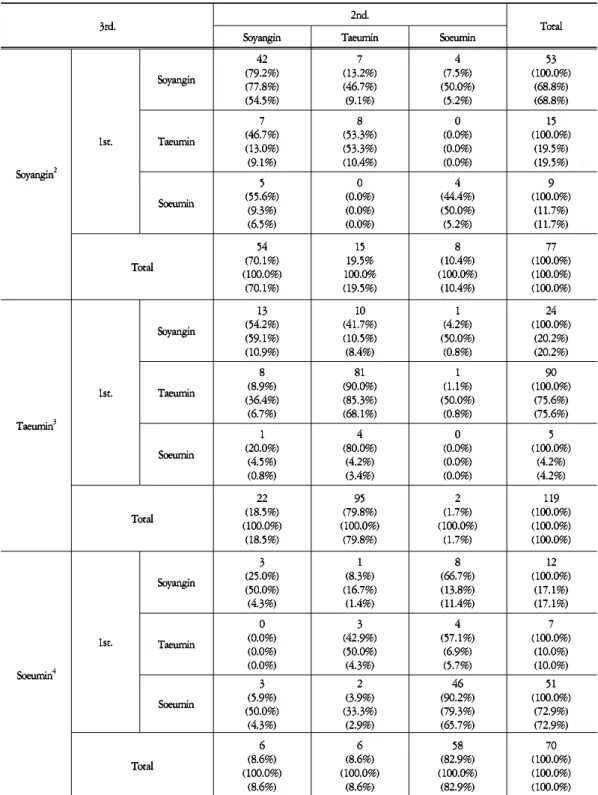
신뢰도 결과 2)
Table 3. The Result of Crosstabulation between 1st., 2nd. and 3rd Table 3. The Result of Crosstabulation between 1st., 2nd. and 3rd Table 3. The Result of Crosstabulation between 1st., 2nd. and 3rd Table 3. The Result of Crosstabulation between 1st., 2nd. and 3rd
타당도 연구 타당도 연구 타당도 연구 타당도 연구 2.
2.
2.
2.
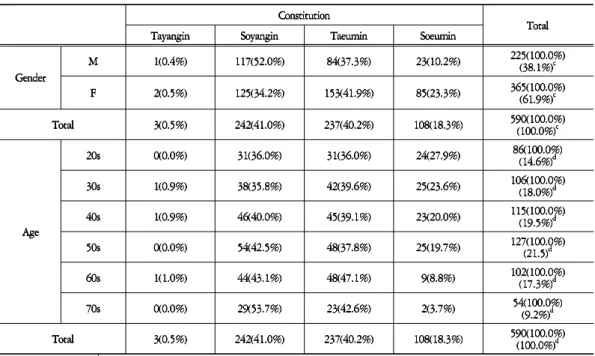
대상군의 일반적 특성 1)
타당도 2) Table 4. The General Characteristics of Group B
Table 4. The General Characteristics of Group B Table 4. The General Characteristics of Group B Table 4. The General Characteristics of Group B
κ γ χ
κ γ χ
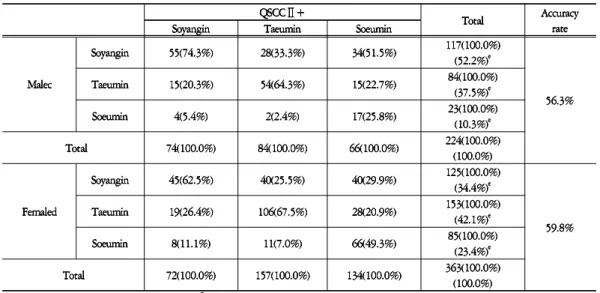
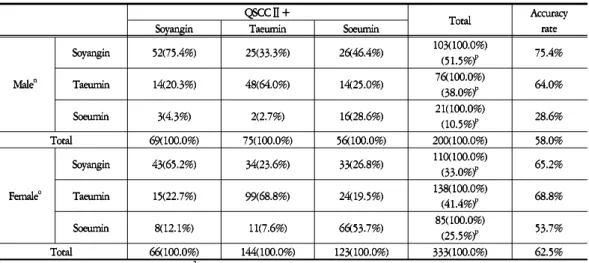
Table 6. The Diagnostic Accuracy Rate of QSCC + according to Gender Table 6. The Diagnostic Accuracy Rate of QSCC + according to Gender Table 6. The Diagnostic Accuracy Rate of QSCC + according to Gender Table 6. The Diagnostic Accuracy Rate of QSCC + according to Gender
χ κ γ
Table 5. The Diagnostic Accuracy Rate of QSCC + Table 5. The Diagnostic Accuracy Rate of QSCC + Table 5. The Diagnostic Accuracy Rate of QSCC + Table 5. The Diagnostic Accuracy Rate of QSCC +
κ γ χ
κ γ χ
κ γ χ
κ γ χ
κ γ χ
κ γ χ
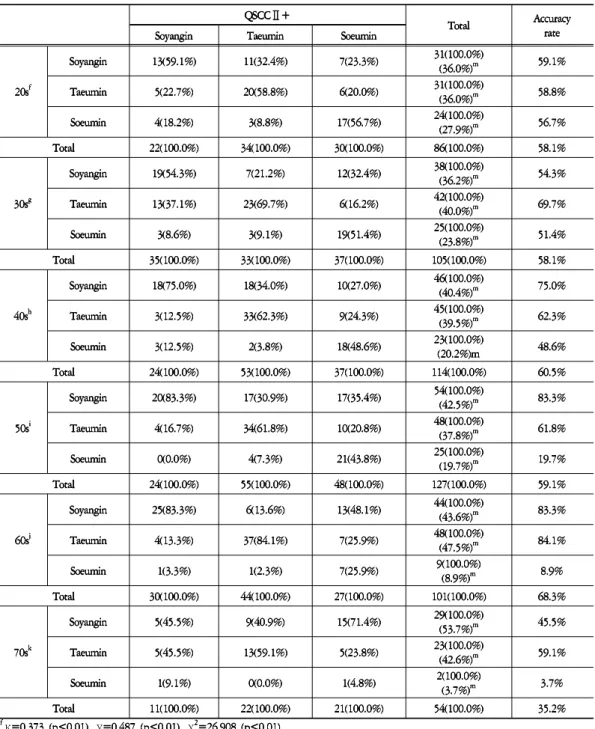
Table 7. The Diagnostic Accuracy Rate of QSCC + according to Age Table 7. The Diagnostic Accuracy Rate of QSCC + according to Age Table 7. The Diagnostic Accuracy Rate of QSCC + according to Age Table 7. The Diagnostic Accuracy Rate of QSCC + according to Age
κ γ χ
κ γ χ
Table 9. The Diagnostic Accuracy Rate of QSCC + according to Age when the Group of 70s was excluded Table 9. The Diagnostic Accuracy Rate of QSCC + according to Age when the Group of 70s was excluded Table 9. The Diagnostic Accuracy Rate of QSCC + according to Age when the Group of 70s was excluded Table 9. The Diagnostic Accuracy Rate of QSCC + according to Age when the Group of 70s was excluded
χ κ
Table 8. The Diagnostic Accuracy Rate of QSCC + when the Group of 70s was excluded Table 8. The Diagnostic Accuracy Rate of QSCC + when the Group of 70s was excluded Table 8. The Diagnostic Accuracy Rate of QSCC + when the Group of 70s was excluded Table 8. The Diagnostic Accuracy Rate of QSCC + when the Group of 70s was excluded
κ
κ κ
κ
κ κ
χ
χ