restore the posterior tibial slope as closely as possible to the anatomical condition for greater knee flexion in the posterior cruciate ligament (PCL) retaining TKA and a lesser slope in the posterior-stabilized TKA1). Posterior tibial slope affects the flexion gap, knee joint stability, and posterior femoral rollback that are associated with the range of knee joint motion2). In particular, considering that more bone resection in the anterior tibial plateau is necessary for knees with greater preoperative posterior tibial slope during posterior-stabilized TKA than PCL retaining TKA3), posterior tibial slope can affect the extension- flexion gap balance and joint line in the sagittal plane4). There is no controversy that the posterior tibial slope is correlated with flexion gap that facilitates flexion after surgery5). However, an excessive increase in the posterior tibial slope may result in abnormal anterior tibial translation, posterior instability, and anterior cam-post impingement, which can lead to ultra- high molecular weight polyethylene (UHMWPE) wear and biomechanical changes that eventually decrease the survivorship of TKA6,7). The normal posterior tibial slope has been reported to be 6o-9o8), but the optimal value has yet to be established.
The Effect of Tibial Posterior Slope on Contact Force and Ligaments Stresses in Posterior-Stabilized Total Knee Arthroplasty-Explicit Finite Element Analysis
Hwa-Yong Lee, BS
1, Sung-Jae Kim, MD, PhD
1,2, Kyoung-Tak Kang, MS
3, Sung-Hwan Kim, MD
2and Kwan-Kyu Park, MD
21Brain Korea 21 Project for Medical Science; 2Department of Orthopedic Surgery, Yonsei University College of Medicine; 3Department of Mechanical Engineering, Yonsei University College of Engineering, Seoul, Korea
This is an Open Access article distributed under the terms of the Creative Commons Attribution Non-Commercial License (http://creativecommons.org/licenses/by-nc/3.0/) which permits unrestricted non-commercial use, distribution, and reproduction in any medium, provided the original work is properly cited.
Copyright © 2012. THE KOREAN KNEE SOCIETY
www.jksrr.org
pISSN 2234-0726 · eISSN 2234-2451
Knee Surgery & Related Research
Purpose: The purpose of this study is to evaluate the effect of change in tibial posterior slope on contact force and ligament stress using finite element analysis.
Materials and Methods: A 3-dimensional finite element model for total knee arthroplasty was developed by using a computed tomography scan. For validation, the tibial translations were compared with previous studies. The finite element analysis was conducted under the standard gait cycle, and contact force on ultra-high molecular weight polyethylene (UHMWPE) and stresses on lateral and medial collateral ligaments were evaluated.
Results: The tibial translations showed similarity with previous studies. As the tibial posterior slope angle increases, the contact stress area increased and was well distributed, and the contact force on UHMWPE decreased overall. However, the maximum contact force in the case for 10o case was greater than those for others. The stresses on ligaments were the greatest and smallest in 0o and 10o cases, respectively.
Conclusions: The higher tibial posterior slope angle leads to the lower contact stress and more extensive stress distribution overall in posterior- stabilized total knee arthroscopy. However, it does not absolutely mean the smallest contact force. The stresses on ligaments increased with respect to the smaller tibial posterior slope angle.
Key words: Total knee arthroplasty, Tibial posterior slope, Contact force, Finite element method.
Received October 30, 2011; Revised December 4, 2011;
Accepted February 23, 2012.
Correspondence to: Sung-Jae Kim, MD, PhD.
Department of Orthopedic Surgery, Yonsei University College of Medicine, 50 Yonsei-ro, Seodaemun-gu, Seoul 120-752, Korea. Tel: +82-2-2228-5679, Fax: +82-2-363-6248
Email: [email protected]
Introduction
Posterior tibial slope that is created during proximal tibial resection in total knee arthoplasty (TKA) has emerged as an important factor in the biomechanics of the knee joint and postoperative clinical outcome. The common approach is to
91
debris from the articular surface is affected by a variety of factors including articulation of the joint, implant structure, and bearing material. Bartel et al.10) associated damage to the surface of tibial component with contact force on the surface of UHMWPE with the use of finite element analysis. However, there have been few domestic finite element analysis studies on the biomechanics of the articular surface of the knee and the relationship with the posterior tibial slope.
The purpose of this study was to evaluate the relationship between the posterior tibial slope (0o, 7o, 10o), the contact force, and stresses on the medial and lateral ligament during knee flexion after posterior-stabilized TKA using finite element analysis.
Furthermore, we assessed the relationship between the posterior tibial slope and damage to the surface of tibial component.
Materials and Methods
We developed finite element models of the normal knee with prosthesis in place. Computer tomography (CT) images obtained at intervals of 1 mm were processed using Mimics 14.0 (Materialise NV, Leuven, Belgium) to allow for the geometrical and structural complexity of the knee. The models were constructed in the mid-sagittal plane using the contour data of the normal femur, tibia, and patella that were obtained from 29-year-old males, who had no bone metabolism disorders, history of taking medication that may affect the bone metabolism, and trauma. Regarding the knee alignment, the anatomical femorotibial angle was in 6o extension, the mechanical axis of the femur was 0o, anatomical axis was 6o, and the varus angle was 3o. The varus angle was defined as the angle formed by the anatomical axes of the femur and the tibia. The angles formed by the distal tibial articular surface and the floor, the anatomical axis of the tibia and the mechanical axis of the knee were measured by drawing an extension line parallel to the tibial pilon. Preprocessing (modeling and mesh generation) was carried out using Hypermesh 10.0 (Altair Engineering, Troy, MI, USA), finite element analysis and postprocessing were done using
of v=0.49, and the patella with an elastic modulus of E=12 MPa and a Poisson ratio of v=0.4511). Cruciate and collateral ligaments were considered linear materials based on the neo-Hookean model12). The locations of ligaments were determined by referring to the previous studies and consultation with clinicians13,14). The tibia and fibula were fixed in terms of the movement along and rotation around the x, y, and z axes, whereas the femur and patella were left completely free under load. Anterior-posterior loads up to 100 N were applied to the center of the knee and tibial translation values were compared with those in the studies by Li et al.15,16).
2. Finite Element Model and Material Properties
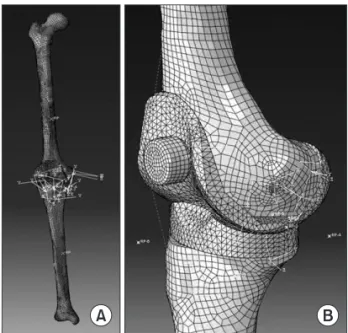
Ten-noded triangular elements were used to represent the implant bearing and femoral component. To reduce computational time in the dynamic explicit finite element analysis, the tibia and femur were modeled as rigid bodies (Fig.
1). The femoral component was assumed as conventional cobalt chrome with a density of 8,900 kg/m3, an elastic modulus of 209
Fig. 1. (A) Finite element model of tibia and femur. (B) Finite element model of total knee replacement.
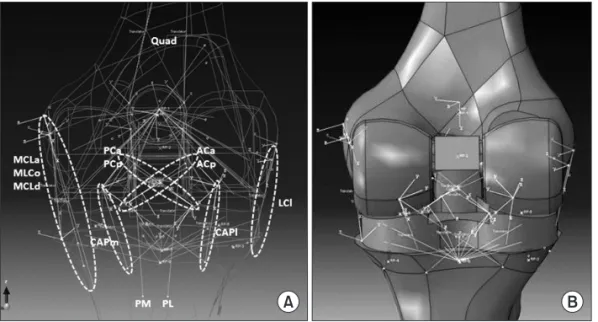
GPa, and a Poisson ration of 0.3117). The UHMWPE was modeled as a plastic material because plastic properties as well as linear elastic properties significantly influence the mechanical behavior of the material17). Material properties and locations of the major ligaments around the knee joint were determined based on the previous studies and consultation with clinicians13,14). Ligaments were simulated as connector elements. The anterior and posterior ligaments are resected before implant insertion in posterior- stabilized TKA. Accordingly, only the medial and lateral ligaments were included in the analysis (Fig. 2).
3. Boundary and Loading Conditions
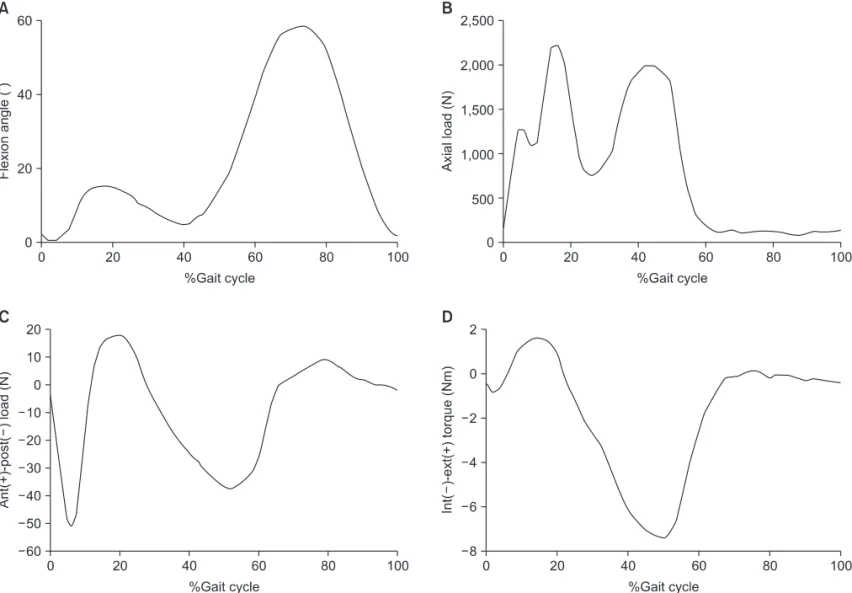
Four springs were used to represent the anteroposterior (AP) displacement and varus-valgus rotation of the components and anatomical characteristics of soft tissues (Fig. 3). The femoral component was constrained in varus-valgus degrees of freedom, while flexion rotation and compression loading were applied. The distal surface of the tibial insert was supported in the inferior-superior direction, insert tilt was constrained, and varus-valgus degrees of freedom was not constrained18). The standard gait cycle with the peak flexion angle of 62o, as seen in Figs. 3, 4 was applied19). Depending on the loading condition, either load control or displacement control was used. Each gait cycle contained 20 data points. The swing phase in which the foot is off the ground was assumed as 100% of the gait cycle and the knee at 20%, 50%, 60%, and 70% of gait cycle was observed.
The coefficient of friction between the articulating surfaces was assumed to be 0.07 in agreement with the range reported in the literature20). Posterior resection was performed at a valgus angle of 6o and posterior tibial slope was measured using a line that connects the center of the tibial intercondylar eminence and
the center of the ankle and a perpendicular line on the lateral view of the knee as references. The same loading and boundary conditions were applied to the finite element models with different posterior slopes (0o, 7o, and 10o, respectively) to predict the contact stress distribution, peak contact stress, and stress on the medial and lateral collateral ligaments. In addition to the posterior tibial slope, there are various factors that may affect the posterior-stabilized TKA including the joint line change, flexion- extension gap, and leg alignment. However, the design variable of the posterior tibial slope was the only factor we considered in this study.
Fig. 2. (A) Locations of medial and lateral collateral ligaments. (B) Finite element model of total knee replacement and ligaments.
MCL: medical collateral ligaments (anterior, oblique, deep), LCL: lateral collateral liga- ment.
Fig. 3. Loading and boundary conditions.
Results
1. Validation of Finite Element Model
The amounts of tibial translation under the AP loads of up to 100 N were comparable to those in the study by Li et al.15,16) (Fig.
5). Under the 100 N AP load, the anterior and posterior tibial translation was 2.39 mm and 4.98 mm, respectively, which was similar to 2.43 mm and 5.28 mm15), and 2.55 mm and 4.86 mm16), thus validating the accuracy of our finite element models.
2. Dynamic Analysis on Gait Cycle Loading
The posterior tibial slope appeared to be correlated positively with the contact stress area and inversely with the contact force on UHMWPE. However, the peak contact stress at 60% and 70% gait cycle was greater when the posterior tibial slopes were 10o than 0o and 7o (Fig. 6). The contact stress for 0o, 7o, and 10o posterior tibial slope were, by perspective percentage of the gait cycle: 17.8 MPa, 17.9 MPa, and 7.81 MPa at 20% gait cycle, 22.8
MPa, 7.15 MPa, and 0.238 MPa at 50% gait cycle, 99.3 MPa, 52.1 MPa, and 53.7 MPa at 60% gait cycle, and 8.64 MPa, 1.89 MPa, and 39.1 MPa at 70% gait cycle (Table 1). The contact Fig. 4. (A) Flexion angle. (B) Axial force. (C) Anterior-posterior force. (D) Internal-external torque on standard gait cycle.
Fig. 5. Comparison of tibial translations for anterior-posterior tibial load between the finite element model and previous experimental study.
stress distribution was correlated with the posterior tibial slope.
However, the peak contact stress was greater in the 10o posterior tibial slope model than in the 0o posterior tibial slope model (120 MPa vs. 100 MPa).
3. Stress on Medial and Lateral Collateral Ligaments
The posterior tibial slope was inversely correlated with the load on the medial and lateral collateral ligaments. The load on the collateral ligaments according to the posterior tibial slope is shown in Fig. 7. The peak load appeared at 70% and 80% gait cycle in all knees. The load on the lateral collateral ligament, deep medial collateral ligament, anterior medial collateral ligament, and oblique medial collateral ligament was 2474 N, 1466 N, 258 N, and 195 N, respectively, in the 0o posterior tibial slope model, 2068 N, 886 N, 186 N, and 140 N, respectively, in the 7o model, and 1869 N, 936 N, 167 N, and 126 N, respectively, in the 10o model (Table 2). The load on the deep lateral collateral ligament was 40-65% of that of the medial collateral ligament. The load on
the anterior and oblique collateral ligaments was approximately 5-15% of that of the medial collateral ligament. The load was the greatest on the lateral collateral ligament, followed by in the order of deep, anterior, and oblique medial collateral ligaments.
Discussion
In this study, we investigated the relationship between the posterior tibial slope and the contact stress at different phases of gait cycle, peak contact stress, and the stress on the medial and lateral collateral ligaments in posterior-stabilized TKA using finite element analysis. Posterior tibial slope was correlated positively with contact stress distribution and inversely with contact stress.
On comparisons between the 0o posterior tibial slope model and 7o posterior tibial slope model at the same point in gait cycle (Figs. 4, 8), the contact area was wide in the 7o model whereas narrow in the 0o model from 20% of the gait cycle where the angular displacement increases. It can be interpreted that the contact stress is distributed over a wider area between the femoral and the bearing components in knees with a posterior tibial slope of 7o compared to those with a posterior tibial slope of 0o. In the 10o model, the contact area was even wider than that in the 7o model (Fig. 6). However, wide contact stress distribution does not necessarily mean low contact force. For some unidentified reasons, the peak contact stress was 20% higher in the 10o model that in the 0o model. Due to the configurational differences of each model, the contact stress had different tendencies according Fig. 6. Stress distribution on bearing for total knee replacement with posterior tibial slope of (A) 10o (B) 7o (C) 0o under 60% gait cycle.
Table 1. Contact Stresses on Ultra-high Molecular Weight Polyethylene in Different Tibial Posterior Slopes under the Gait Cycle
Gait cycle Tibial posterior slope (MPa)
0o 7o 10o
20% 17.8 17.9 7.81
50% 22.8 7.15 0.238
60% 99.3 52.1 53.7
70% 8.64 1.89 39.0
to gait cycle. The morphological properties of each knee implant can also affect the overall tendency.
Posterior tibial slope was inversely correlated with the stress on the collateral ligaments. Fig. 7 shows the load applied on the medial and lateral collateral ligaments according to the gait cycle:
the stress on the medial and lateral collateral ligaments for the lateral stability of the femur and tibia can be compared. In all
three different posterior tibial slope models, the lateral collateral ligament that consists of one bundle supports greater stress than the medial collateral ligament that consists of three bundles.
Stress increases and decreases in a similar fashion as the flexion pattern of the gait cycle (Figs. 4A, 7). In all of the models, the stress is the greatest on the lateral collateral ligament followed by the deep and anterior ligaments and the oblique medial ligament (Fig. 7). The stress on the lateral collateral ligament was the greatest in the 0o model followed by 7o model and 10o model (Fig. 7D), indicating the posterior tibial slope was inversely correlated with the stress on the lateral collateral ligament. The medial collateral ligaments were also inversely correlated with the posterior tibial slope. Therefore, the stress on the medial and lateral collateral ligaments is correlated with the knee flexion and contact stress21).
Limitations of this study include that PCL-retaining TKA models were not included in the finite element analysis, each Table 2. The Maximum Forces on Medial and Lateral Collateral
Ligaments in Different Tiabial Posterior Slopes
Ligaments Tibial posterior slope (N)
0o 7o 10o
Lateral collateral ligament 2474 2068 1869 Deep medial collateral ligament 1466 886 936 Anterior medial collateral ligament 258 186 167 Oblique medial collateral ligament 195 140 126
Fig. 7. Load on collateral ligaments under gait cycle for (A) posterior tibial slope of 0o (B) posterior tibial slope of 7o (C) posterior tibial slope of 10o (D) lateral collateral ligament. TKR: total knee replacement, LCL: lateral collateral ligament, MCL: medical collateral ligaments (anterior, oblique, deep).
patient’s anatomical differences were not considered as variables, and the model construction was based on knees of the Asian enrollees only. However, the significance of our study can be found in the fact that there have been few biomechanical studies on the influence of the posterior tibial slope on the contact surface and ligaments. Considering that the ideal posterior tibial slope is between 0o and 5o in most posterior-stabilized TKAs, the posterior tibial slope (design variable) was varied from 0o (within the ideal value), 7o (outside the ideal value), to 10o (twice the ideal value) in our models. However, we think improvements should be made in further studies because the same design variable was not maintained and larger posterior tibial slope models were not included in this study. In addition, further studies should involve more design variables and PCL-retaining TKA models to verify more effective posterior tibial slope based on the findings of the biomechanical relationship between the contact surface, contact stress, and articular surface erosion.
Conclusions
Posterior tibial slope was correlated positively with stress distribution and inversely with contact stress in posterior- stabilized TKA. However, the peak contact stress was higher in the 10o posterior tibial slope model than that in the other models with smaller posterior slope. In addition, the stress on medial and lateral collateral ligaments was inversely correlated with tibial posterior slope.
References
1. Seo JG, Moon YW, Kim JH. Influence of posterior tibial slope on stability after total knee arthroplasty. J Korean Knee Soc. 2007;19:218-24.
2. Bae DK, Yoon KH, Song SJ, Noh JH, Kim MH. The change of the posterior tibial slope after cruciate retaining total knee arthroplasty. J Korean Orthop Assoc. 2008;43:207-12.
3. Matsuda S, Miura H, Nagamine R, Urabe K, Ikenoue T, Okazaki K, Iwamoto Y. Posterior tibial slope in the normal and varus knee. Am J Knee Surg. 1999;12:165-8.
4. Kim JH, Kim SM. PS-TKA with more than 10degrees of preoperative posterior tibial slope. J Korean Knee Soc.
2011;23:7-13.
5. Catani F, Leardini A, Ensini A, Cucca G, Bragonzoni L, Toksvig-Larsen S, Giannini S. The stability of the cemented tibial component of total knee arthroplasty: posterior cruciate-retaining versus posterior-stabilized design. J Arthroplasty. 2004;19:775-82.
6. Hofmann AA, Bachus KN, Wyatt RW. Effect of the tibial cut on subsidence following total knee arthroplasty. Clin Orthop Relat Res. 1991;(269):63-9.
7. Callaghan JJ, O’Rourke MR, Goetz DD, Schmalzried TP, Campbell PA, Johnston RC. Tibial post impingement in posterior-stabilized total knee arthroplasty. Clin Orthop Relat Res. 2002;(404):83-8.
8. Kim KC, Choi JY, Kim JS, Chung HJ, Koo BS, Won SY.
Influence of the posterior slope of the tibial component on the maximal flexion after total knee arthroplasty. J Korean Knee Soc. 1998;10:13-7.
Fig. 8. (A) Total knee arthroplasty with posterior tibial slope of 0o. (B) Total knee arthroplasty with posterior tibial slope of 7o.
dimensional finite element analysis of the combined behavior of ligaments and menisci in the healthy human knee joint. J Biomech. 2006;39:1686-701.
12. Mesfar W, Shirazi-Adl A. Biomechanics of the knee joint in flexion under various quadriceps forces. Knee. 2005;12:424- 34.
13. Crowninshield R, Pope MH, Johnson RJ. An analytical mo- del of the knee. J Biomech. 1976;9:397-405.
14. Shin CS, Chaudhari AM, Andriacchi TP. The influence of deceleration forces on ACL strain during single-leg landing:
a simulation study. J Biomech. 2007;40:1145-52.
15. Li G, Gil J, Kanamori A, Woo SL. A validated three-dimen- sional computational model of a human knee joint. J Bio- mech Eng. 1999;121:657-62.
machine for performance evaluation of total knee replacements. J Biomech. 1997;30:83-9.
19. Knight LA, Pal S, Coleman JC, Bronson F, Haider H, Levine DL, Taylor M, Rullkoetter PJ. Comparison of long-term numerical and experimental total knee replacement wear during simulated gait loading. J Biomech. 2007;40:1550-8.
20. Sathasivam S, Walker PS. Computer model to predict subsurface damage in tibial inserts of total knees. J Orthop Res. 1998;16:564-71.
21. Barink M, De Waal Malefijt M, Celada P, Vena P, Van Kampen A, Verdonschot N. A mechanical comparison of high-flexion and conventional total knee arthroplasty. Proc Inst Mech Eng H. 2008;222:297-307.