Evaluation of the Accuracy in Maximum Intensity Projection Images of Cerebral Computed Tomographic Angiography for the Diagnosis of Cerebral Vasospasm Following
Subarachnoid Hemorrhage, in Comparison to Digital Subtraction Angiography
Jong-Hoon Kim1, Ji-Hyun Yi2, Chul-Hoon Chang1, Young-Jin Jung1
Departments of 1Neurosurgery, 2Radiology, Yeungnam University Medical Center, Daegu, Korea
Objective : The purpose of this retrospective study is to determine the accuracy of maximum intensity projection (MIP) images of computed to- mographic angiography (CTA) for diagnosis of cerebral vasospasm (CV) following subarachnoid hemorrhage (SAH) compared with that of digital subtraction angiography (DSA).
Materials and Methods : For patients admitted to our hospital for SAH, MIP images of CTA and DSA were checked at admission, and images were taken again 1 week later. This protocol was used in 39 cases. MIP images of CTA and DSA examinations were reviewed by two in- dependent readers.
Results : Accuracy of MIP images of CTA in various arterial segments, us- ing DSA as the gold standard: the sensitivity, specificity, positive predictive value (PPV), negative predictive value (NPV), and accuracy for different segments varied from 84 to 97, 33-100, 84-100%, 25-85, and 79-97%, re- spectively, for readers. Accuracy of CTA in various vasospasm severity, us- ing DSA as the gold standard: the sensitivity, specificity, PPV, NPV, and accuracy for different vasospasm severity varied from 44 to 100, 69-100, 36-100%, 61-100, and 88-100%, respectively, for readers. Accuracy of CTA in central segments versus peripheral segments, using DSA as the gold standard: the sensitivity, specificity, PPV, NPV, and accuracy for central segments and peripheral segments varied from 90 to 94, 68-83, 93-97%, 56-69, and 87-93%, respectively, for readers.
Conclusion : MIP imaging of CTA is a useful modality when diagnosing CV after SAH.
J Cerebrovasc Endovasc Neurosurg.
2018 March;20(1):5-13 Received : 30 March 2017 Revised : 21 September 2017 Accepted : 11 March 2018 Correspondence to Young-Jin Jung Department of Neurosurgery, Yeungnam University Medical Center, 170 Hyeonchung-ro, Nam-gu, Daegu 42415, Korea
Tel : 82-53-620-3790 Fax : 82-53-620-3770 E-mail : [email protected]
ORCID : https://orcid.org/0000-0001-6690-4799
This is an Open Access article distributed under the terms of the Creative Commons Attribution Non- Commercial License (http://creativecommons.org/li- censes/by-nc/3.0) which permits unrestricted non- commercial use, distribution, and reproduction in any medium, provided the original work is properly cited.
Keywords Angiography, Digital subtraction, Vasospasm, Intracranial
INTRODUCTION
Cerebral vasospasm (CV) is a major cause of mortal- ity and morbidity in patients with subarachnoid hem- orrhage (SAH).10) Therefore after a SAH, during the
period in which CV frequently occurs, accurate diag- nosis is helpful in early treatment and it is ultimately possible to assist in the neurological recovery of the patient.12)
There are several methods for diagnosis of CV.
Digital subtraction angiography (DSA) has been the gold standard diagnostic test,20) however, its total complication rate is approximately 5% with a perma- nent stroke rate of approximately 0.5% to 1%.4)5)7)11)18)
Thus there is a significant demand for noninvasive al- ternatives for accurate detection of CV.20) Transcranial Doppler sonography (TCD) is a noninvasive method for detection of vasospasm which has shown high sensitivity and specificity compared with DSA,13) however, its operator dependence and difficulty in ac- curately detecting vasospasm at sites other than the proximal middle cerebral artery (MCA) limit its use to a screening method only.1) While magnetic reso- nance angiography (MRA) can be used as an alternative, there are many disadvantages to this method, including a decrease in the visualization of the distal segment.
Computed tomographic angiography (CTA) has also been developed to provide clear vascular images, and it can detect CV after SAH with high sensitivity and specificity.14) Also with the recent advancement in maximum intensity projection (MIP) imaging, CTA can obtain a more accurate and clearer image than be- fore in a relatively short amount of time. The purpose of this article is to perform a retrospective study on the accuracy of MIP images of CTA for the diagnosis of CV following SAH compared to that of DSA.
MATERIALS AND METHODS
Patient selection
A total of 116 patients with SAH were admitted to our hospital during 2014. Excluding 16 cases of treat- ment with perimesencephalic SAH and poor grade SAH, 100 patients underwent surgery; 77 were cases of endovascular coiling and 23 were cases of surgical clipping. For patients admitted for SAH, our hospital checked a MIP image of CTA and DSA at admission, and images were taken again 1 week later. With the exception of patients who did not perform under pro- tocol due to reasons including poor grade SAH, medi- cal problems, and transferring to other hospitals, 39
cases were performed according to protocol.
Image protocol
MIP images of cerebral CTA
The initial and follow-up CTA studies were per- formed in the same manner. CTA was performed us- ing a 128-slice multidetector CT scanner (Somatom Definition AS+; Siemens Healthineer, Berlin, Germany).
Contrast (Iomeprol, Iomeron 350; Pantheon, Ferentino, Italy) was administered using a mechanical injector (Stellant, Medrad; Bayer, Leverkusen, Germany). An initial test bolus (10 mL) of contrast material was in- fused at a rate of 2 mL/s via a 20 gauge intravenous catheter. After infusing the contrast agent, the images were obtained when 150 Hounsfield units were de- tected in the common carotid artery (bolus tracking technique). Images were obtained at 2 mm intervals from the foramen magnum to the vertex. The formal CTA examination consisted of 100 mL of contrast agent infused at a rate of 4 mL/s via intravenous catheter. The pitch was 0.9, with 320 mA. The 2 mm source axial images were reconstructed to 2 mm axial images. Axial, coronal, and sagittal images were pro- duced for the MIP images based on a 20 mm slab at 10 mm intervals. All MIP reconstructions were per- formed by the same experienced investigator.
Cerebral DSA
The initial and follow-up DSA studies were per- formed in the same manner. DSA was performed us- ing a biplane neuroangiography unit (RF-1000-125, Artis Zee biplane; Siemens Healthineer) and included three or four-vessel studies with standard Towne’s, lateral and both oblique views as well as rotational spin angiograms with 3D reconstructions. A 5 French diagnostic catheter (Angled Taper; Terumo, Tokyo, Japan) was used with the help of an angled 0.035 inch guide wire (Terumo). The contrast media used was nonionic (Iobitridol, XENETIX 300; Guerbet, Villepinte, France). Injections were performed using a power injector (Mark V ProVis, Medrad; Bayer).
Standard injection rates and volumes were as follows:
3.5-4 mL/s for 7-8 mL for the ICAs and 3.5-4 mL/s
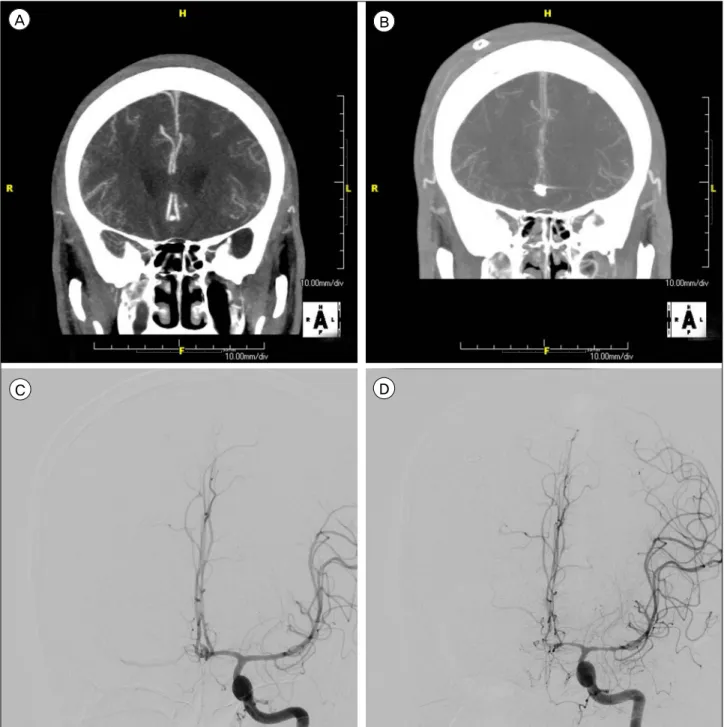
A B
C D
Fig. 1. (A) Right MCA was not visible in the CTA due to the coil artifact. (B) Right MCA was not visible in the CTA due to the coil artifact. (C) Right MCA was clearly confirmed in the DSA regardless of the coil. (D) Right MCA was clearly confirmed in the DSA re- gardless of the coil. MCA = middle cerebral artery; CTA = computed tomographic angiography; DSA = digital subtraction angiography.
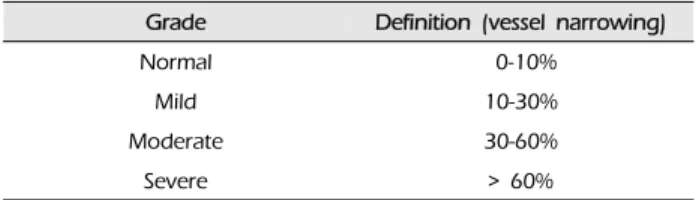
Grade Definition (vessel narrowing)
Normal 0-10%
Mild 10-30%
Moderate 30-60%
Severe > 60%
Table 1. Scale for grading intracranial cerebral vasospasm for 3.5-4 mL for the vertebral arteries.
Image analysis
The MIP images of CTA and DSA examinations were each reviewed by two independent readers (a neurosurgeon and a neuroradiologist). Analysis of the
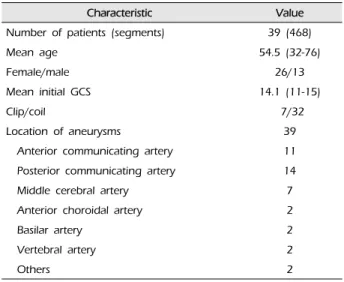
Characteristic Value Number of patients (segments) 39 (468)
Mean age 54.5 (32-76)
Female/male 26/13
Mean initial GCS 14.1 (11-15)
Clip/coil 7/32
Location of aneurysms 39
Anterior communicating artery 11 Posterior communicating artery 14
Middle cerebral artery 7
Anterior choroidal artery 2
Basilar artery 2
Vertebral artery 2
Others 2
GCS = Glasgow coma scale.
Table 2. Characteristics of patients
CV was performed by comparing the initial MIP im- ages of CTA and DSA with follow-up MIP images of CTA and DSA taken an average of 7.1 (5-10) days later. The analyzed vessel segments were divided into bilateral left and right for A1 (first segment of ante- rior cerebral artery), A2 (second segment of anterior cerebral artery), M1 (first segment of middle cerebral artery), M2 (second segment of middle cerebral ar- tery), P1 (first segment of posterior cerebral artery), and P2 (second segment of posterior cerebral artery).
The scale for grading intracranial CV analyzed from comparison of the initial MIP images of CTA and DSA with follow-up MIP images of CTA and DSA is as follows: normal, 0-10% vessel narrowing; mild, 10-30% vessel narrowing; moderate, 30-60% vessel narrowing; severe, more than 60% vessel narrowing (Table 1). The duration between the MIP images of CTA and DSA examinations was an average of 15.7 hours (12-21) and did not exceed 24 hours and no treatments for vasospasm were administered between the examinations. In the case that several parts in one segment had been narrowed, the narrowest part was referenced. Segments that could not be analyzed for artifacts due to coils or clips were excluded (Fig. 1).
There was a two-week period between analysis of the MIP images of CTA and DSA images of the patient.
Statistical analysis
The MIP images of CTA and DSA examinations were analyzed for sensitivity, specificity, and accu- racy, and predictive values were also calculated. A positive predictive value (PPV) refers to the pro- portion of positive MIP images of CTA results that were truly positive (on DSA studies). Similarly, a neg- ative predictive value (NPV) refers to the proportion of negative MIP images of CTA results that were tru- ly negative (on DSA studies). Kappa analysis was used to assess the strength of inter-observer agree- ment for various arterial segments. The inter-observer was in fact one person, but this is also a term indicat- ing that the readers of the MIP images of CTA and DSA were respectively treated as different people.
RESULTS
Patients’ characteristics
Twelve segments including bilateral A1, A2, M1, M2, P1, and P2 for 39 patients were analyzed for a to- tal of 468 segments; 430 segments excluding 38 arti- facts for reader 1, and 459 segments excluding 9 arti- facts for reader 2 were analyzed, respectively. All arti- facts were cases of beam-hardening artifacts due to metallic endovascular coils or surgical clips. The mean age of the patients was 54.5 (32-76); 26 patients were female, and 13 were male. The mean initial Glasgow coma scale was 14.1 (11-15), 32 patients were treated with endovascular coiling and seven with sur- gical clipping for their aneurysms. For the locations of aneurysms in the anterior communicating artery, pos- terior communicating artery, middle cerebral artery, anterior choroidal artery, basilar artery, vertebral ar- tery and others (the superior cerebellar artery and the posterior inferior cerebellar artery) there were 11, 14, 7, 2, 2, 1, and 2 cases, respectively. Baseline character- istics of our study patients are listed in Table 2.
Accuracy of MIP images of CTA in various arterial segments, using DSA as the gold standard
The sensitivity, specificity, PPV, NPV, and accuracy of CTA in diagnosis of A1, A2, M1, M2, P1, and P2
M1 M2 A1 A2 P1 P2 Reader 1 Reader 2 Reader 1 Reader 2 Reader 1 Reader 2 Reader 1 Reader 2 Reader 1 Reader 2 Reader 1 Reader 2
Sensitivity 0.93 0.95 0.89 0.94 0.90 0.95 0.89 0.93 0.94 0.93 0.93 0.93
Sensitivity 0.77 1.00 0.64 0.91 0.60 0.80 0.63 0.56 0.86 0.50 0.86 0.67
PPV 0.95 1.00 0.93 0.98 0.89 0.95 0.89 0.88 0.98 0.97 0.98 0.99
NPV 0.71 0.79 0.50 0.71 0.64 0.80 0.63 0.71 0.60 0.29 0.55 0.29
Accuracy 0.90 0.96 0.85 0.94 0.84 0.92 0.83 0.85 0.93 0.91 0.92 0.92
MIP = maximum intensity projection; CTA = computed tomographic angiography; DSA = digital subtraction angiography; PPV = positive predictive value; NPV = negative predictive value.
Table 3. Accuracy of MIP images of CTA in various arterial segments, using DSA as the gold standard
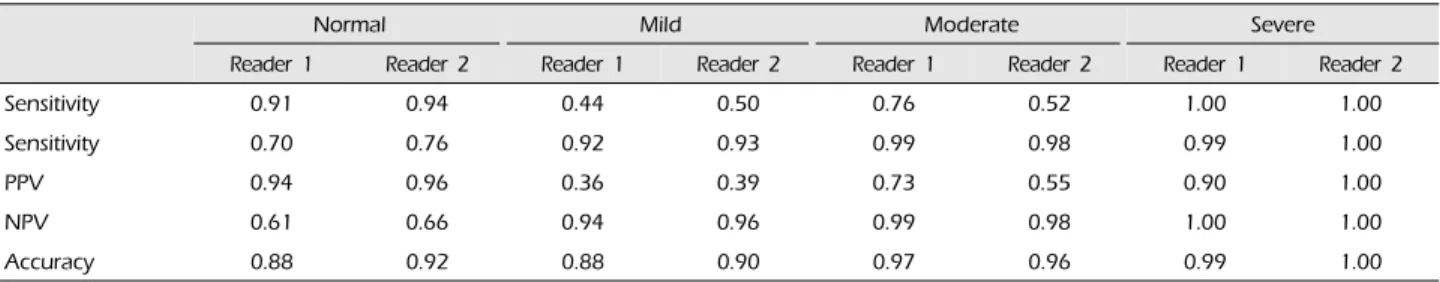
Normal Mild Moderate Severe
Reader 1 Reader 2 Reader 1 Reader 2 Reader 1 Reader 2 Reader 1 Reader 2
Sensitivity 0.91 0.94 0.44 0.50 0.76 0.52 1.00 1.00
Sensitivity 0.70 0.76 0.92 0.93 0.99 0.98 0.99 1.00
PPV 0.94 0.96 0.36 0.39 0.73 0.55 0.90 1.00
NPV 0.61 0.66 0.94 0.96 0.99 0.98 1.00 1.00
Accuracy 0.88 0.92 0.88 0.90 0.97 0.96 0.99 1.00
CTA = computed tomographic angiography; DSA = digital subtraction angiography; PPV = positive predictive value; NPV = negative predictive value.
Table 4. Accuracy of CTA in various vasospasm severity, using DSA as the gold standard
Central Peripheral
Reader 1 Reader 2 Reader 1 Reader 2
Sensitivity 0.93 0.94 0.90 0.94
Sensitivity 0.71 0.83 0.68 0.69
PPV 0.94 0.97 0.94 0.95
NPV 0.66 0.69 0.56 0.63
Accuracy 0.89 0.93 0.87 0.90
CTA = computed tomographic angiography; DSA = digital subtraction angiography; PPV = positive predictive value; NPV = negative predictive value.
Table 5. Accuracy of CTA in central segments versus peripheral segments, using DSA as the gold standard
segments vasospasm, using DSA as the gold standard are shown in Table 3. The sensitivity, specificity, PPV, NPV, and accuracy for different segments varied from 89 to 94%, 60-86%, 89-98%, 50-71%, and 83-93%, re- spectively, for reader 1, and from 93 to 95%, 50-100%, 88-100%, 29-80% and 85-96%, respectively, for reader 2.
Accuracy of CTA in various vasospasm severity, us- ing DSA as the gold standard
The sensitivity, specificity, PPV, NPV, and accuracy of CTA in diagnosis of normal, mild, moderate, and severe vasospasm, using DSA as the gold standard
are shown in Table 4. The sensitivity, specificity, PPV, NPV, and accuracy for different vasospasm severity varied from 44 to 100%, 70-99%, 36-94%, 61-100%, and 88-99%, respectively, for reader 1, and from 50 to 100%, 76-100%, 39-100%, 66-100%, and 90-100%, re- spectively, for reader 2.
Accuracy of CTA in central segments versus periph- eral segments, using DSA as the gold standard
The sensitivity, specificity, PPV, NPV, and accuracy of CTA in central segments (A1, M1, P1) versus pe- ripheral segments (A2, M2, P2), using DSA as the
Reader 1 Reader 2
K value 0.553 0.562
Table 6. K value of two observers
gold standard are shown in Table 5. The sensitivity, specificity, PPV, NPV and accuracy for central seg- ments and peripheral segments varied from 90 to 93, 68-71, 93-94%, 56-66 and 87-89%, respectively, for reader 1, and from 94%, 69-83%, 95-97%, 63-69% and 90-93%, respectively, for reader 2.
Kappa analysis was used to assess the strength of inter-observer agreement for various arterial segments.
The K values of the two readers were 0.553 for reader 1 and 0.562 for reader 2 (Table 6).
DISCUSSION
The presence of significant vasospasm carries the risk of stroke, thus the role of imaging in these pa- tients is not only to reach a diagnosis of vasospasm but mainly to make an appropriate clinical decision regarding the most suitable treatment.12) DSA is con- sidered the standard method to confirm the diagnosis of vasospasm.16) The major advantage of DSA lies in its accuracy and the capacity to immediately perform endovascular treatment by balloon angioplasty and/or intra-arterial injection of vasodilatory drugs.19) However, this procedure is invasive and is not always available in critically ill patients and not without its own risk.3)11) There has been, therefore, great demand for noninvasive alternatives for accurate depiction of cerebral vasospasm.20) TCD is an examination with many advantages including its accuracy, relative sim- plicity, and it can be performed every day, etc.
However, the technical limitations of TCD include ex- aminer experience and the difficulty of accurately de- tecting vasospasm at sites other than the proximal middle cerebral artery.10) In addition, approximately 10% of studies using TCD failed to detect signals of cerebral artery blood flow caused by poor insonation of the cranial window.8)17) Thus, TCD alone is in-
adequate for detection of vasospasm, and other meth- ods are required.9) MRA can depict the cerebral vas- culature less invasively, however its sensitivity and specificity for detection of vasospasm after SAH re- main relatively low. In addition, MRA has limitations for detecting the severity of vasospasm and visual- ization of the distal arteries.15) Therefore, MRA cannot be considered as a practical alternative to DSA.
By contrast with these modalities, although the dis- tal segments of the cerebral arteries are poorly im- aged because of the limited spatial resolution,10) CTA is a noninvasive alternative to DSA, and can be rap- idly performed immediately after a non-contrast head CT, which is often performed in patients to evaluate for hydrocephalus.2) However, there are also disadvantages. It is important to mention that imag- ing for vasospasm is usually performed after clipping or coiling of an aneurysm. Streak artifacts from these metal devices could obscure adjacent arteries espe- cially after coiling and influence CTA’s evaluation.
However, recently developed MIP images have over- come some of the limitations of CTA. MIP images have advantages for differentiating calcification from true lumen and determining degree of atherosclerotic disease.6)
This study examined the accuracy of MIP images of CTA for diagnosis of CV compared to DSA. When di- agnosed with SAH, initial MIP images of CTA and DSA were checked, and the same examinations were repeated one week later. We considered that the MIP images of CTA could predict a significant part of the cerebral vasospasm. Actually, in this study compared with DSA, the accuracy of the MIP image of CTA was higher overall (88-100%). Previous studies have re- ported higher sensitivity (up to 97.5%) and specificity (up to 98.1%) of CTA for vasospasm.20) This is ex- plained by the fact that the previous study only con- sidered severe vasospasm, and considered all vessels that were not severely narrowed as normal. This di- chotomization of the interpretation of the CTA images resulted in apparent increased sensitivity and specific-
A B
C D
Fig. 2. (A) Both ACA are normal with no vasospasms shown in the initial CTA. (B) Both ACA showed severe vasospasms in the fol- low-up CTA. (C) Both ACA are normal with no vasospasms shown in the initial DSA. (D) Both ACA showed severe vasospasms in the follow-up DSA. ACA = anterior cerebral artery; CTA = computed tomographic angiography; DSA = digital subtraction angiography.
ity at the expense of not detecting mild or moderate vasospasm.
However, in this study the degrees of vasospasm were categorized according to normal, mild, moder- ate, and severe. As a result, in the case of moderate and severe vasospasms, it was confirmed that sensi-
tivity and specificity were high, and in the case of normal and mild vasospasms, it was confirmed that sensitivity and specificity were relatively lower. The fact that the accuracy of the moderate and severe vas- ospasms was very high is considered the most im- portant findings of this study (Fig. 2). This signifies
that a moderate and severe vasospasm in the MIP im- ages of CTA has a high probability of also being a moderate and severe vasospasm in DSA as well, respectively. In other words, it can be concluded that when diagnosed with moderate or severe vasospasms by the MIP images of CTA, it is unnecessary to check DSA for a more accurate diagnosis. However, by cor- relation with clinical factors, endovascular treatment can be performed simultaneously with DSA as necessary. When comparing with a distinction be- tween the central vessel segment (A1, M1, P1) and the peripheral segment (A2, M2, P2), both readers con- firmed higher accuracy of the central vessel segment compared with that of the peripheral vessel segment.
From these results it is considered that the central vessel segment is more advantageous than the periph- eral vessel segment when measuring the vasospasm.
This study is distinct from other studies for the fol- lowing reasons. First, this study compares the four group images starting from the group without cere- bral vasospasm up to the severe vasospasm group.
Second, this research compares the MIP images of CTA and DSA images when the SAH diagnosis is ini- tially given to the MIP images of CTA and DSA im- ages one week later. Third, this study performs a comparison based on the detailed categorization of A1, A2, M1, M2, P1, P2 without knowing whether the patients were normal or diagnosed with vasospasm.
And, because of separate analysis on the MIP images of CTA and DSA with two-week duration, the bias was reduced. Fourth, a clear distinction between spasm and hypoplastic vessel was possible because both initial and one week examinations were checked for the CTA and DSA.
However this study also had a few limitations. First, although the period in between was short, the time between duration for the MIP images of CTA and DSA in the follow-up image test was an average of 15.7 hours. Because cerebral vasospasm is a dynamic process, there was a limitation in that there was a possibility of change even within a short period of
time. Second, because this was a study only on the di- ameter of the vessel, there is a limitation that the re- sults might not be identical to the clinical results.
Therefore, there is a need for future research in the area of modalities such as perfusion CT. Third, the patients included in the research protocol were in rel- atively good clinical states. In other words there was a high probability of CV in patients who were not in good clinical states, resulting in the limitation that these patients were excluded from the study. Fourth, the low power of statistics due to the small study population was a major limitation of our study.
CONCLUSION
MIP images of CTA are a useful modality when di- agnosing cerebral vasospasm after SAH. Because of this high accuracy, it is possible to reduce the number of unnecessarily invasive DSA examinations, making it possible to perform DSA on carefully selected patients. Therefore we propose that the MIP images of CTA examination be used with the objective of screening for cerebral vasospasm after SAH and that the MIP images of CTA examination can be used as a key modulator by appropriately correlating diag- nosis results and clinical symptoms for determining whether DSA examination is necessary.
Disclosure
The authors report no conflict of interest concerning the materials or methods used in this study or the findings specified in this paper.
REFERENCES
1. Anderson GB, Ashforth R, Steinke DE, Findlay JM. CT angiography for the detection of cerebral vasospasm in patients with acute subarachnoid hemorrhage. AJNR Am J Neuroradiol. 2000 Jun-Jul;21(6):1011-5.
2. Chaudhary SR, Ko N, Dillon WP, Yu MB, Liu S, Criqui GI, et al. Prospective evaluation of multidetector-row CT angiography for the diagnosis of vasospasm following subarachnoid hemorrhage: a comparison with digital subtraction angiography. Cerebrovasc Dis. 2008;25(1-2):
144-50.
3. Cloft HJ, Joseph GJ, Dion JE. Risk of cerebral angiog- raphy in patients with subarachnoid hemorrhage, cere- bral aneurysm, and arteriovenous malformation: a meta-analysis. Stroke. 1999 Feb;30(2):317-20.
4. Dorsch NW, Young N, Kingston RJ, Compton JS. Early experience with spiral CT in the diagnosis of intra- cranial aneurysms. Neurosurgery. 1995 Jan;36(1):230-6;
discussion 236-8.
5. Earnest F 4th, Forbes G, Sandok BA, Piepgras DG, Faust RJ, Ilstrup DM, et al. Complications of cerebral angiography: prospective assessment of risk. AJR Am J Roentgenol. 1984 Feb;142(2):247-53.
6. Ferguson SD, Rosen DS, Bardo D, Macdonald RL.
Arterial diameters on catheter and computed tomo- graphic angiography. World Neurosurg. 2010 Mar;73(3):
165-73; discussion e25.
7. Heiserman JE, Dean BL, Hodak JA, Flom RA, Bird CR, Drayer BP, et al. Neurologic complications of cerebral angiography. AJNR Am J Neuroradiol. 1994 Sep;15(8):
1401-7; discussion 1408-11.
8. Levi CR, O'Malley HM, Fell G, Roberts AK, Hoare MC, Royle JP, et al. Transcranial Doppler detected cerebral microembolism following carotid endarterectomy. High microembolic signal loads predict postoperative cerebral ischaemia. Brain. 1997 Apr;120 (Pt 4):621-9.
9. Okada Y, Shima T, Nishida M, Yamane K, Hatayama T, Yamanaka C, et al. Comparison of transcranial Doppler investigation of aneurysmal vasospasm with digital sub- traction angiographic and clinical findings. Neurosurgery.
1999 Sep;45(3):443-9; discussion 449-50.
10. Otawara Y, Ogasawara K, Ogawa A, Sasaki M, Takahashi K. Evaluation of vasospasm after subarachnoid hemor- rhage by use of multislice computed tomographic angiography. Neurosurgery. 2002 Oct;51(4):939-42; dis- cussion 942-3.
11. Pryor JC, Setton A, Nelson PK, Berenstein A.
Complications of diagnostic cerebral angiography and tips on avoidance. Neuroimaging Clin N Am. 1996 Aug;6(3):751-8.
12. Shankar JJ, Tan IY, Krings T, Terbrugge K, Agid R. CT
angiography for evaluation of cerebral vasospasm fol- lowing acute subarachnoid haemorrhage. Neuroradiology.
2012 Mar;54(3):197-203.
13. Sloan MA, Haley EC Jr, Kassell NF, Henry ML, Stewart SR, Beskin RR, et al. Sensitivity and specificity of trans- cranial Doppler ultrasonography in the diagnosis of vas- ospasm following subarachnoid hemorrhage. Neurology.
1989 Nov;39(11):1514-8.
14. Takagi R, Hayashi H, Kobayashi H, Kumazaki T, Isayama K, Ikeda Y, et al. Three-dimensional CT an- giography of intracranial vasospasm following sub- arachnoid haemorrhage. Neuroradiology. 1998 Oct;40(10):
631-5.
15. Tamatani S, Sasaki O, Takeuchi S, Fujii Y, Koike T, Tanaka R. Detection of delayed cerebral vasospasm, af- ter rupture of intracranial aneurysms, by magnetic reso- nance angiography. Neurosurgery. 1997 Apr;40(4):748-53;
discussion 753-4.
16. Treggiari-Venzi MM, Suter PM, Romand JA. Review of medical prevention of vasospasm after aneurysmal sub- arachnoid hemorrhage: a problem of neurointensive care.
Neurosurgery. 2001 Feb;48(2):249-61; discussion 261-2.
17. Vernieri F, Pasqualetti P, Passarelli F, Rossini PM, Silvestrini M. Outcome of carotid artery occlusion is predicted by cerebrovascular reactivity. Stroke. 1999 Mar;30(3):593-8.
18. Waugh JR, Sacharias N. Arteriographic complications in the DSA era. Radiology. 1992 Jan;182(1):243-6.
19. Wintermark M, Ko NU, Smith WS, Liu S, Higashida RT, Dillon WP. Vasospasm after subarachnoid hemor- rhage: utility of perfusion CT and CT angiography on diagnosis and management. AJNR Am J Neuroradiol.
2006 Jan;27(1):26-34.
20. Yoon DY, Choi CS, Kim KH, Cho BM.
Multidetector-row CT angiography of cerebral vasospasm after aneurysmal subarachnoid hemorrhage: comparison of volume-rendered images and digital subtraction angiography. AJNR Am J Neuroradiol. 2006 Feb;27(2):
370-7.