ISSN 2234-3806 • eISSN 2234-3814
https://doi.org/10.3343/alm.2021.41.5.447
Internal Quality Control Data of Urine Reagent Strip Tests and Derivation of Control Rules Based on Sigma Metrics
Haeil Park , M.D., Ph.D. and Younsuk Ko , M.T.
Department of Laboratory Medicine, Bucheon St. Mary’s Hospital, College of Medicine, The Catholic University of Korea, Seoul, Korea
Background: Urine reagent strip test (URST) results are semi-quantitative; therefore, the precision of URSTs is evaluated as the proportion of categorical results from repeated measurements of a sample that are concordant with an expected result. However, URSTs have quantitative readout values before ordinal results challenging statistical monitoring for internal quality control (IQC) with control rules. This study aimed to determine the sigma metric of URSTs and derive appropriate control rules for IQC.
Methods: The URiSCAN Super Plus fully automated urine analyzer (YD Diagnostics, Yon- gin, Korea) was used for URSTs. Change in reflectance rate (change %R) data from IQC for URSTs performed between November 2018 and May 2020 were analyzed. Red blood cells, bilirubin, urobilinogen, ketones, protein, glucose, leukocytes, and pH were mea- sured from 2–3 levels of control materials. The total allowable error (TEa) for a grade was the difference in midpoints of a predefined change %R range between two adjacent grades. The sigma metric was calculated as TEa/SD. Sigma metric-based control rules were determined with Westgard EZ Rules 3 software (Westgard QC, Madison, WI, USA).
Results: Seven out of the eight analytes had a sigma metric >4 in the control materials with a negative grade (−), which were closer to the cut-offs. Corresponding control rules ranged from 12.5s to 13.5s.
Conclusions: Although the URST is a semi-quantitative test, statistical IQC can be per- formed using the readout values. According to the sigma metric, control rules recom- mended for URST IQC in routine clinical practice are 12.5s to 13.5s.
Key Words: Urine reagent strip test, Internal quality control, Sigma metric, Control rule
Received: August 4, 2020
Revision received: October 12, 2020 Accepted: March 17, 2021 Corresponding author:
Haeil Park, M.D., Ph.D.
Department of Laboratory Medicine, Bucheon St. Mary’s Hospital, The Catholic University of Korea, 327 Sosa-ro, Wonmi- gu, Bucheon 14647, Korea
Tel: +82-32-340-2093 Fax: +82-32-340-2219 E-mail: phi@catholic.ac.kr
© Korean Society for Laboratory Medicine This is an Open Access article distributed under the terms of the Creative Commons Attribution Non-Commercial License (https://creativecom- mons.org/licenses/by-nc/4.0) which permits unrestricted non-commercial use, distribution, and reproduction in any medium, provided the original work is properly cited.
INTRODUCTION
Urinalysis plays a major role in the screening, diagnosis, and monitoring of renal and urological conditions [1-4]. The urine reagent strip test (URST) is a semi-quantitative test and has be- come increasingly more sensitive owing to advances in elec- tronic detection [5]. The analytical performance of a URST is typically evaluated based on precision, calculated as the propor- tion of categorical results from repeated measurements of a
sample that are concordant with an expected result [6-11]. In addition, the precision of a URST can be evaluated in terms of a cut-off value [12].
Internal quality control (IQC) of a URST typically involves the measurement of control materials once per run or over a time interval. As in precision evaluation, test results from the control materials are compared with the expected values for the mate- rial; QC is assured when the difference is not more than one grade. The statistical QC commonly used in clinical chemistry
2017-03-16 https://crossmark-cdn.crossref.org/widget/v2.0/logos/CROSSMARK_Color_square.svg
tests using mean and SD cannot be applied to URST IQC with semi-quantitative ordinal data.
Currently, the performance of quantitative laboratory tests in clinical chemistry is often expressed as a sigma metric, and control rules for IQC can be obtained using a sigma metric [13- 21]. Quantitative readout values, such as the reflectance rate, are used to evaluate the performance of a URST [9, 22-26]. Al- though the precision of a URST has been analyzed quantita- tively, there is no IQC report based on quantitative data. If quan- titative data are available from a laboratory test, a sigma metric with control rules for IQC can be obtained. Specifically, data on the precision, bias, and total allowable error (TEa) would be re- quired to establish sigma metric-based control rules [27]. The sigma metric depends on the TEa [17, 21, 28]. However, our lit- erature search failed to identify studies that covered the TEa for URSTs and associated sigma metrics, or IQC control rules based on the sigma metric. Therefore, this study aimed to de- termine the sigma metric of the URST and to derive appropriate control rules based on quantitative readout values from URST IQC data.
MATERIALS AND METHODS
SettingThis study was conducted retrospectively at Bucheon St. Mary’s Hospital, Bucheon, Korea, using IQC data obtained from No- vember 2018 to May 2020. The study was approved by the In- stitutional Review Board of the Catholic Medical Center, the Catholic University of Korea (HC20DISI0094).
URST system
The URiSCAN Super Plus fully automated urine analyzer (YD Diagnostics, Yongin, Korea) was used with a URiSCAN strip (YD Diagnostics) to assess 10 analytes, including red blood cells (RBC), bilirubin, urobilinogen, ketones, protein, nitrite, glucose, leukocytes, specific gravity (SG), and pH.
URiSCAN Super Plus is one of a series of URST systems that is commonly used in Korea [29]. On reaction with a urine speci- men, the degree of color development of the pads on a reagent strip is measured by a charge-coupled device (CCD) color im- age sensor under illumination with a light-emitting diode. The CCD takes a reading at each wavelength for red (630 nm), green (540 nm), and blue (460 nm). The difference in the re- flectance rate before and after the reaction is then converted to the change in the reflectance rate (change %R) value, from which a grade on an ordinal scale (e.g., −, ±, +, 2+, and 3+) is
generated as the test result based on a range that is predefined by the manufacturer [29].
TEa
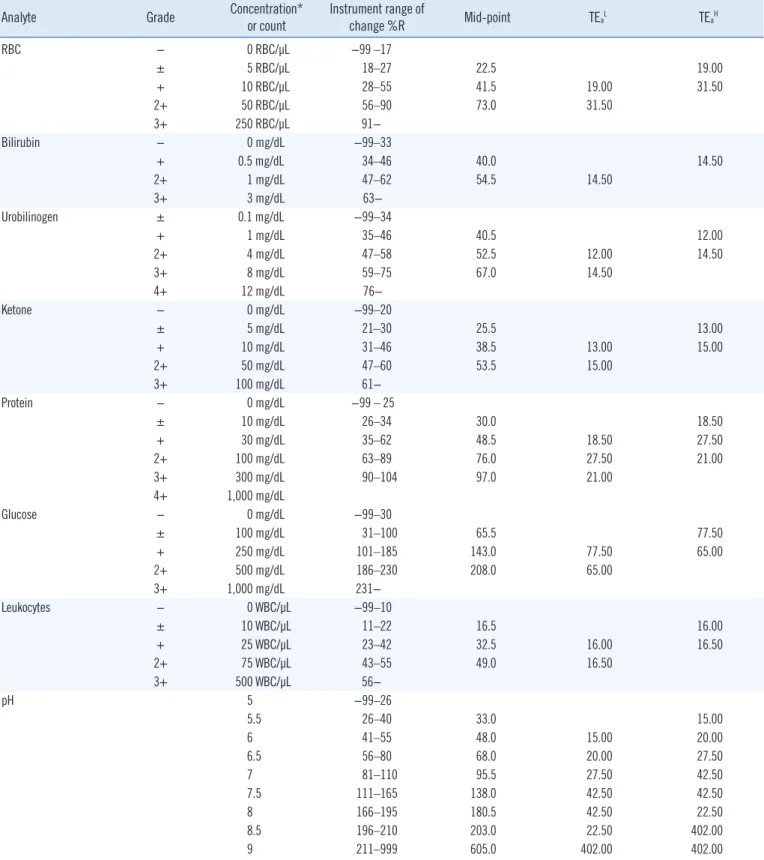
The analyte concentration and predefined instrument range of change %R for each grade of the URST result were obtained from the manufacturer’s user manual (Table 1). The midpoint of change %R was determined for each grade, and the difference in the midpoint change %R between a given grade and the ad- jacent grade (below or above) was calculated. Considering that the allowable difference in the evaluation of precision or IQC is one grade, the TEa for a particular grade was assumed to be the difference of the midpoint change %R between that grade and the adjacent grade. If the predefined range of change %R at a given level of the control material had no valid lower or upper limit, the midpoint change %R could not be determined. In that case, the difference in midpoint change %R between adjacent grades could not be calculated, and the TEa was unavailable. If the TEa for a level of a control material was unavailable, that of the nearest grade was used instead (Table 1). Despite this ap- proach, the TEa was still unavailable for nitrite and SG, since ni- trite was measured on a binary rather than an ordinal scale, and the predefined change %R range table of the manufacturer did not include information about SG.
Control materials and IQC
URiTROL liquid urinalysis control (YD Diagnostics) was used for IQC. Control materials are listed in Table 2; two or three levels of the control materials were analyzed once in each of two runs on a weekday. During the study period, 4–5 lots per level of control material were used (Fig. 1). Three lots of reagent strips were used; different lots were assumed to be equivalent, and lots were therefore not considered in the data analysis.
Data analysis
Quantitative readout values for eight of the 10 analytes (exclud- ing nitrite and SG) were used for data analysis. The mean, SD, and CV of the change %R at each level of control material were calculated for each lot and across all lots. Because the count of readout values (N) differed among lots, it was used as a weight for each lot in the calculation across all lots [30]. The sigma metric was calculated as TEa/SD. The bias from the original equation of (TEa–bias)/SD was assumed to be zero. This as- sumption was necessary because the target value of change
%R was unknown so that bias could not be calculated. Sigma of 4 and 3 is considered to indicate average performance and
Table 1. TEa for quantitative readout values of each grade from URSTs derived from the range of change %R
Analyte Grade Concentration*
or count Instrument range of
change %R Mid-point TEaL TEaH
RBC − 0 RBC/μL −99 –17
± 5 RBC/μL 18–27 22.5 19.00
+ 10 RBC/μL 28–55 41.5 19.00 31.50
2+ 50 RBC/μL 56–90 73.0 31.50
3+ 250 RBC/μL 91−
Bilirubin − 0 mg/dL −99–33
+ 0.5 mg/dL 34–46 40.0 14.50
2+ 1 mg/dL 47–62 54.5 14.50
3+ 3 mg/dL 63−
Urobilinogen ± 0.1 mg/dL −99–34
+ 1 mg/dL 35–46 40.5 12.00
2+ 4 mg/dL 47–58 52.5 12.00 14.50
3+ 8 mg/dL 59–75 67.0 14.50
4+ 12 mg/dL 76−
Ketone − 0 mg/dL −99–20
± 5 mg/dL 21–30 25.5 13.00
+ 10 mg/dL 31–46 38.5 13.00 15.00
2+ 50 mg/dL 47–60 53.5 15.00
3+ 100 mg/dL 61−
Protein − 0 mg/dL −99 – 25
± 10 mg/dL 26–34 30.0 18.50
+ 30 mg/dL 35–62 48.5 18.50 27.50
2+ 100 mg/dL 63–89 76.0 27.50 21.00
3+ 300 mg/dL 90–104 97.0 21.00
4+ 1,000 mg/dL
Glucose − 0 mg/dL −99–30
± 100 mg/dL 31–100 65.5 77.50
+ 250 mg/dL 101–185 143.0 77.50 65.00
2+ 500 mg/dL 186–230 208.0 65.00
3+ 1,000 mg/dL 231−
Leukocytes − 0 WBC/μL −99–10
± 10 WBC/μL 11–22 16.5 16.00
+ 25 WBC/μL 23–42 32.5 16.00 16.50
2+ 75 WBC/μL 43–55 49.0 16.50
3+ 500 WBC/μL 56−
pH 5 −99–26
5.5 26–40 33.0 15.00
6 41–55 48.0 15.00 20.00
6.5 56–80 68.0 20.00 27.50
7 81–110 95.5 27.50 42.50
7.5 111–165 138.0 42.50 42.50
8 166–195 180.5 42.50 22.50
8.5 196–210 203.0 22.50 402.00
9 211–999 605.0 402.00 402.00
*Conversion factors from conventional units to Système International (SI) units are: bilirubin, from mg/dL to μmol/L multiply by 17.1; urobilinogen, from mg/
dL to μmol/L multiply by 16.93; ketone, from mg/dL to mmol/L multiply by 0.1721; protein, from mg/dL to mg/L multiply by 10; glucose, from mg/dL to mmol/L multiply by 0.0555.
Abbreviations: TEa, total allowable error; URSTs, urine reagent strip tests; TEaL, difference of the midpoints of adjacent lower grades; TEaH, difference of the midpoints of adjacent higher grades; RBC, red blood cells; WBC, white blood cells.
Fig. 1. Lots of control materials used for internal QC of the urine reagent strip tests. The start and end dates of the period of each lot are shown for each level of control material.
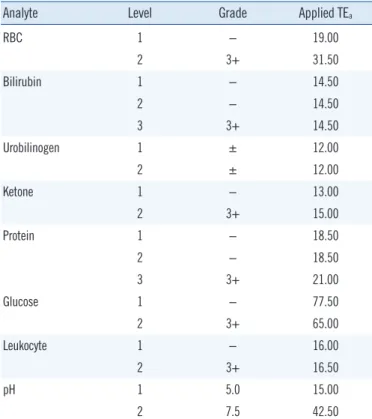
Table 2. TEa for quantitative readout values of the control materials (URiTROL)
Analyte Level Grade Applied TEa
RBC 1 − 19.00
2 3+ 31.50
Bilirubin 1 − 14.50
2 − 14.50
3 3+ 14.50
Urobilinogen 1 ± 12.00
2 ± 12.00
Ketone 1 − 13.00
2 3+ 15.00
Protein 1 − 18.50
2 − 18.50
3 3+ 21.00
Glucose 1 − 77.50
2 3+ 65.00
Leukocyte 1 − 16.00
2 3+ 16.50
pH 1 5.0 15.00
2 7.5 42.50
Abbreviations: TEa, total allowable error; RBC, red blood cells.
minimum quality in industry, respectively. Sigma 6 is considered to indicate the best performance and represents a “world-class quality” product [31]. Westgard EZ Rules 3 software (Westgard QC, Madison, WI, USA) was used to determine sigma metric- based control rules with the total number of control measure- ments (Nc). The probability of false rejections (Pfr) and the prob- ability of error detection (Ped) of IQC were also calculated along with the number of runs over which the control rules were ap- plied (R) [31]. In URST, usually, a negative result in grade (−) is normal, and positive results in grades (+, 2+, and 3+) are ab-
normal. It is clinically important to distinguish whether the pa- tient’s URST result is normal or abnormal. To this end, the ac- curacy of the URST must be ensured in the borderline range where the patient’s URST result is positive, but the analyte con- centration is low. To monitor the accuracy in that range, the control material must also be positive, but its concentration must be low [9, 10]. Therefore, besides pH, data from level-1 control materials were considered to be more meaningful than those from other levels, because the expected value of the level-1 material, with mostly negative results in grade (−), would be closer to the cut-off values between normal and abnormal test results.
RESULTS
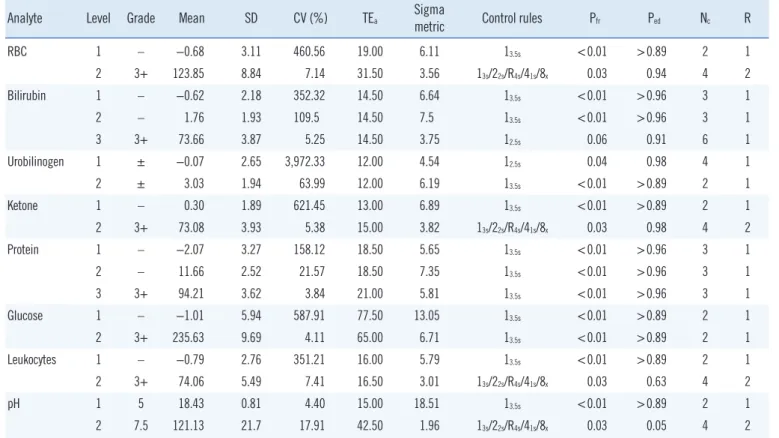
The mean, SD, CV, and sigma metrics obtained from the change
%R values for all lots are presented in Table 3. Considering the results from each lot separately, the sigma metric ranged from 3.59 (urobilinogen) to 27.19 (pH) in level-1 control material. Ex- cept for one lot showing the worst precision for urobilinogen (U11805), all other analytes in level-1 control material had a sigma metric above 4, which is considered at least average quality in the industry. The sigma metric ranged from 1.35 (pH) to 9.76 (glucose) in level-2 control material and from 2.66 (bili- rubin) to 6.27 (protein) in level-3 control material. Except for urobilinogen, all analytes in level-1 control material showed a sigma 6 performance for at least one lot, indicating world-class quality. Control rules with Nc determined for level-1 control ma- terial varied from 13s/22s/R4s/41s/8x with Nc=4 for urobilinogen to 13.5s with Nc=2 for pH. For level-2 control materials, the control rules varied from 13s/22s/R4s/41s/8x with Nc=4 for pH to 13.5s with Nc=2 for glucose. For level-3 control material, the control rules varied from 13s/2of32s/R4s/31s/6x with Nc of 6 for bilirubin to 13.5s
with Nc=3 for protein.
Combining the results from all lots, the sigma metric ranged from 4.54 (urobilinogen) to 18.51 (pH) for level-1 control mate- rial, from 1.96 (pH) to 7.50 (bilirubin) for level-2 control mate- rial, and from 3.75 (bilirubin) to 5.81 (protein) for level-3 control material. Control rules with Nc determined for level-1 and level-3 control materials varied from 12.5s with Nc=6 (for bilirubin in level-3 control material) to 13.5s with Nc=2 (for RBC, ketone, glu- cose, leukocyte, and pH in level-1 control material). For level-2 control material, control rules with Nc ranged from 13s/22s/R4s/41s/8x
with Nc=4 (for RBC, ketone, leukocyte, and pH) to 13.5s with Nc=2 (for urobilinogen and glucose) (Table 3).
DISCUSSION
We determined the sigma metric and derived appropriate con- trol rules for IQC from URST quantitative readout values. For level-1 control material with an expected result of negative grade (−), the sigma metrics of URSTs mostly exceeded 4, represent- ing the performance level of average quality in the industry.
Control rules determined based on the sigma metric ranged from 12.5s with Nc=2 or 3 to 13.5s with Nc=2 or 3.
In URSTs, quantitation of an analyte present in a urine sample is important, but detecting the presence of the analyte may be considered clinically more important. The cut-off can be consid- ered to be located somewhere between a negative grade (−) and a positive grade (+) test result. Although the control mate- rial set was not designed to assign a cut-off value of the analyte, it is presumed that manufacturers have ensured a high URST measurement capability at the decision cut-off between the ab- sence and presence of an analyte. Such an estimate is consis- tent with the trend of a higher sigma metric obtained with test results with lower grade (−) control material than with higher grade (3+) control material. This assumption can explain the different findings for bilirubin, urobilinogen, and protein for the level-2 control material, which had a slightly higher change %R, than for the level-1 control material, which tended to show a higher sigma metric than level-1 control material, even though the control material of both levels had the same expected test result of negative grade (−) or trace grade (±). This is because the analyte concentration of the level-2 control material with a higher change %R will be closer to the cut-off than that of the level-1 control material.
Table 3. Sigma metrics and control rules for IQC of URSTs derived from each level of control material across all lots (N=856)
Analyte Level Grade Mean SD CV (%) TEa Sigma
metric Control rules Pfr Ped Nc R
RBC 1 – −0.68 3.11 460.56 19.00 6.11 13.5s <0.01 >0.89 2 1
2 3+ 123.85 8.84 7.14 31.50 3.56 13s/22s/R4s/41s/8x 0.03 0.94 4 2
Bilirubin 1 – −0.62 2.18 352.32 14.50 6.64 13.5s <0.01 >0.96 3 1
2 – 1.76 1.93 109.5 14.50 7.5 13.5s <0.01 >0.96 3 1
3 3+ 73.66 3.87 5.25 14.50 3.75 12.5s 0.06 0.91 6 1
Urobilinogen 1 ± −0.07 2.65 3,972.33 12.00 4.54 12.5s 0.04 0.98 4 1
2 ± 3.03 1.94 63.99 12.00 6.19 13.5s <0.01 >0.89 2 1
Ketone 1 – 0.30 1.89 621.45 13.00 6.89 13.5s <0.01 >0.89 2 1
2 3+ 73.08 3.93 5.38 15.00 3.82 13s/22s/R4s/41s/8x 0.03 0.98 4 2
Protein 1 – −2.07 3.27 158.12 18.50 5.65 13.5s <0.01 >0.96 3 1
2 – 11.66 2.52 21.57 18.50 7.35 13.5s <0.01 >0.96 3 1
3 3+ 94.21 3.62 3.84 21.00 5.81 13.5s <0.01 >0.96 3 1
Glucose 1 – −1.01 5.94 587.91 77.50 13.05 13.5s <0.01 >0.89 2 1
2 3+ 235.63 9.69 4.11 65.00 6.71 13.5s <0.01 >0.89 2 1
Leukocytes 1 – −0.79 2.76 351.21 16.00 5.79 13.5s <0.01 >0.89 2 1
2 3+ 74.06 5.49 7.41 16.50 3.01 13s/22s/R4s/41s/8x 0.03 0.63 4 2
pH 1 5 18.43 0.81 4.40 15.00 18.51 13.5s <0.01 >0.89 2 1
2 7.5 121.13 21.7 17.91 42.50 1.96 13s/22s/R4s/41s/8x 0.03 0.05 4 2
Abbreviations: IQC, internal quality control; URST, urine reagent strip test; TEa, total allowable error; Pfr, probability of false rejection; Ped, probability of error detection; Nc, number of control measurements made; R, number of runs over which the control rules are applied; RBC, red blood cells.
The sigma metric and corresponding QC rules are obtained for each of the two or three levels of control materials constitut- ing the control material set. However, two to three control rules cannot be used simultaneously. Therefore, to determine the QC rules to be applied in practice, only one level of control material must be chosen. When the control material set is designed to have expected test results of negative (−) and three positive (3+) grades, it would be better to select the control rule obtained from level-1 control material, which has an expected test result of negative grade (−). When the control material set contains expected test results of two identical grades, such as negative grade (−) or trace grade (±), it is considered desirable to select a control rule derived from level-2 control material, which shows a higher change %R and is closer to the cutoff.
Although the SD was used to calculate the sigma metric and derive control rules in this study, the same precision based on the CV could be compared with that obtained in a previous study.
Cho, et al. [25] assessed a urine dipstick test for microalbumin- uria from the same manufacturer and found that the within-run CV (N=10) for albumin at 1, 3, 8, and 15 mg/dL was in 3.0%–
15.4%. Although the mean value of each level was not pre- sented, the CV was calculated from the change %R, similar to the method used in the current study. The nearest level used in the current study for comparison with these previous results was level-2 control material (10 mg/dL of protein), and the CV was 19.61%–25.88%. For a level-1 control material with an ex- pected test result of negative grade (−) (0 mg/dL of protein), CVs were more than several hundred percent, which could not be compared.
Quantitative datasets used in most studies on URST precision evaluation were small and were obtained during a short period [9, 22–26]. Another important aspect to consider is the different types of readout values among studies and systems. The CVs obtained in studies using reflectance rate data were lower for control materials with expected test results of lower grades than for those with expected test results of higher grades, because the reflectance rate is inversely related to the analyte concentra- tion [6, 22, 24, 26, 32, 33]. Under such conditions, even when using the CV and TEa as a percentage, it is possible to obtain a sigma metric and control rules at lower analyte concentrations, in which the quantitative readout value is high and the CV is low. URST precision using the change %R would not be com- parable with that obtained using the reflectance rate for either SD or CV at low concentrations.
In previous studies on URSTs using quantitative data, the readout values from a grade were compared with the analyte
concentrations obtained from a chemistry analyzer, or with the blood cell count obtained from a urine particle analyzer or mi- croscope [6, 22–26, 29, 32, 33]. This is the first study to use URST quantitative readout data for statistical IQC. The readout values from each analyte were quantitatively evaluated for preci- sion, which was then used to derive control rules. At low con- centrations, the CV of change %R was too large to obtain a sigma metric, which was overcome by using the SD instead of the CV [27]. We believe that the present data better reflect the real-world performance of URSTs, because we analyzed data from 19 months of use with 4–5 lots of control materials as op- posed to data collected over a short period.
The current study had some limitations. First, because the analyte concentration in control materials was too low or too high, in most cases, the difference from a midpoint was taken from a higher or lower grade for use as a TEa in that grade. In particular, the TEa for a level-1 control material was taken from an upper grade, and it may therefore have been underesti- mated. The predefined range of change %R for level-1 control material was wider than that for other levels for all analytes.
Therefore, the sigma metric also may have been underesti- mated. Second, bias was not considered in determining the sigma metric, which may have led to overestimation. These two effects on the sigma metric may have offset each other. Third, the concentration of the level-1 control material with an ex- pected test result of negative grade was close to, but not exactly the clinically important concentration. Therefore, in future stud- ies, performance needs to be evaluated using control materials with low analyte concentrations obtained from a third-party manufacturer. Fourth, the use of the difference in the midpoint change %R between two adjacent grades as the TEa may re- quire in-depth investigation in subsequent studies. Moreover, TEa was derived from the manufacturer’s predefined range table of change %R, and therefore, the TEa of other URSTs may vary depending on the product. Finally, and most importantly, the difference in midpoint change %R between adjacent grades used as the TEa does not correspond with either of outcome model, biological variation, or state of the art, which can be used as analytical performance specifications (APS) [34]. How- ever, with the collection of data from multicenter laboratories us- ing the same type of URST, the total error of change %R can be calculated and modified as TEa, which would provide the APS based on the state of the art of the measurement [34]. Until such data are available, the TEa set by the method devised in this study can be used.
In conclusion, although the URST is a semi-quantitative test,
statistical IQC can be performed, as in routine practice for clini- cal chemistry tests, using the quantitative readout value. At clin- ically significantly low analyte concentrations, most of the sigma metrics exceeded 4. Depending on the metric, 12.5s with Nc=2 or 3 to 13.5s with Nc=2 or 3 could be recommended as a control rule for IQC of a URST in routine clinical practice.
ACKNOWLEDGEMENTS
We would like to thank JeongSun Park and Yong Chan Yun of YD Diagnostics for the technical support with the URiSCAN Su- per Plus fully automated urine analyzer.
AUTHOR CONTRIBUTIONS
Conceptualization: Park H; Study design: Park H and Ko Y; Ad- ministration: Park H; Collection and assembly of data: Park H and Ko Y; Data analysis and interpretation: Park H; Manuscript writing (original draft): Park H; Manuscript writing (review and editing): Park H and Ko Y; Final approval of manuscript: Park H and Ko Y.
CONFLICTS OF INTEREST
None declared.
RESEARCH FUNDING
None declared.
ORCID
Haeil Park https://orcid.org/0000-0002-1092-0607 Younsuk Ko https://orcid.org/0000-0002-0120-8941
REFERENCES
1. Cho SY and Hur M. Advances in automated urinalysis systems, flow cy- tometry and digitized Microscopy. Ann Lab Med 2019;39:1-2.
2. Kwon YE, Oh DJ, Kim MJ, Choi HM. Prevalence and clinical character- istics of asymptomatic pyuria in chronic kidney disease. Ann Lab Med 2020;40:238-44.
3. Kim H, Kim HR, Kim TH, Lee MK. Age-specific cutoffs of the Sysmex UF-1000i automated urine analyzer for rapid screening of urinary tract infections in outpatients. Ann Lab Med 2019;39:322-6.
4. Kim H, Kim YO, Kim Y, Suh JS, Cho EJ, Lee HK. Small red blood cell fraction on the UF-1000i urine analyzer as a screening tool to detect dysmorphic red blood cells for diagnosing glomerulonephritis. Ann Lab
Med 2019;39:271-7.
5. Oyaert M and Delanghe J. Progress in automated urinalysis. Ann Lab Med 2019;39:15-22.
6. Vuljanić D, Dojder A, Špoljarić V, Saračević A, Dukić L, Leniček-Krleža J, et al. Analytical verification of 12 most commonly used urine dipsticks in Croatia: comparability, repeatability and accuracy. Biochem Med (Za- greb) 2019;29:010708.
7. Rota C, Biondi M, Trenti T. Evaluation of Aution Max AX-4030 and 9UB Uriflet, 10PA Aution Sticks urine dipsticks in the automated urine test strip analysis. Clin Chem Lab Med 2011;50:139-46.
8. Hoffmann P, Hoffmann C, Ziebig R, Zimmermann M. Evaluation of the iChem® Velocity™ urine chemistry analyzer in a hospital routine labo- ratory. Clin Chem Lab Med 2011;49:509-13.
9. European Confederation of Laboratory Medicine. European urinalysis guidelines. Scand J Clin Lab Invest Suppl 2000;231:1-86.
10. Kouri T, Laippala P, Kutter D, Gant V, Hallander H, Guder WG. Quality specifications for ordinal scale measurements with multiproperty (multi- ple) urine test strips. Scand J Clin Lab Invest 1999;59:523-6.
11. Pum JKW. Evaluation of analytical performance of qualitative and semi- quantitative assays in the clinical laboratory. Clin Chim Acta 2019;497:
197-203.
12. Lim S, Yu HJ, Lee S, Park H, Kwon MJ, Woo HY. Evaluation of the URiSCAN 2 ACR Strip to estimate the urine albumin/creatinine ratios. J Clin Lab Anal 2018;32:e22289.
13. Xia J, Chen SF, Xu F, Zhou YL. Quality specifications of routine clinical chemistry methods based on sigma metrics in performance evaluation.
J Clin Lab Anal 2018;32:e22284.
14. Cao S and Qin X. Application of Sigma metrics in assessing the clinical performance of verified versus non-verified reagents for routine bio- chemical analytes. Biochem Med (Zagreb) 2018;28:020709.
15. Zeng Y, He H, Qin K, Zhang M, An Z, Huang H. Practical application of the sigma-metric run size nomogram for multistage bracketed statistical quality control analysis of eight enzymes. Clin Chim Acta 2019;492:57- 61.
16. Đido V, Ćorić J, Mujić J, Panjeta M, Bodulović A, Marjanović M. Deter- mination of Six Sigma metric in control of enzymes determination in hu- man serum. Clin Lab 2019;65.
17. Li R, Wang T, Gong L, Peng P, Yang S, Zhao H, et al. Comparative anal- ysis of calculating sigma metrics by a trueness verification proficiency testing-based approach and an internal quality control data inter-labora- tory comparison-based approach. J Clin Lab Anal 2019;33:e22989.
18. Park H and Cho J. Comparison of method group precision in proficien- cy testing of clinical chemistry tests before and after two major changes:
reorganization of proficiency testing and implementation of the differen- tial benefit for the quality of laboratory tests. Ann Lab Med 2019;39:
333-9.
19. Huh HJ, Park YM, Lee S, Ihm C, Seo S, Lee SG, et al. Sigma-metrics of electrolyte tests from a recently launched new-generation proficiency testing program of the Korean Association of Quality Assurance for Clini- cal Laboratory. Ann Lab Med 2017;37:339-42.
20. Zhou B, Wu Y, He H, Li C, Tan L, Cao Y. Practical application of Six Sig- ma management in analytical biochemistry processes in clinical set- tings. J Clin Lab Anal 2020;34:e23126.
21. Hens K, Berth M, Armbruster D, Westgard S. Sigma metrics used to as- sess analytical quality of clinical chemistry assays: importance of the al- lowable total error (TEa) target. Clin Chem Lab Med 2014;52:973-80.
22. Oyaert M and Delanghe JR. Semiquantitative, fully automated urine test strip analysis. J Clin Lab Anal 2019;33:e22870.
23. Oyaert MN, Himpe J, Speeckaert MM, Stove VV, Delanghe JR. Quanti- tative urine test strip reading for leukocyte esterase and hemoglobin
peroxidase. Clin Chem Lab Med 2018;56:1126-32.
24. Delanghe JR, Himpe J, De Cock N, Delanghe S, De Herde K, Stove V, et al. Sensitive albuminuria analysis using dye-binding based test strips.
Clin Chim Acta 2017;471:107-12.
25. Cho MC, Ji M, Kim SY, Choe W, Lee W, Chun S, et al. Evaluation of the URiSCAN super cassette ACR semiquantitative urine dipstick for micro- albuminuria screening. J Clin Lab Anal 2014;28:281-6.
26. Decavele AS, Fiers T, Penders J, Delanghe JR. A sensitive quantitative test strip based point-of-care albuminuria screening assay. Clin Chem Lab Med 2012;50:673-8.
27. Westgard S, Bayat H, Westgard JO. Analytical Sigma metrics: a review of Six Sigma implementation tools for medical laboratories. Biochem Med (Zagreb) 2018;28:020502.
28. Park HI, Chae H, Kim M, Lee J, Kim Y. LEGO plot for simultaneous ap- plication of multiple quality requirements during trueness verification of quantitative laboratory tests. J Clin Lab Anal 2014;28:147-56.
29. Ko K, Kwon MJ, Ryu S, Woo HY, Park H. Performance evaluation of
three URiSCAN devices for routine urinalysis. J Clin Lab Anal 2016;30:
424-30.
30. Farrance I, Frenkel R, Badrick T. ISO/TS 20914:2019 - a critical com- mentary. Clin Chem Lab Med 2020;58:1182-90.
31. Westgard JO and Westgard SA. The quality of laboratory testing today:
an assessment of sigma metrics for analytic quality using performance data from proficiency testing surveys and the CLIA criteria for accept- able performance. Am J Clin Pathol 2006;125:343-54.
32. Penders J, Fiers T, Giri M, Wuyts B, Ysewyn L, Delanghe JR. Quantita- tive measurement of ketone bodies in urine using reflectometry. Clin Chem Lab Med 2005;43:724-9.
33. Penders J, Fiers T, Delanghe JR. Quantitative evaluation of urinalysis test strips. Clin Chem 2002;48:2236-41.
34. Ceriotti F, Fernandez-Calle P, Klee GG, Nordin G, Sandberg S, Streichert T, et al. Criteria for assigning laboratory measurands to models for ana- lytical performance specifications defined in the 1st EFLM Strategic Conference. Clin Chem Lab Med 2017;55:189-94.