An Emerging Technology Trend Identifier Based on the Citation and the Change of Academic
and Industrial Popularity
†학계와 산업계의 정보 대중성 변동과 인용 정보에 기반한 최신 기술 동향 식별 시스템
*
Seonho Kim(김선호)*, Junkyu Lee(이준규)**,
Waqas Rasheed(와카스 라시드)***, Woondong Yeo(여운동)****
목 차
Ⅰ. Introduction
Ⅱ. Methods
Ⅲ. Conclusions and Future Work
국 문 요 약
본 연구는 대용량 학술 및 특허 데이터 분석을 기본으로하여 중소 기업이 필요로 하는 유망기술을 도출하는 모형을 제시하고자 하였다. 유망기술 발굴은 국가와 기관의 주요 결정권자가 시간이나 돈과 같은 제한된 자원을 효과적으로 사용할 수 있게 하기 위한 중요한 연구이다. 많은 연구자들이 유망기술 발굴 방법에 대한 연구를 수행하고 있고 모델을 제시하고 있지만 아직까지 더 향상된 방법론의 개발이 필요하다.
이 논문은 학계와 산업계의 데이터를 동시에 이용하여 주어진 기술의 유망 기술 여부를 판단하는 모델을 제안한다. 대부분의 다른 유망기술 발굴 모델과는 다르게 이 논문에서 제안하는 모델은 완전 자동 학습 방식이 아닌, 전문가가 개입하는 준-자동 학습 방식의 기계 학습 방법을 이용한다. 이는 학 습 속도을 양보하고 대신 정확성을 높이기 위한 방법으로 유망기술 발굴 시스템의 원래 목적에 적당하 다. 또한 이 모델은 유망기술 초기 신호를 감지하기 위해 학술 데이터의 인용정보를 분석하여 학습하도 록 하였다.
핵심어 : 유망기술, 트렌드 감지, 기계학습, 인공 뉴럴네트워크, SCOPUS, PATSTAT
※ 논문접수일: 2011.10.25, 1차수정일: 2011.12.10, 게재확정일: 2011.12.27
† Thanks go to Korea Ministry of Education, Science And Technology for support of grants K-11-L05-C03-S02 for this research.
* 한국과학기술정보연구원 선임연구원, [email protected], 02-3299-6281
** 고려대학교 석사과정, [email protected], 02-3290-3566
*** 고려대학교 박사과정, [email protected], 02-3290-3566
**** 한국과학기술정보연구원 선임연구원, [email protected], 02-3299-6017, 교신저자
ABSTRACT
Identifying Emerging Technology Trends is crucial for decision makers of nations and organizations in order to use limited resources, such as time, money, etc., efficiently. Many researchers have proposed emerging trend detection systems based on a popularity analysis of the document, but this still needs to be improved.
In this paper, an emerging trend detection classifier is proposed which uses both academic and industrial data, SCOPUS and PATSTAT. Unlike most pre-vious research, our emerging technology trend classifi-er utilizes supervised, semi-automatic, machine learning techniques to improve the precision of the results. In addition, the citation information from among the SCOPUS data is analyzed to identify the early signals of emerging technology trends.
Key Words : Emerging technology, Trend detection, Machine learning, Artificial neural network, SCOPUS, PATSTAT
I. Introduction
Most OECD countries, including Korea, are striving for economic growth and innovation.
One of the major efforts of Korea government is to support medium and small-sized enterprises to develop their own competitive technologies by advising promising future technologies suitable for each companies. Detecting emerging technology trend is a key technology for this purpose.
Research on emerging technology trend detection has been conducted by many researchers and organizations, because identifying emerging trends and predict-ing the near future can improve efficient resource distribution and effective policy establishment.
Traditional research on detecting emerging trends is based on massive data analysis, literature review, and brainstorming of intellectuals (Shibata, Kajikawa, & Matsushima, November 2008). However, as the amount of informa-tion to analyze increases and computing technology develops, recent trends of this research are focused on automating the processing by utilizing text mining and data analysis techniques (Kontostathis, Galitsky, Pottenger, Roy, & Phelps, 2003; Smalheiser, October 2001). In this study, we propose a semi-automatic ma-chine learning technology for recognizing emerging technology trends from academic and industrial text data. The experiments, training features, training data, and evaluation data used in this study are new or extended version of those used in our previous research (Kim et al., 2011).
II. Methods
1. Previous ResearchTraditional research on emerging trend detection in text data is conducted by two major methods, fully automatic detection and semi-automatic detection. The fully automatic methods, such as TimeMines (Swan & Jensen, 2000), VUDM (Kim, Spring 2008), and on-line event detection by Allan (Allan, Papka, & Lavrenko, 1998), have
employed unsupervised learning methods, in which learning is achieved in a fully automatic manner by detecting topics describing technologies to analyze their trends.
These approaches tend to show good performance in recall, which represents the portion of emerging trends found over the total number of emerging trends in the system, but only medium performance in precision, which expresses the rate of correctly determined emerging trends over the total number of trends found. The reason for the good recall of the method is that it uses bottom-up methods to test every possible combination of noun phrases as topics describing emerging trends. After finding topics, the trends of each topic are analyzed, and emerging trends are selected from among the topics based on certain criteria. However, the results of this approach can be noisy for some decision makers because, in most cases, the identification of several correct targets is more meaningful than identifying as many correct targets as possible without missing.
For this reason, in order to increase precision rather than the recall, semi-automatic methods which use supervised learning are attracting attention. These approaches, such as CIMEL (Roy, Gevry, & Pottenger, April 2002), PatentMiner (Lent, Agrawal, & Srikant, 1997), and HDDI (Pottenger, Kim, & Meling, 2001), use experts to provide guidance to the machine along with the training data. For example, the training data of the machine learning is tagged by the experts to identify whether or not the data is about an emerging trend, or the experts interact with the software during learning. Therefore, the machine can learn more correct patterns of emerging trends and classify new trends more pre-cisely.
2. Semi-automatic Supervised Machine Learning
Our proposed method is a semi-automatic system in which experts provide guidance to an artificial neural network machine learning system. The guidance from the experts in our system is the classification tags attached to the training data, so that the machine is directed as to whether or not the information currently being learned is about emerging technology. In a machine learning system, selecting the correct features for learning is most critical. HDDI (Pottenger et al., 2001) used the frequencies of concepts
(Figure 1) Emerging technology trend classifier
within a fixed length of periods and the count of concepts in semantically defined regions, which can be obtained automatically. Oh (Oh, Choi, Shin, Jeong, & Myaeng, March 2009) also provided the results of a comparison experiment for testing the strength of impact of the most famous features of trends generally used for emerging trend detection, such as change, persistency, stability, and volume. According to Oh’s result, the strongest impact feature of a trend is expressed by the change, stability, volume, and persistency in descending order. However, because every emerging trend detection systems have different purposes, available source data, and training methods, the features to be learned need to be selected and tested themselves. Our system uses both academic data, SCOPUS (Elsevier, 2011), and industrial data, PATSTAT (PATSTAT, 2011). Thus, in addition to the usual term-frequency based trend changes in academic data, the latency between the weak academic signal and the industrial legal activity
(patent application) could be trained. Also, our system uses a stability of change feature and a citation half-life feature, which are described in the next section, to train the stability and aging factor of technology. We assume that the age of the emerging technology is relatively young and young technology tends to have an unstable popularity and a later, short, citation half-life than matured technology.
This study consists of three stages, 1) emerging trend detection, 2) training data generation, and 3) learning and experimentation. Figure 1 shows the brief structure of the proposed system.
At stage 1, a set of emerging technology trends are identified from SCOPUS. The process contains cluster-ing, filtering, and naming. The field experts intervene during the process. After that, in the second stage, the training data is generated by extracting learning features from SCOPUS and PATSTAT. Experts also join in this process to add their guidance to the learning data.
3. Emerging Technology Trends
Detecting emerging trend from SCOPUS is conducted to generate tagged feature vectors of training data for neural network learning. Only 1% of the highly cited papers are used. The papers are clustered using the scientometrics techniques, which use the citation information, classification code, core paper identification, and shared term frequency. As a result of clustering, 512 clusters are identified. Then, about 50 field experts are selected for the naming of the clusters and voting on the prospects of the technologies as expressed by their names. Clusters that do not have any consistent topic, based on the knowledge of the field experts, are filtered out, and final 87 clusters are selected as emerging technology trends. From this result, 60 technologies are selected for positive training data. In addition, 26 matured, non-emerging, technologies, such as compact discs, fountain pens, optical character recognition, and bluetooth technology, are prepared as negative training data.
4. Feature Extraction and Tagging
An artificial neural network is trained with positive training data, which consist of
features from emerging technology trends, and negative training data, which consist of features from matured, non-emerging, technology trends.
The training features are extracted from SCOPUS and PATSTAT data from 1996 to 2010. Two types of feature, linguistic and statistical, are used. For the linguistic features, the trend change for 2 different periods from SCOPUS and PATSTAT are used. In addition, the stability of change is used. For statistical features, the citation half-life in SCOPUS is used.
The change value represents the slope of the change between the start and end point of the trend curve. A positive change value means that the trend is emerging, while a negative change value means that the trend is submerging (Oh et al., March 2009).
(1)
(2)
The change feature is obtained by calculating the linear regression, which is represented by equations (1) and (2). In these equations,
f
is a trend function expressed by an independent value, time, and a dependent value, the popularity in SCOPUS and PATSTAT.LR
f is the linear regression function aboutf
.T
end expresses the popularity at the end point of the period of interest, andT
start is the popularity at the start point of the period. For the machine learning part of this study, four change features, 1) the change in the first 11 years in SCOPUS, 2) the change in the last 4 years in SCOPUS, 3) the change in the first 11 years in PATSTAT, and 4) the change in the last 4 years in PATSTAT, are extracted from one technology trend curve.The reason for dividing the period into two sections, 11 years and 4 years, is based on our basic interpretation about the data. Figure 2 and figure 3 show some examples of trend curves of emerging technologies in SCOPUS and PATSTAT, respectively, and both charts show that the trend curves changed noticeably in the last 4~5 years.
(Figure 2) Emerging technologies’ popularity in SCOPUS
(Figure 3) Emerging technologies’ popularity in PATSTAT
According to the figure 2, the popularity of emerging technology trends had increased steadily in the first 11 years and its changes escalated during the last 4 years in SCOPUS. In figure 3 the speed of change dropped rapidly during the last 4 years
in PATSTAT.
Another linguistic feature used for this study is the stability of change. The concept of stability is illustrated in Figure 4. In this chart, all the three trends showed the same degree of increase during the observed period. However, the degrees of the change of three trends, the difference from the common linear regression line, at each time interval between the start and end of the period are different. That is, the change of the blue trend is more stable than the change of the green trend because the difference of the blue trend from the linear regression line is smaller than that of the green trend.
(Figure 4) the concept of stability
The stability feature is normally used for measuring the strength of the trends, as in Oh (Oh et al., March 2009)’s experiment, however, in this study, it is employed by an assumption that the trends of academic and industrial documents of the matured, non-emerging, technologies will change stably, whether increase or decrease, because they are popular technology and well studied by many researchers already, while that of the emerging technologies change unstably. This assumption is based on the basic analysis of SCOPUS data.
The stability of the change in this paper is calculated by the equations expressed by (3) and (4).
(3)
(4)
where, the
n
is the number of time intervals<t
1, t
2, t
3, ... t
n>
betweenT
start andT
end.E
represent the set containing all the papers or patents related with the technology of concern.k
is a constant number between 0 and 1. Thus, the stability will be between 0 and 1. In this study, 0.9 is used fork
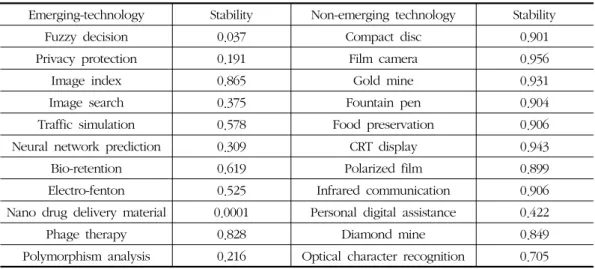
.Table 1 shows the examples of the stability of some emerging technologies and matured, non-emerging, technologies. Emerging technologies tend to show near-zero stability, while non-emerging technologies tend to show near 1 stability.
<Table 1> the examples of the stability
Emerging-technology Stability Non-emerging technology Stability
Fuzzy decision 0.037 Compact disc 0.901
Privacy protection 0.191 Film camera 0.956
Image index 0.865 Gold mine 0.931
Image search 0.375 Fountain pen 0.904
Traffic simulation 0.578 Food preservation 0.906
Neural network prediction 0.309 CRT display 0.943
Bio-retention 0.619 Polarized film 0.899
Electro-fenton 0.525 Infrared communication 0.906
Nano drug delivery material 0.0001 Personal digital assistance 0.422
Phage therapy 0.828 Diamond mine 0.849
Polymorphism analysis 0.216 Optical character recognition 0.705
The other type of feature selected for this study is the citation half-life, which is a statistical feature. The citation half-life is the number of years that have passed after half of the total number of citations concerning a particular technology. The citation
half-life represents the center of the total group of citations. Figure 5 illustrates the concept of citation half-lifetime.
(Figure 5) the concept of citation half-life
The number of citation on “nano drug delivery materials” increased steadily until its peak in 2008, and then it decreased rapidly until the present year, 2010. The total number of citations on the technology during the observation period in SCOPUS is 24,225 and the half of the total number of citations, 12,112.5, is met around 2005.
Therefore, the citation half-life of the “nano drug delivery material” technology is 4.93 years.
Every technology has a distinct trend in citation. Figure 6 shows the citation trends of some example emerging technologies. The trend curves tend to bias to the left or right based on the age of the technology. Ac-cording to the basic analysis of the source data, relatively new, or emerging, technologies, such as the “nano drug delivery material”, tend to have short citation half-life as shown in the Figure 5. In contrast, the matured, non-emerging, technologies, such as “compact disc” and “CRT display”, showed long citation half-life. The Figure 7 is an example of citation half-life of a non-emerging technology, “food preservation”.
(Figure 6) Emerging technologies’s citation number in SCOPUS
(Figure 7) the citation half-life of the technology “food preservation”
We include the citation half-life for learning feature because we assume that a emerging technology is relatively new, and the citation half-life is a good feature to represent the age of technology.
5. Learning
In this study, the feature vector, a series of feature entering to the machine for
training at one time, prepared for training the neural network for emerging technologies identification is consists of 6 real numbers and 1 integer, 1) the change in the first 11 years in SCOPUS, 2) the change in the last 4 years in SCOPUS, 3) the change in the first 11 years in PATSTAT, 4) the change in the last years in PATSTAT, 5) the citation half-life in SCOPUS, 6) the stability of change in the 15 years in SCOPUS, and 7) the decision tag to show whether or not emerging technology.
The goal of machine learning in this study is to edu-cate the neural network with the features of emerging technologies and non-emerging technologies, and evaluate the performance of the trained neural network as an emerging technology trend classifier.
During learning, a total 83 feature vectors, 57 from positive data and 26 from negative data, and tagged as to whether or not it is emerging technology, are entered into the neural network for training.
In the evaluation session, the precision of the classification performance is measured.
In order to evaluate the precision of the learned neural network model, 61 new feature vectors, which have not been used for training, are entered. The evaluation data is not tagged but are already classified by field experts and compared with the decisions made by the neural network.
6. Evaluation and Results
The final status of a neural network, the learned status, is different in every trial, even if it is trained with identical training data, because the neural network assigns random initial weights to the links among the neurons in the hidden layers. Therefore, we repeated the training and evaluations 10 thousand times, with the same evaluation data, and determined the average precision and a standard deviation.
The average precision of classification of the neural network is 70.47% and the standard deviation is 0.39. Regarding precision only, this result is better than the normal precision rate, which is about 45, for normal un-supervised learning for emerging trend technology.
Another round of experiment is performed to test the impact of including the stability feature for emerging technology identification. In this experiment, the stability is
excluded from the training and the performance is measured by the same way with the previous round. The performance of the neural network without the stability feature is 74.48% and the standard deviation is 0.38.
As a result, excluding the stability feature from training performed better. We interpret this that the stability is not a strong positive feature for distinguishing an emerging technology from non-emerging technology.
The performance of our neural network model can be improved by iterative tuning of the training data by filtering out noisy data and adding correct data. Also, the standard deviation can be decreased by enlarging the size of training data.
III. Conclusions and Future Work
An emerging technology trend identification system is proposed, which is based on semi-automatic supervised machine learning technology, and its performance is evaluated.
Our method learns from both academic data, SCOPUS, and industrial data, PATSTAT.
The change in trend, the stability of change, and citation half-life is selected as the learning feature. By using a supervised learning method, our system places the focus on enhancing the precision of classification rather than recall. This system can be applied for fast classification of emerging technology, such as a real time online technology evaluator or competitive intelligence system.
One of the limits of our approach is that our method depends solely on the past literature data and doesn’t include any economical and sociological variables, which are normally used in traditional qualitative approaches to emerging technology trend identification. In additions, the testing of the influences and impacts of each learning features are not covered in this research. Therefore, for future work, we will extend this research to conduct a systematic inquiry to identify the meaningful economical and sociological features from experts, to evaluate the impacts of each learning factors on the performance of the system. In addition, we will tune the training data to make the learning process more efficient. Also, a larger volume of training data and evaluation data may im-prove the precision of the classifier. Furthermore, we plan to apply the standard test set for emerging trend detection, such as the Topic Detection and Tracking
(TDT) corpora (NIST, 2011), to make our system applicable as a general purpose topic detection system. Finally, we will test more various trend features, such as changes and statistics about search queries.
References
Allan, J., Papka, R., & Lavrenko, V. (1998). “On-line New Event Detection and Tracking”, Paper presented at the the 21st Annual International ACM SIGIR Conference on Research and Development in Information Retrieval, Melbourne, Australia, 37-45.
Elsevier. (2011). SCOPUS, from http://info.scopus.com/
Kim, S. (Spring 2008).
Visualizing Users, User Communities, and Usage Trends in Complex Information Systems Using Implicit Rating Data
, Dissertation, Department of Computer Science. Blacksburg, VA, USA: Virginia Tech.Kim, S., Yeo, W., Coh, B.-Y., Rasheed, W., & Kang, J. (2011). “A Semi-Automatic Emerging Technology Trend Classifier Using SCOPUS and PATSTAT”, International Conference on Integrated Information IC-ININFO 2011, Greece: I-DAS Press, 50.
Kontostathis, A., Galitsky, L., Pottenger, W. M., Roy, S., & Phelps, D. J. (2003).
A Survey of Emerging Trend Detection in Textual Data Mining
.Lent, B., Agrawal, R., & Srikant, R. (1997).
Discovering Trends in Text Databases
, AAAI Press.NIST. (2011). TDT. “Topic Detection and Tracking Evaluation”, from http://www.itl.nist.
gov/iad/mig/tests/tdt/index.html
Oh, H.-S., Choi, Y., Shin, W., Jeong, Y., & Myaeng, S.-H. (March 2009). “Trend Properties and a Ranking Method for Automatic Trend Analysis”, Journal of KIISE: Software and Applications, 36(3), 236-243.
PATSTAT. (2011). EPO Worldwide Patent Statistical Database, 2011, from http://www.
epo.org/searching/subscription/raw/product-14-24.html
Pottenger, W. M., Kim, Y.-B., & Meling, D. D. (2001). “HDDI: Hierarchical Distributed Dynamic Indexing”, In R. L. Grossman (Ed.),
Data Mining for Scientific and Engineering
Applications
. New York, LLC: Springer-Verlag, Chapter 18.Roy, S., Gevry, D., & Pottenger, W. M. (April 2002). “Methodologies for Trend Detection in Textual Data Mining”, Paper presented at the the Textmine 2002 Workshop, Second SIAM International Conference on Data Mining, Arlington, VA.
Shibata, N., Kajikawa, Y., & Matsushima, K. (November 2008). “Detecting emerging research fronts based on topological measures in citation networks of scientific publications”, Technovation, 28(11), 758-775. doi: 10.1016/j.technovation.2008.03.009.
Smalheiser, N. R. (October 2001). “Predicting emerging technologies with the aid of text-based data mining: the micro approach”, Technovation, 21(10), 689-693. doi:
10.1016/S0166-4972(01)00048-7.
Swan, R., & Jensen, D. (2000). “Timemines: Constructing timelines with statistical models of word usage”, Paper presented at the the Sixth ACM SIGKDD International Conference on Knowledge Discovery and Data Mining, Boston, MA, USA.
김선호
2008년 미국 버지니아공과대학교(Virginia Tech) 대학원에서 컴퓨터과학전공 공학박사를 취득하였 으며, 현재 한국과학기술정보연구원 정보분석본부에 선임연구원으로 재직 중이다. 주요 연구 분야는 지능형정보시스템, 데이터마이닝, 미래유망기술 발굴, 인공지능 및 자연어처리이며, 현재 기술기회발 굴(Technology Opportunity Discovery) 모델 연구를 수행하고 있다.
이준규
고려대학교 정보통신대학 컴퓨터학과를 졸업하고, 현재 동대 컴퓨터학과 데이터 마이닝 연구실에서 석사과정 중이다. 주요 관심 분야는 데이터 마이닝과 오피니언 마이닝이고 현재 SNS를 이용한 오피 니언 마이닝 연구를 수행하고 있다
Waqas Rasheed
Pakistan Swabi의 Ghulam Ishaq Khan Institute of Engineering Sciences and Technology 에서 Computer System Engineering을 전공하고, 2009년 조선대학교에서 정보 통신 공학으로 석사학위 취득. 현재 고려대학교에서 박사학위 중이다. 주요 관심 분야는 멀티미디어 통신, 데이터 마이닝, 기계 학습이다.
여운동
고려대학교에서 정보통신대학 컴퓨터학 박사과정을 수료하고, 현재 한국과학기술정보연구원 정보분석 본부에 선임연구원으로 재직 중이다. 주요 연구 분야는 계량정보분석, 데이터마이닝, 미래유망기술 발 굴, 정보가시화, 추천시스템이며, 정보분석시스템인 KnowledgeMatrix와 Landscope를 개발하였다.