In photogrammetry, a 3-dimensional model gives a better way of understanding about the nature of the object of interested areas such as Earth surface when it is shown as elevation, top view or section of object.
It is also useful for assessment of interpreting spatial detail information in generation of geologists, other field scientists and military photo interpreters. Thus provision of stereo 3D viewing facility is regarded by most photogrammetrists as being a complete necessity for their operations. A stereo 3D viewing facility is also a vital element in carrying out map revision and the editing of the digital elevation data
(DEMs) produced by automatic image matching techniques. In other fields, new auto-stereoscopic techniques are now being developed and hopefully will allow true 3D stereoscopic views. In particular context, developments in auto-stereoscopy has been forthcoming from the entertainment industry such as 3D stereoscopic products in the cinema, TV and video games. There is also a considerable interest from the medical profession in the use of 3D stereo images in certain types of surgical procedures and in the 3D stereo-visualization of computer tomography and magnetic resonance scans (Gordon Petrie, 2001).
We can feel the height difference of one object relative to the other if we see with our two eyes in a
Stereoscopic 3D Modelling Approach with KOMPSAT-2 Satellite Data
T.Tserennadmid
†
and Taejung Kim Department of Geoinformatic Engineering, Inha University
Abstract : This paper investigates stereo 3D viewing for linear pushbroom satellite images using the Orbit-Attitude Model proposed by Kim (2006) and using OpenGL graphic library in Digital Photogrammetry Workstation. 3D viewing is tested with KOMPSAT-2 satellite stereo images, a large number of GCPs (Ground control points) collected by GPS surveying and orbit-attitude sensor model as a rigorous sensor model. Comparison is carried out by two accuracy measurements: the accuracy of orbit- attitude modeling with bundle adjustment and accuracy analysis of errors in x and y parallaxes. This research result will help to understand the nature of 3D objects for high resolution satellite images, and we will be able to measure accurate 3D object space coordinates in virtual or real 3D environment.
Key Words : OA (Orbit-attitude model), KOMPSAT-2, Stereo 3D viewing, OpenGL, DPW (Digital Photogrammetry Workstation), stereoscopic.
Received May 21, 2009; Revised June 26, 2009; Accepted June 30, 2009.
stereoscopic system, which is the most common method for obtaining 3D information perception of object. Moreover, if we can see one object from two different positions (left eye and right eye) we can get the stereo 3D view in stereoscopic vision of photogrammetry, and depth perception is achieved.
Images from satellites are taken with overlaps to have a stereo view of the objects. These overlapping satellite images, if kept in the same orientation as at the time of photography, stereo 3D view of the object is created. The 3D model thus created then is used for taking 3D measurements, which is the main objective of photogrammetry. Accurate and realistic 3D data collection requires stereoscopic perception and precise measurement, which obtained from a popular stereoscopic photogrammetric workstation.
Throughout the history of photogrammetry for over 150 years, this requirement has been met by merely using eyepieces or glasses attached to the equipment or operators. However, recent development in auto- stereoscopic technology provides alternatives to this convention (Jie Shan et al., 2006). Its potential utilization in photogrammetric practice has been brought to the attention of photogrammetrists and photogrammetry vendors.
Turning in remote sensing, even if 3D data such as DEM was used in reconstruction of 2D image formation, this usually takes the form of a flat 2D image appearing on a display screen or in hard-copy form (Gordon Petrie, 2001). Regarding the stereo 3d viewing of satellite imagery mainly focused on aspects of IKONOS and other satellite images for 3D positioning, building extraction and other GIS operations, and is available for adopted commercial softwares. Ridley et al., (1997) evaluated the potential of 1m high resolution satellite imagery for building extraction and findings were that only 73% and 86%
of buildings could be interpreted correctly using monoscopic and stereoscopic imagery (C.S. Fraser et
al., 2002). Janet E.Nichol et al, (2006) investigated state of art in remote sensing techniques for detailed landslide hazard assessment applicable to large areas using anaglyph (blue and red). The main goal of this 3D visualization to contributes additional, conceptual information to planimetric image interpretation.
To perform stereo 3D viewing, we need the photogrammetric estimation process of orientation parameters (viewing angle and position) accurately as possible. For this, sensor modeling technique is used to adjust orientation parameters to best fit precisely known image coordinates and ground coordinates.
The purpose of this research is to investigate highly accurate stereo 3D viewing with orbit-attitude models developed for linear pushbroom satellite images such as especially focusing on images from KOMPSAT-2 satellite, which was launched on 29
th
July 2006.
KOMPSAT-2 can acquire panchromatic images at 1m high resolution and multispectral images at 4m resolution. Orbit-attitude model has been adopted as the sensor model for analytical or digital photogrammetric workstations (Kim et al., 2006). We applied bundle adjustment process regarding orbit- attitude models using GCPs of each KOMPSAT-2 strips, and estimated rotation angles for left and right stereo model and patch ratio (patch scale) of left image and patch ratio of right image for stereo 3D viewing in Digital Photogrammetry Workstation. We used OpenGL graphic library for 3D displaying visualization.
2. Summary of Sensor Model and 3DDisplaying Method
1) Orbit-attitude model
Orbit-attitude model represents orientation
parameters as attitude angles, which are expressed by
Roll, Pitch, Yaw, and orbital parameters, expressed
(3)
by velocity vector V and satellite position vector P.
Roll axis is defined the direction of movement, yaw axis by the direction of the satellite position vector and pitch axis by the orthogonal axis to the two axes.
The orbital reference frame varies with time as a satellite moves continuously along its orbit. It can be represented either by orbital parameters such as inclination, right ascension of ascending node and mean anomaly or by satellite position and velocity vectors (Kim et al., 2006).
Orbit-attitude model is one of the rigorous models explaining the relationship between image coordinates and ground points using physical parameters of the sensor and platform (Kim et al., 2008). Mathematical representation of orbit-attitude model is following matrix form, which is expressed by Cartesian coordinate system.
= l [R
RPY
]
T
[R
PV
]
T
(1)
In above equation, l - scale factor
R
RPY
- rotation matrix from the sensor frame to the orbital reference frame which is expressed by attitude angle
R
PV
- rotation matrix from the sensor frame to the orbital reference frame which is expressed by satellite position and velocity
(x, y) - sensor coordinates (X, Y, Z) - ground coordinates f - focal length
(Xs, Ys, Zs)- coordinates for satellite position [ ]
T
- denoting transpose matrix
This model has nine exterior orientation parameters (three in the position vector, three in the velocity vector and three in attitude angles).
Here we can define order of rotation according to definition of rotation axes as below for KOMPSAT-2
satellite (Kim et al., 2006).
R
RPY
=
(2)
where,
R, P, Y -represented roll, pitch and yaw angles Similarly, we can define matrix of satellite position and velocity vectors using the exact definition of the orbital reference frame for KOMPSAT-2 satellite (Kim et al., 2006).
_
R
PV
=
_
(3)
_
where,
V
X
, V
Y
, V
Z
- represented the velocity vector L
P
- the magnitude of the position vector L
V
- the magnitude of the velocity vector 2) Bundle adjustment parameter sets
Initial values of coefficients of sensor model are first calculated using satellite ephemeris and attitude data. Bundle adjustments are estimated using model points and values of unknowns, and adjusting model parameters so that bundles of light rays can be located as closely as possible to given control points. This process is repeated for each model and each scene (Kim et al., 2006).
As before mentioned, orbit-attitude model is represented by orientation parameters, which provided in the metadata to have limited accuracy.
The errors in orientation parameters are represented as polynomial of times. Satellite position coordinate
Z
S
L
P
-X
S
V
Y
+V
X
Y
S
L
P
L
V
V
Z
L
V
Y
S
L
P
-Z
S
V
X
+V
Z
X
S
L
P
L
V
V
Y
L
V
X
S
L
P
-Y
S
V
Z
+V
Y
Z
S
L
P
L
V
V
X
L
V
xy-f Ï Ô Ô Ó
¸ Ô Ô ˛
X-X
S
Y-Y
S
Z-Z
S
Ï Ô Ô Ó
¸ Ô Ô ˛
cos Y cos P cos Y sin P sin R + sin Y cos R-sin Y cos P -sin Y sin P sin R + cos Y cos Rsin P-cos P sin R
-cos Y sin P cos R + sin Y sin R sin Y sin P cos R + cos Y sin R cos P cos R
Ï Ô Ô Ó
¸ Ô Ô ˛
Ï Ô Ô Ô Ô Ô Ô Ô Ó
¸ Ô Ô Ô Ô Ô Ô Ô
˛
(4)
and rotation angle is defined as a 2
nd
order polynomial functions of time, real position coordinates and rotation angles is represented as below for KOMPSAT-2 satellite:
X
s
= X
0
+ D
x
+ a
1
t + b
1
t
2
Y
s
= Y
0
+ D
y
+ a
2
t +b
2
t
2
(4) Z
s
= Z
0
+ D
z
+ a
3
t + b
3
t
2
where,
X
0
, Y
0
, Z
0
- position provided by the platform Dx, Dy, Dz - position biases
a
1
, a
2
, a
3
- position drift b
1
, b
2
, b
3
- position drift rates
Similarly, Roll, Pitch, Yaw (R, P, y) attitude angles are represented as below.
R = R
0
+ D
R
+ R
1
t + R
2
t
2
P = P
0
+ D
P
+ P
1
t + P
2
t
2
(5) y = y
0
+ D
y
+ y
1
t + y
2
t
2
where,
R
0
, P
0
, y
0
- rotation and attitude angles provided by platform
D
R
, D
P
, D
y
- biases R
1
, P
1
, y
1
- drifts R
2
, P
2
, y
2
- drift rate
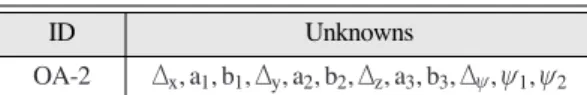
Among these coefficients we can define a specific set as adjustment parameters which depends on errors in satellite ephemeris and attitude data provided in the metadata. We used only second sets (OA-2) of orbit- attitude model as specified in Table 1.
3) Our approach
Firstly, after investigation of rigorous sensor models for orbit-attitude modeling through bundle adjustment process, we estimated absolute orientation from orbit-attitude modeling. By using the bundle
adjustment process, we can retrieve accurate exterior orientation parameters or accurate satellite orbit or attitude.
Secondly, we established a stereo model with conjugate points, which are calculated from backward mapping technique using 3D coordinates of object surfaces. Conjugate points should have no y-parallax in the scenes. Moreover, they should have x parallax that is relational to corresponding object height. This fact is important for many photogrammetric applications such as stereo 3D viewing, stereo matching and DEM extracting etc.
After bundle adjustment process, we obtained left roll, pitch and yaw rotation angles for rows of left image based on matrix equations (1) to (3). Then, we estimated transpose of left rotation matrix for roll, pitch and yaw rotation angles of right image. We defined rectangular patches with a fixed size (calculate patch ratio) for left and right target images by designing patch shapes according to affine transformation based on scene geometry because satellite images taken at different incidence angles will have different scale factors for patch of left Table1. Adjustment parameter sets used for orbit-attitude model
ID Unknowns
OA-2 D
x
, a
1
, b
1
, D
y
, a
2
, b
2
, D
z
, a
3
, b
3
, D
y
, y
1
, y
2
ID Unknowns
Fig. 1. Flow chart of present approach.
(5)
image and patch of right image. If images have been epipolar resampled, these patches would be sufficient.
If we assume an incident angle of the left image as aand incidence angle of the right image as b, patch ratio can be represented as below (Hae-Yeoun Lee at al., 2003).
Patch Ratio = cos(b) / cos(a) (6) Since all of these processes are performed, stereo 3D model is established completely. Fig.1 presents process flow of present approach of stereo 3D displaying.
In next section, we will discuss how to achieve 3D viewing by using OpenGL library.
4) 3D Displaying and Visualization
Stereo viewing is a technique to increase real time visualization and enhance user interaction with 3D scenes. As before mentioned, two views of a scene are created one for the left eye, one for the right eye.
The actual depth perception of objects is achieved based on the difference of their positions from the left and right eye views. Therefore, stereo 3D viewing is established based on it.
OpenGL is a powerful cross-platform graphics API, and supports quad buffered stereo rendering with left and right eye corresponding the left and right front and back color buffers independently. Quad- buffering is the ability to render stereo images and can be swapped in sync with shutter glasses while the back left and back right buffers are being updated - giving a smooth stereoscopic display.
In our case, hardware system consist of DPW which provides the capability of stereoscopic viewing and possibility to measure 3D information, shutter glasses which are two crossed and polarized layers per eye, and graphic card is capable of quad- buffering. Hardware specification of DPW is represented as below list:
Product Name Dell Inc. Precision Workstation T7400
The most popular stereoscopic technology is based on parallax barrier principle (Jie Shan et al., 2006).
To enhance depth perception, parallax is used in 3D stereoscopic viewing. Moreover, after establishing absolute orientation, because of x parallaxes, stereo model produces a little effects of cue for depth perception. By applying x parallax shift motion using keyboard button or mouse wheel, we can greatly enhance the sense of depth. Also, we implemented zoom in and zoom out functions.
In present approach, we summarized OpenGL routines according to calculated straightforward geometric considerations of stereo 3D model as below general steps and presented as Fig. 2.
1. Setup OpenGL stereo viewing using PFD_
STEREO which is stereoscopic buffer 2. Define left buffer for left eye and clear this
In this experiment, a panchromatic stereo pair of KOMPSAT-2 scenes covering Jeonnam area of South Korea is used. An overview of these scenes is shown in Fig. 3. Table 2 summarized the properties of image strips used in test.
2) Experiment result
Firstly, orientation parameters for the left image strip and right image strip were estimated separately through orbit-attitude model. Ground control points of the corresponding each strips were used for sensor modeling and estimating adjustment parameters.
Fig. 2. Flow chart of the stereo 3D displaying.
Table 2. Properties of Kompsat-2 stereo pairs
Strip ID No of GCP Acquisition Time Left Acquisition Time Right Area
Strip ID No of GCP Acquisition Time Left Acquisition Time Right Area
(7)
After estimating orbit-attitude model through bundle adjustment, we checked accuracy of orbit-attitude model (accuracy of bundle adjustment). Table3 and 4 show results of orbit-attitude sensor modeling with estimation of root mean square error for all models.
Each strip has about 16 ground control points. Results produced small pixel error and, verified that orbit- attitude modeling was established correctly.
Secondly, to check applied 3D rotation and scale of patch of left and right model after displaying stereo 3D model in stereoscopic system, we measured X (X
1
-X
2
, ..) and Y (Y
1
-Y
2
, ..) parallaxes between left and right models using measurement of screen pixel coordinates of left model (X
1
, Y
1
) and right model (X
2
, Y
2
) shown in Fig. 4. Even though some measured error values of x and y parallaxes were Fig. 3. KOMPSAT-2 left and right images a) image strip-62 b) image strip-64 c) image strip-63 d) image strip-66 e)
image strip-69 f) image strip-71.
Table 3. Accuracy of left model Strip ID RMS Error /pixel/
negative value, we calculated mean error estimation and root mean square error estimation for absolute values of x and y parallaxes. Fig. 4 shows examples of commonly produced errors in x and y parallaxes by the established 3D model. We collected check points from the left and right stereo model. The used number of distributed check points is 85 for all scenes. Table 5 and 6 shows the error analysis of x and y parallaxes between left and right models.
Result of the error analysis of parallaxes is high accuracy within 2 pixel errors. We tested stereo 3D viewing for extracted sub-image from the satellite images. As mentioned before, we considered that the calculated conjugate points are center point of extracted left and right sub-images. Thus, even if error of x and y parallaxes is depends on result of sensor modeling, there is no x-parallax around the
center part of sub-images, and there are x-parallaxes in other parts of sub-images. We can adjust the x- Fig. 4. Example of common produced x and y parallaxes.
Table 5. Errors in x-parallax of KOMPSAT-2 between stereo models /pixel/
Strip ID /x parallax/ ID-62 ID-63 ID-64 ID-66 ID-69 ID-71
RMSE 1.5 0.86 1.58 1.69 1.8 1.83
Mean 1.0 0.5 1.25 1.38 1.5 1.37
Max error 3.0 2.0 3.0 3.0 3.0 4.0
Min error 0.0 0.0 0.0 0.0 0.0 0.0
Strip ID /x parallax/ ID-62 ID-63 ID-64 ID-66 ID-69 ID-71
Table 6. Errors in y-parallax of KOMPSAT-2 between stereo models /pixel/
Strip ID /y parallax/ ID-62 ID-63 ID-64 ID-66 ID-69 ID-71
RMSE 0.79 0.79 0.61 0.93 0.79 0.93
Mean 0.62 0.62 0.37 0.65 0.4 0.88
Max error 1.0 1.0 1.0 2.0 1.0 1.0
Min error 0.0 0.0 0.0 0.0 0.0 0.0
Strip ID /y parallax/ ID-62 ID-63 ID-64 ID-66 ID-69 ID-71
Fig. 5. Stereo 3d viewing of KOMPSAT-2 images in DPW.
(9)
parallax by using keyboard button or mouse wheel for shifting position of images in the x direction.
Fig. 5 shows result images of stereo 3D viewing for present approach.
4. Conclusion
The stereo three dimensional view of a photographed object has important roles in photogrammetry and various research areas to the extent of virtual reality-3D environment. High resolution satellite images such as those from KOMPSAT-2 provide potentially useful information for the identification of individual surface objects such as building, threes and mountains etc,.
This research investigated new approach for KOMPSAT-2 images to establish stereo 3D viewing using accurately estimated exterior orientation parameters as bundle adjustment through orbit- attitude modeling on the DPW. In association with this development, DPW can handle the large amounts of digital image data such as satellite image that are required to produce high-quality stereo 3D viewing of satellite images interactively in real time on its monitor screen through sensor modeling, and can provide computational power. Stereo 3D viewing was achieved by depth perception. To gain and increase sensation of depth perception, parallax measurement is used with overlapping two images. Error analysis of x and y parallax measurement and result of sensor modeling were precise. Contribution of this research is especially for exact measurement of 3D position information of object point of interested areas, increasing realization for satellite image interpretation and image understanding.
Acknowledgements
This research was supported by a grant (07KLSGC03) from Cutting-edge Urban Development - Korean Land Spatialization Research Project funded by Ministry of Land, Transport and Maritime Affairs
References
Taejung Kim and Ian Dowman, 2005. Analysis of Sensor Model Accuracy on Estimating Exterior Orientation Parameters of Satellite Images, IEEE International Geoscience andRemote Sensing Symposium Proceedings, 25-29 July, 2005, Seoul, Korea
Jie Shan, Chiung-Shiuan Fu, Bin Li, James Bethel, Jeffrey Kretsch, and Edward Mikhail, 2006.
Principles and Evaluation of Autostereoscopic Photogrammetric Measurement, Photogram-metric Engineering & Remote Sensing, 72(4):
365-372
Petrie, G., 2001. 3D Stereo-viewing of digital imagery: Is autostereoscopy the future for 3D? , Geoinformatics, 4 (10): 24-29
Jacek, G. and Gene, D., 2003. Block Adjustment of High Resolution Satellite Images described by Polynomials, Photogrammetric Engineering
& Remote Sensing, 69(1): 59-68
Taejung Kim and Ian Dowman, 2006. Comparison of two physical sensor models for satellite images: Postion-rotation model and orbit attitude model, The Photogrammetric Record, 21(114): 110-123
Bourke, P., 1999. Stereo 3D viewing tutorials.
URL: http://astronomy.swin.edu.au/_pbourke/
stereographics/
(10)
Computer graphics. 2. OpenGL. I. Neider, Jackie. II.
Davis, Tom.
Tutorial of stereo geometry in OpenGL
Taejung Kim, 2005. Investigation on the Accuracy of bundle Adjustments and Exterior Orientation Parameter Estimation of Linear Pushbroom Sensor Models, Korean Journal of RemoteSensing, 22(1): 63-73.
Taejung Kim, 2006. Modeling Satellite Orbital Segments using Orbit attitude Models, Korean Journal of Remote Sensing, 22(1):
63-73.
Hae Yeoun Lee, Taejung Kim, Wonkyu Park, and Heung Kyu Lee, 2003. Extraction of Digital Elevation Models from satellite stereo images through stereo matching based on Epipolarity and Scene Geometry, Image and VisionComputing, 21(9): 789-796
Dongwook Kim and Taejung Kim, 2008, Modeling
of Absolute Orientation of Adjacent Satellite Image Strips using a few Ground Control Points, The International Archives of the Photogrammetry, Remote Sensing and Spatial Information Sciences. Vol. XXXVII. Part B1.
Beijing 2008.
Taejung Kim, Hyunsuk Kim, and Sooam Rhee, 2007.
Investigation of Physical Sensor Models for Modelling SPOT 3 Orbits, The Photogram-metric Record, 22(119): 257-273.
C. S. Fraser, E. Baltsavias, and A. Gruen, 2002.
Processing of Ikonos imagery for submetre 3D psitioning and building extraction, ISPRSJournal of Photogrammetry & RemoteSensing, 56: 177-194.