• 검색 결과가 없습니다.

Finite Element Analysis on Formability of Parabolic Shape

N/A
N/A
Protected

Academic year: 2021

Share "Finite Element Analysis on Formability of Parabolic Shape"

Copied!
6
0
0

로드 중.... (전체 텍스트 보기)

전체 글

(1)

* 남부대학교 자동차기계공학과

+ 교신저자, 남부대학교 자동차기계공학과 ([email protected]) 주소: 506-824, 광주광역시 광산구 월계동 864-1

Finite Element Analysis on Formability of Parabolic Shape

Sang-Won Chung*, Kyung-Won Lee

+

(Manuscript received: Mar, 20, 2012 / Revised: May, 16, 2012 / Accepted: May, 23, 2012)

포물선형상의 성형성에 관한 유한요소해석

정상원*, 이경원

+

Abstract

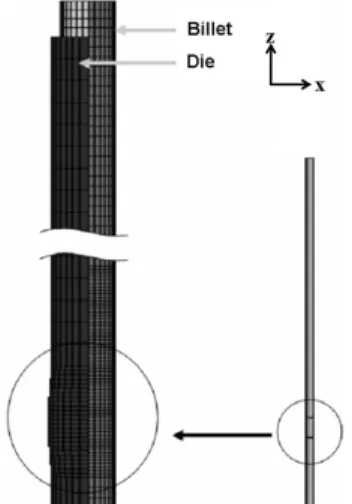
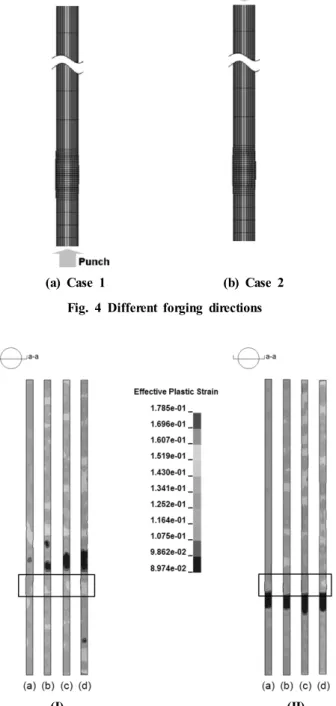
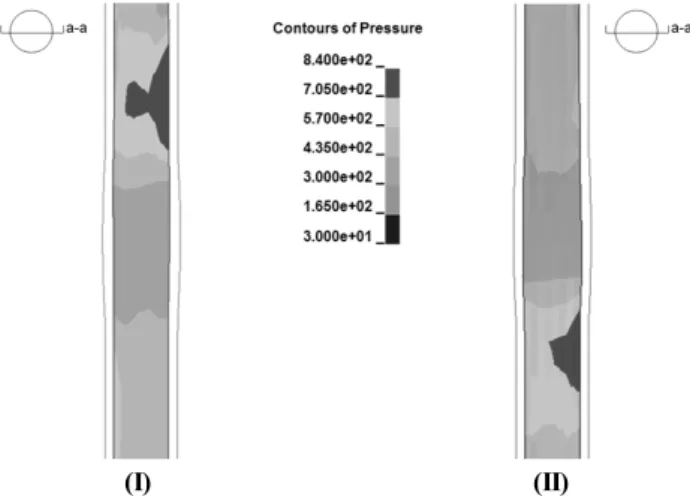
For the product with small diameter, long column, and parabolic shape, the forging formability of the high-carbon steel wire rod was investigated in this study. By using the three-dimensional finite element method, the formability of wire was reviewed by forming analysis for the desired parabolic shape of local part. Analysis results due to forging direction, forging velocity, friction coefficient and constraint location were also investigated. On the basis of these results, it is noted that the forging direction has the big influence when the product with long column is forged. As the forging velocity increases, buckling tends to be limited and formability of parabolic shape is improved. By constraining the lower parabolic shape part to suppress plastic strain, the effect depending on friction coefficient is not almost appeared. And good parabolic shape is obtained at the region of the forging velocity of more than 0.5 m/s.

Key Words : Three-dimensional finite element method(3차원 유한요소법), Forging(단조), Parabolic shape(포물선형상), Velocity(속도),

Coefficient of friction(마찰계수)

1. INTRODUCTION

High carbon steel wire rods manufactured by wire drawing process with carbon steel with the content of carbon more than 4% have been very widely used in the field of various automobile parts and entire industries. These high- carbon steel wire rods are alloy steel materials with excellent durability which can endure extreme loads. Jing et al.

(1)

, Kazeminezhad, and Taheri

(2)

and Pilarczyk et al.

(3)

had studied to search for optimal rolling process using high carbon steel wire rods. Wire rods produced by wire drawing process are

widely being used in industries after maintaining uniform cross sections without machining. It is true that, when wire rods produced by wire drawing process are used as a functional part after being modified to a shape particularly required, they are restricted by difficulties and regular shapes in forming such as buckling, etc.

Especially, for the wire with long column and its diameter less than Ø3.0 mm, productivity decreases because cutting process is difficult due to conditions of a finishing machine.

Also, the amount of material discarded by the cutting process can be significant and the material utilization can

Technical Papers

(2)

Table 1 Chemical composition (%) of high carbon steel wire rod (SWRH 55A)

Chemical element C Si Mn P S Cu

Composition (wt, %) 0.54 0.15 0.30 0.03 0.03 -

Fig. 1 Stress-Strain curve of SWRH55A

Fig. 2 Study model shape of a high carbon steel wire rod

Fig. 3 Illustration of finite element model drop. Therefore, it would be better to produce forged products

by using a die in order to increase material utilization and productivity of products. In order to make products with forging, the process on formability by a mold die should be established. However, for the product with small diameter, long column, and local shape, it may be difficult to ensure it's formability due to buckling and difficulties of filling in a local shape. There are little work done to evaluate the formability of long column and non reference specifically to wire rods. Most studies are those on bulk products.

In recent years, the finite element analysis of a forming process is fast becoming a useful technique for process design and selection of proper working conditions. Kim et al.

(4)

used the results from simulations as basic data for the selection of right press equipment and process parameters.

In this way, besides carrying out empirical experiments, simulation study using commercial LSDYNA finite element analysis software was also used to assist in evaluating the effect of different forging conditions. In this study, the forging formability of the high-carbon steel wire rod has been investigated by forming analysis on desired parabolic shape of a local part using the finite element method.

2. MODELING PROCEDURE

Chemical components of high-carbon steel wire rod used in this study are shown in Table 1. The stress-strain curve of SWRH55A was obtained from the material tensile test as shown in Fig. 1. The experimental data were entered in the table sheet of the analysis program. The parabolic shape intended to be formed as a functional part particularly required is shown in Fig. 2. The parabolic shape is located at 38.28 mm from the center away to one side and has an arc with a 76 mm radius.

In this study, finite element model was developed using LS-DYNA software as shown in Fig. 3 to study formability of a product which has a long column and a local parabolic shape. In the simulation, the billet is assumed to be a deformable body, whilst the die is assumed to be rigid body.

The billet was modeled as a homogeneous solid, 3744

hexahedral elements. These elements were used to prevent

meshing and hourglassing problems in the contact region,

and improve the accuracy of the solution

(5)

. Williams

(6)

assigned the LSDYNA rigid material model to the die

modeled as shell elements because die deformation is

(3)

(a) Case 1 (b) Case 2 Fig. 4 Different forging directions

(I) (II)

Fig. 5 Effective plastic strain distribution inside the section a-a at the end of forging operation : (I) Case 1, (II) Case2 at (a) 0.5 m/s, (b) 5 m/s, (c) 10 m/s and (d) 20 m/s negligible compared to its overall motion. Using rigid bodies

to define stiff parts in FEA also reduces the computation time for an explicit analysis

(5)

.

The geometry models of the billet and die were generated in CATIA and then transferred in the igs file format to commercial software, Patran version 2007 (MSC. software, Santa Ana, CA., USA). And then the finite element models of the billet with a diameter of 3.0 mm and the die were generated in PATRAN. Finally the models were transferred to LSDYNA version R4.2 (LSTC, Livermore, CA.,USA).

A load is applied by displacement control, assuming that a force is added toward the z-direction from nodes on the top surface of the material by applying a load while a punch is being still attached to the material. When billet was compressed, die was fixed with full constraints.

In this study, in order to obtain good formability of the high-carbon steel wire rod, finite element analysis was carried out considering four factors, the forging direction, the forging velocity, the friction and the constraint location.

The friction between the billet and die is considered the constant friction and the friction coefficient was applied to model in the range of 0 ~ 0.1. The forging velocities were used in the range of 0.5 ~ 20 m/sec.

3. RESULTS AND DISCUSSION

3.1 ANALYSIS DEPENDING ON FORGING DIRECTIONS To form a local parabolic shape, the forging direction should first be determined. Finite element analysis was performed changing forging direction as to whether forming was properly done or not. Fig. 4 shows different forging directions. In Case 1, the workpiece was compressed at a location far away from the parabolic shape, and while in Case 2, the workpiece was compressed at a location close to the parabolic shape.

Fig. 5 exhibits plastic strain distribution depending on forging velocities against the a-a cross section in the figure after forging. (a), (b), (c) and (d) show the effective plastic strain distribution when the punch velocities are 0.5, 5, 10 and 20 m/s, respectively. Here, analysis was conducted with the coefficient of friction 0.0.

As shown in Fig. 5, Case 1 that puts a forging load from the bottom shows intensively low plastic strain distribution from the top of the parabolic shape, while Case 2 that puts a forging load from the top shows intensively low plastic

strain distribution from the lower parabolic shape. This is

located at the opposite side of the location where the forging

load is put. For Case 1, overall plastic strain distribution is

uniformly distributed in (a) and plastic strain distribution is

relatively low. This seems to be a phenomenon caused by

relatively low forging velocities. On the other hand, for (b),

(c), and (d), specific parts that showed intensively low plastic

strain distribution occurred and exhibited relatively high

(4)

(I) (II)

Fig. 6 Pressure distribution inside the section a-a during the forging operation : (I) Case 1, (II) Case 2 at 10 m/s

Fig. 7 Insufficient volume under different velocity : (I) Case 1, (II) Case 2

(I) (II)

Fig. 8 Simulation results of parabolic shape part : (I) Case 1, (II) Case 2 at (a) 0.5 m/s, (b) 5 m/s, (c) 10 m/s and (d)

20 m/s Fig. 9 Insufficient volume under different velocity in Case 2

plastic strain distribution compared to (a), in general.

For Case 2, (a) is showing a relatively high plastic strain distribution unlike (a) of Case 1. While the specific part showing intensive plastic strain distribution is a little far away from the parabolic shape for Case 1, it is close to the parabolic shape for Case 2. It is thought that this is due to

the fact that a range of plastic deformation occurrences is relatively wider for Case 1 than for Case 2.

Fig. 6 exhibits pressure distribution depending on forging directions against the a-a cross section in the figure after forging. The high pressure appears at the location which the low plastic strain is occurred as shown Fig. 6. It is thought that the low plastic strain distribution near the parabolic shape is caused by the high pressure at the bottleneck shape of the die.

Fig. 7 shows, by insufficient volumes, whether the parabolic shape was properly formed depending on forging velocity or not. The insufficient volume means not filling volume measured by the element volume in the parabolic shape part.

The insufficient volume tends to decrease as the forging velocity increases, and, for Case 2, the forging velocity reaches the expected volume. For Case 2, when forge is performed with a velocity of more than 10 m/s, it can be seen that the parabolic shape is properly formed.

Fig. 8 shows forging results at the location of the para- bolic shape depending on forging velocities. It can be seen that, in Case 1, buckling occurred at the middle of the parabolic shape as a result of a forge at 0.5 m/s, while, in Case 2, buckling occurred on the upper part of it.

As a result, it shows that, when a product with a local shape is formed by forge, selection of a forging direction is very important, and that the forging velocity also affects the formability of a local shape.

3.2 ANALYSIS DEPENDING ON FORGING VELOCITIES

Fig. 9 shows the insufficient volume that occurred when

a forging velocity was increased by an increment of 1

m/s, in order to identify formability depending on forging

(5)

Fig. 10 Insufficient volume under different frictional coefficient in Case 2

Fig. 11 Simulation results of parabolic shape part under di- fferent frictional coefficient of 0, 0.025, 0.5 and 0.1 in Case 2

Fig. 12 Constraint location

Fig. 13 Insufficient volume under different frictional coefficient and velocity

velocities from 5 m/s to 10 m/s in more details.

The insufficient volume shows a tendency to decrease as a forging velocity increases. It can be seen that the parabolic shape is well formed at the forging velocity of more than 10 m/s. There is almost no change in the insufficient volume for the forging velocity of less than 5 m/s and more than 10 m/s, and, from this result, it can be shown that there is a velocity range that affects net shaping ability related with expected volume.

3.3 ANALYSIS DEPENDING ON COEFFICIENTS OF FRICTION

Fig. 10 shows the insufficient volume depending on the variation of coefficient of friction at 10 m/s forging velocity.

Analysis was performed by applying coefficients of friction, 0, 0.025, 0.5, and 0.1. When the coefficient of friction is large, the insufficient volume increases.

Fig. 11 shows the analytical result on a part of the parabolic shape depending on friction coefficients. When

coefficients of friction were 0.0 and 0.025, all forms were properly made, and it can be shown that a proper value of a friction coefficient can be a good factor to form a para- bolic shape.

In the parabolic shape part observed at 0.5 and 0.1 coefficients of friction, the parabolic shape was not formed, and the coefficient of friction over a critical value restricts formation of the parabolic shape. As a result, it can be seen that the coefficient of friction has a big influence on the parabolic shape. But it’s not easy to control the coefficient of friction of 0.02, so it is needed to find another way for the formability to be used in the industry.

3.4 ANALYSIS DEPENDING ON CONSTRAINT LO- CATION

Analysis was carried out constraining the lower parabolic shape part to suppress plastic strain. Fig. 12 shows the constraint location on the billet.

Fig. 13 shows the insufficient volume that occurred when

(6)

a forging velocity under frictional coefficient of 0.1 was increased by an increment of 0.1 m/s, in order to investigate formability depending on forging velocities from 0.1 m/s to 5 m/s in more details and when a frictional coefficient at 0.5 m/s was 0, 0.025, 0.05 and 0.1.

Based on these computational results, it can be found that they are different with previous results. It can be shown that formability is almost unchanged depending on friction coe- fficients. A good parabolic shape is shown at a forging velo- city of more than 0.5 m/s under frictional coefficient of 0.1.

4. CONCLUSTIONS

Using the finite element analysis, the forging formability of the product with small diameter, long column, and parabolic shape has been investigated. Base on the com- putational results, the following results were obtained.

(1) The formability of a parabolic shape was occurred differently depending on forging directions, and the forging direction has a big influence when making a product with a local shape by forging.

(2) As the forging velocity increases, buckling tends to be limited and the formability of a parabolic shape im- proves, while good formability is achieved in forging velocities more than 10 m/s under frictional coefficient of 0.0. The larger the coefficient of friction is between a billet and a die, the worse the formability of a pa- rabolic shape gets. But it’s not easy to control the coefficient of friction lower than 0.02. Considering the real field, another way for the formability was found.

(3) When constraining the lower parabolic shape part to

suppress plastic strain, the effect depending on friction coefficient is not almost appeared and a good parabolic shape is obtained at a forging velocity of more than 0.5 m/s under frictional coefficient of 0.1.

(4) As a result, the formability of the product with a long column and a parabolic shape can be improved by controlling forging load directions, forging velocities and coefficients of friction, and constraint location.

References

(1) Jing, Y. A., Hu, L., Wang, L., and Han, J., 2007,

“Study on Rolling Process Optimization of High Carbon Steel Wire,” Journal of University of Science and Technology Beijing, Vol. 14, No. 5, pp. 431~436.

(2) Kazeminezhad, M., and Karimi Taheri, A., 2003, “The Effect of Controlled Cooling after Hot Rolling on the Mechanical Properties of a Commercial High Carbon Steel Wire Rod,” Materials & Design, Vol. 24, No. 6, pp. 415~421.

(3) Pilarczyk, J. W., Van Houtte, P., and Aernoudt, E., 1995, “Effect of Hydrodynamic and Roller Die Drawing on the Texture of High Carbon Steel Wires,”

Materials Science and Engineering A, Vol. 197, No.

1, pp. 97~101.

(4) Kim, Y. H., Ryou, T. K., Choi, H. J., and Hwang, B.

B., 2002, “An Analysis of the Forging Processes for 6061 Aluminum-alloy Wheels,” J. Mater. Process.

Technol. Vol 123, No. 2, pp. 270~276.

(5) LSTC, 1998. LS-DYNA Theoretical Manual, California.

(6) Williams, J. H., 1994, Fundamentals of Applied Dynamics,

Wiley, New York.

수치

Fig. 2 Study model shape of a high carbon steel wire rod
Fig. 5 Effective plastic strain distribution inside the section a-a  at the end of forging operation : (I) Case 1, (II) Case2 at (a) 0.5 m/s, (b) 5 m/s, (c) 10 m/s and (d) 20 m/snegligible compared to its overall motion
Fig. 6 Pressure distribution inside the section a-a during the  forging operation : (I) Case 1, (II) Case 2 at 10 m/s

참조

관련 문서

•  Each observed shape is now a point (vector) x in 2*K dimensional space. •  The “mean shape” is the center of mass of

Bactericidal effect of photocatalytic reactor depending on the UV-A illumination time and flow rate of V.. Bactericidal effect of photocatalytic reactor

Based on the above results, the 12-week complex type correction program had a positive effect on the shoulder angle, trunk rotation angle, and body shape

2. The finite element is calculating using tension test of uni-direction 0° and 90°, compression test of uni-direction 0° and 90° and shear test results and, the results

– Friction pile( 마찰말뚝 ): driven at a site where soil is not economical or rather possible to rest the bottom end of the pile on the hard stratum, Load is carried by

– Friction pile( 마찰말뚝 ): driven at a site where soil is not economical or rather possible to rest the bottom end of the pile on the hard stratum, Load is carried by

8.50… thin-walled, closed x-s of arbitrary shape subjected to an applied torque, assumed to be in a state of uniform torsion, axial strain and stress components vanish  n(s)

To create a smooth path with continuous position and velocity, we start with the linear function but add a parabolic blend region at each path point.. During the blend portion