https://doi.org/10.7236/JIIBC.2017.17.2.135
JIIBC 2017-2-20
머신러닝 기반의 최적 양식장 조건 검색에 관한 연구
A Study on the Search of Optimal Aquaculture farm condition based on Machine Learning
강민수
*, 정용규
**, 장두환
***Min-Soo Kang
*, Yong-Gyu Jung
**, Du-Hwan Jang
***요 약 세계 수산시장은 초과 수요적 현상으로 이러한 경향은 지속적으로 가속화 될 것으로 전망하고 있다. 수산물 수요가 증가되는 양식업은 어업과 비교해 볼 때 비교적 적은 자원의 투입으로도 생산량의 조절 및 표준화 등이 가능하 여 높은 성과를 얻을 수 있는 산업이다. 그러나 전통적인 양식은 자연재해, 생태계 오염 등 저생산성의 문제점을 안고 있어 최적의 양식장소로 이동할 수 있는 새로운 양식시스템의 개발이 필요하다. 최적의 장소를 찾기 위해서는 온도, 산 소 용존량 등 필요한 데이터를 실시간으로 수집하고 분석해야 한다. 데이터 분석은 머신러닝 기반의 K-means 클러스 터링 기법을 적용하여 반복된 자기학습으로 언제, 어디로 양식장을 이동할지 스스로 판단할 수 있도록 하였다. 제시한 연구결과가 어류 양식업 종사자에게 적용된다면 최적의 양식장소를 스스로 찾아감으로써 자연재해, 생태계 오염 등 저 생산성의 문제점을 해결 할 수 있을 것이다.
Abstract
The demand for aquatic products in the domestic and overseas is increased, so that the aquaculture industry can achieve high performance by controlling and standardizing the production even with a relatively small amount of resources compared with existing fisheries. However, traditional method has problems of low productivity such as natural disasters and ecosystem pollution, and it is necessary to develop a new culture system that can move to the optimal culture site. In order to find the optimal location, you need to collect and analyze the necessary data such as temperature and DO in real time. Data analysis was performed by using K-means clustering method based on machine learning, so that it was possible to decision when and where to move the farm by repeated unsupervised learning. The proposed research could solve the problems of low productivity such as natural disasters and ecosystem pollution if applied to regressive fish farmers.Key Words :
K-means clustering, Machine learning, Unsupervised learning, Aquaculture*
정회원, 을지대학교 의료IT마케팅학과 교수
**
종신회원, 을지대학교 의료IT마케팅학과 교수
***
정회원, 영진글로지텍(주), 과장
접수일자 2017년 2월 15일, 수정완료 2017년 3월 15일 게재확정일자 2017년 4월 7일
Received: 15 February, 2017 / Revised: 15 March, 2017 / Accepted: 7 April, 2017
**
Corresponding Author: [email protected]
Dept. of Medical IT Marketing, Eulji University, Korea
I. Introduction
Aquaculture industry is a very positive assessment of the future food industry. Future scientists view the aquaculture industry as a future prospective industry,
and countries are making intensive investments in
establishing national plans for the development of the
aquaculture industry. Growth rates in the last four
decades have grown only 1.2% and 2.8% in the fishery
and livestock production since 1970. On the other hand,
the aquaculture industry has grown very rapidly, reaching over 8.8%. Demand for aquatic products is continuously increasing worldwide. However, the increase in the production and supply of aquatic products has not been able to keep pace with demand.
Generally speaking, "food" means that grain is the most important position, but fisheries food is also a second food, and its role and functions are gradually expanding. However, the supply of natural fisheries through traditional fishery has already reached its limit, and there is no way to improve the supply power beyond the aquaculture. Aquaculture has developed into an important source of aquaculture around the world, but there are limits to the development of marine aquaculture due to the risks of natural disasters, marine pollution and competition for marine space use. The risks of natural disasters, marine pollution, and competition for marine space use reduce productivity, so if any one of them is resolved, the problem of increasing the supply of marine aquatic products will be solved. It is necessary to pursue economic efficiency and increase competitiveness of the aquaculture industry by making it possible to optimize the demand and supply of marine products by combining advanced technology. Therefore, in this study, we use the data obtained in real-time to analyze when and which point is the optimal condition, and use the artificial intelligence instead of human decision based on the analyzed data to determine the optimal position and point I have studied how to go.
II. A aquaculture industrial trends
The global fish market is a phenomenon in which supply to demand is shrinking, and this trend is expected to continue to accelerate in the future. Supply of wild fishery resources is declining due to environmental factors such as abnormal weather and natural disasters. Therefore, aquaculture is not only a source of aquaculture in the world, but also the most
promising industry in the age of life, and its importance is increasing. It is time to cultivate a high value-added aquaculture industry connected with future life industry and government industry. The world is already aware of this fact and thinks that the only alternative to the future supply of fisheries food is efficient aquaculture.
Therefore, research efforts are being made in the development of aquaculture not only in developed countries but also in developing countries. The farms within the UNESCO-designated area of Hallyesoodo are controlled by people for about 3 to 4 months a year.
During this period, the farm environment (collection of data, transmission of CCTV data) can not be managed.
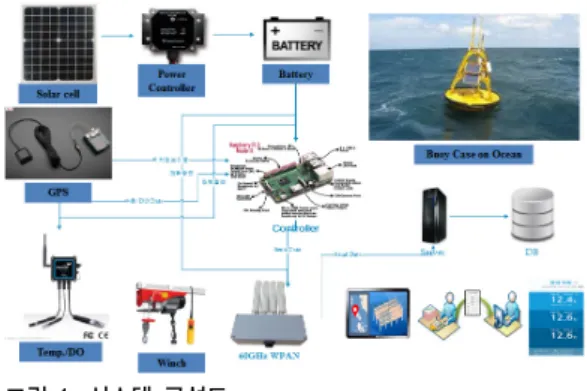
Figure 1 shown the system configuration transmitting data from ocean to land.
그림 1. 시스템 구성도 Fig. 1. System configuration
Real-time data collection and analysis of offshore
seawater can detect the possibility of massive death of
caged aquatic products due to lack of cold water and
dissolved oxygen. In order to prevent serious damage
to fishermen and national fishermen, it is necessary to
establish basic technology to prevent rapid disasters
and disasters. Therefore, information necessary for
domestic fisheries forms such as fishery environment,
ocean observation information, and aquaculture
information should be provided in real-time by
One-Stop. The information required for aquaculture is
basically temperature and DO. So, it is possible to
judge the optimum position by receiving the data of the
temperature and the DO amount in real time. The various information provided will identify the optimal conditions under which the fish can be nurtured.
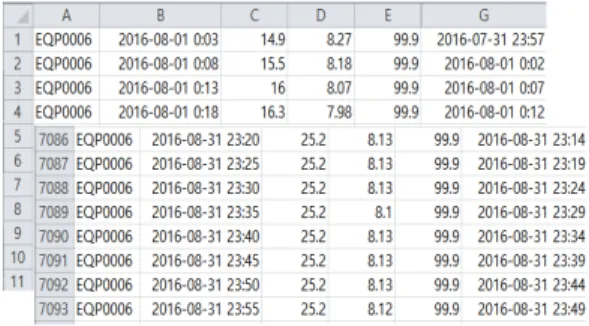
Optimal conditions and locations will be recorded so that you can know when and where to grow. Figure 2 shown a list of more than 7000 data provided.
그림 2. 7,093건 이상의 데이터 리스트 Fig. 2. More than 7,093 data lists
Therefore, if the fishery moves autonomously on the basis of the analyzed data, fish growth will become strong.
III. Data Analysis method
1. Unsupervised learning
Artificial intelligence imitates human brain and neuron neural network to make computers and robots think and act like humans. We can distinguish dogs and cats very easily from photographs, but computers do not distinguish between them. To that end, a method called Machine Learning was devised. There have already been many machine learning algorithms for how to classify data. Decision trees, Bayesian networks, support vector machines (SVMs), artificial neural networks (ANNs), and clustering are examples.
If there is an error in the representative method of machine learning, the error is corrected until it returns to stable operation. So we choose clustering method which is one of the methods of machine learning.
Clustering is the process of partitioning a group of data
points into a small number of clusters. This algorithm is a kind of self learning, and plays a role of labeling the input data which is not labeled.
2. Clustering implementation
The term "k-means" was first used by James
MacQueen in 1967,
[1]though the idea goes back to
Hugo Steinhaus in 1957.
[2]The standard algorithm was
first proposed by Stuart Lloyd in 1957 as a technique
for pulse-code modulation, though it wasn't published
outside of Bell Labs until 1982.
[3]In 1965, E. W. Forgy
published essentially the same method, which is why it
is sometimes referred to as Lloyd-Forgy.
[4]The
k-means clustering algorithm is part of the clustering
method.
[5][6]The partitioning method divides the given
data into several partitions (groups). For example,
assume that n data objects have been input. In this
case, the partitioning method divides the input data into
k groups smaller than or equal to n, where each cluster
forms a cluster. In other words, we divide the data into
k groups of one or more data objects. In principle,
optimal partition achieved via minimising the sum of
squared distance to its “representative object” in each
cluster.
[7]In clustering, the efficiency of clustering can
be increased by selecting initial seed points using
principal component analysis.
[9]There are K-Means
clustering methods that determine clusters through
distribution of data and DBSCAN(Density-based
spatial clustering of applications with noise) method
using density of other data. DBSCAN is a data
clustering algorithm proposed by Martin Ester,
Hans-Peter Kriegel, Jörg Sander and Xiaowei Xu in
1996. It is a density-based clustering algorithm: given
a set of points in some space, it groups together points
that are closely packed together (points with many
nearby neighbors), marking as outliers points that lie
alone in low-density regions (whose nearest neighbors
are too far away).
[10][11]DBSCAN is one of the most
common clustering algorithms and also most cited in
scientific literature[10][11]. DBSCAN is able to do
algorithm that classifies clusters and noise in a word.
A cluster is a set of all data vectors accessible from a core vector, and the cluster is created around the core vector. The advantage of the DBSCAN over the K-means algorithm is that it does not need to determine the number of clusters. In fact, DBSCAN is one of the density models and uses data location information like K-Means. Therefore, the problem of noise also has the advantage that the noise data does not affect the cluster because the DBSCAN separates the noise data separately.
IV. Experiments
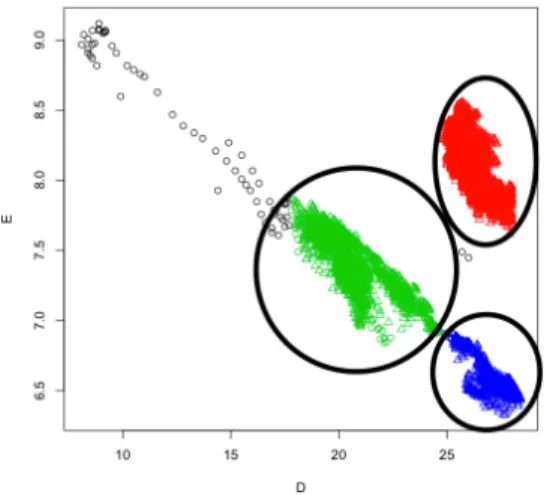
In this paper, R program is used to cluste more than 7,000 real-time temp and Do data collected over one month. R program is not only an open source language but also a statistical program that can be used freely by using libraries. we analyze the collected data in real time and make it possible to stabilize even if an error occurs in finding an optimal place. More than 7,000 data collected in real time are represented by K-means clustering graph. The collected data were clustered using K-means algorithm. Then, centroid and distance were calculated on the collected data. The data that were distant from the centroid were judged to be meaningless data. The centroid exists in the cluster given in figure 3 and the distant object is ignored.
그림 3. K-Means 클러스터 Fig. 3. K-means cluster
However, as a result of analyzing a large amount of data with the K-means algorithm, meaningless data was continuously clustered with meaningful data. In other words, noise is recognized as meaningful data. So we applied the DBSCAN algorithm. The DBSCAN algorithm takes two parameters. First, it defines the surrounding space. Second, it is necessary to define how many pieces of data exist in the surrounding space.(In the psudo code, eps defines the space, and MinPts defines the number of data in the surrounding space) If minpts is large, care should be taken as important values can be ignored, and caution should be taken when small, as meaningless values can be included in clusters. Also note that if you make a large eps, the number of clustering may be smaller than expected, and if you hold it small, the number of clustering can be quite different from what you expected. Therefore, the optimal values were clustered by eps = 0.41 and MinPts = 70. The results are shown in Figure 4.
그림 4. DBSCAN이 적용된 클러스터 Fig. 4. Cluster with DBSCAN applied
The result shows that three clusters have been
created. To derive the above result, the psudo code is
as follows.
>library(fpc)
>setwd("/Users/ChoiEunSoo/Desktop")
>de <- read.csv(“de.csv”)
> ds <- dbscan(de, eps=0.41, MinPts=70)
> plot(ds,de)
Data collected in real time from marine aquaculture will be repeatedly analyzed in a specific area, and the analyzed data will be linked with GPS to find an optimal marine aquaculture site.
V. Conclusion
Compared with fisheries, the aquaculture industry is capable of achieving high performance by controlling production and standardization with relatively little input of resources. However, traditional forms have problems of low productivity such as natural disasters, natural ecosystem pollution, and high mortality rate.
Among them, it is important to find an optimal farm because the fish farm location is directly related to productivity. In order to find the optimal place, you should find the optimum conditions for the culture place. In order to find the optimal condition, necessary data such as temperature and DO were collected and analyzed in real time. Data analysis was performed by using K-means clustering method based on machine learning, and repeated unsupervised learning was performed to exclude data not existing in the cluster.
As a result, we analyzed the useful data by filtering the error data so that we could decide the best place to do when and where to fish farm. The proposed study could solve the problems of low productivity such as natural disasters and ecosystem pollution if it is applied to fish farms.
References
[1] Steinhaus, H., “Sur la division des corps matériels en parties”. 《Bull. Acad. Polon. Sci.》 (French) 4 (12):
pp. 801–804. MR 0090073. Zbl 0079.16403.1957 [2] MacQueen, J. B. "Some Methods for classification
and Analysis of Multivariate Observations", Proceedings of 5th Berkeley Symposium on Mathematical Statistics and Probability.
University of California Press. pp. 281–297. 1967.
[3] Lloyd, S. P. “Least square quantization in PCM”, Bell Telephone Laboratories Pape, Published in journal 1957.
[4] Lloyd., S. P.. “Least squares quantization in PCM”."IEEE Transactions on Information Theory"
Vol.28 No.2, pp.129–137. 1982, doi:10.1109/
TIT.1982.1056489.
[5] E.W. Forgy., “Cluster analysis of multivariate data: efficiency versus interpretability of classifications”. Biometrics Vol.21, pp. 768–769.
1965.
[6] J.A. Hartigan "Clustering algorithms", John Wiley
& Sons, Inc., 1975.
[7] Hartigan, J. A.; Wong, M. A., “Algorithm AS 136:
A K-Means Clustering Algorithm", Journal of the Royal Statistical Society, Series C, Vol.28 No.1:
pp.100–108.1979
[8] https://en.wikipedia.org/wiki/K-means_clustering [9] Woosaeng Kim, Sooyoung Kim, "Document Clus-
tering Technique by K-means Algorithm and PCA", pp625-630, JKIICE, Vol.18, No.3, 2014.
[10] https://en.wikipedia.org/wiki/DBSCAN
[11] Gye Sung Lee, In Kook Kim, "A Study on Simplification of Machine Learning Model", The Journal of The Institute of Internet, Broadcasting and Communication (JIIBC), Vol.16, No.4, pp.147-152, 2016.
[12] Jae Young Chang, "Automatic Retrieval of SNS Opinion Document Using Machine Learning Technique", The Journal of The Institute of Internet, Broadcasting and Communication (JIIBC), Vol.13, No.5, pp.27-35, 2013.
[13] Seongrae Jo, Haengnam Sung, Byung-Hyuk Ahn
"A Comparative Study on the Performance of
SVM and an Artificial Neural Network in
※ This research was supported by the Small and Medium Business Administration (SMBA) grant funded R&D Program (C0442760)
Intrusion Detection", Journal of the Korea Academia-Industrial cooperation Society, Vol.17, No.2, pp703-711, 2016.
DOI : http://dx.doi.org/10.5762/KAIS.2016.17.2.703
저자 소개
강 민 수(정회원)
∙1993 : Kwangwoon Univ., Dept. of Control & Instrumentation Eng., B.S.
∙1995 : Kwangwoon Univ., Dept. of Control & Instrumentation Eng., M.S.
∙2003 : Kwangwoon Univ., Dept. of Control & Instrumentation Eng., Ph.D.
∙2013 ~ : Eulji Univ., Dept. of Medical IT Marketing
∙2009 ~ 2013 : RFID/USN PD, KEIT <Research area : AI, Medical IT>
정 용 규(종신회원)
∙1981 : Seoul National Univ. Dept. of Physics Education, B.S.
∙1994 : Yonsei Univ. Dept. of computer science, M.S
∙2003 : Kyonggi Univ., Dept. of computer science, Ph. D
∙2013 ~ : Eulji Univ., Dept. of Medical IT Marketing
<Research area : Data Mining, HIS>
장 두 환(정회원)
∙2009 : Kyungpook National Univ., Dept. Landscape Architecture B.S.
∙2014 : Youngjin Gloigtech co., Ltd Solution Team P.L.
<Research area : Advanced Aquaculture Technology>