Assessing Spatial Disparities and Spatial-Temporal Dynamic of Urban Green Spaces: a Case Study of City of Chicago
Yang, Byungyun1)
Abstract
This study introduces how GISs (Geographic Information Systems) are used to assess spatial disparities in urban green spaces in the Chicago. Green spaces provide us with a variety of benefits, namely environmental, economic, and physical benefits. This study seeks to explore socioeconomic relationships between green spaces and their surrounding communities and to evaluate spatial disparities from a variety of perspectives, such as health-related, socioeconomic, and physical environment factors. To achieve this goal, this study used spatial statistics, such as optimized hotspot analysis, network analysis, and space–time cluster analysis, which enable conclusions to be drawn from the geographic data. In particular, 12 variables within the three factors are used to assess spatial disparities in the benefits of the use of green spaces.
Finally, the variables are standardized to rank the community areas and identify where the most vulnerable community areas or parks are. To evaluate the benefits given to the community areas, this study used the z- and composite scores, which are compared in the three different combinations. After identifying the most vulnerable community area, crime data is used to spatially understand when and where crimes occur near the parks selected. This work contributes to the work of urban planners who need to spatially evaluate community areas in considering the benefits of the uses of green spaces.
Keywords : Spatial Disparities, Parks, Spatial Statistics, Sustainability
1. Introduction
Various benefits can be derived from green spaces. In particular, green spaces act environmentally in protecting water quality through the filtration of nutrients, reducing runoff from impervious surfaces, limiting soil erosion, and providing health and economic benefits (Lee and Maheswaran, 2011; Egorov et. al., 2016). Green spaces can also reduce heating and cooling costs in buildings, and a study of low-income neighborhoods in Philadelphia found
that newly planted trees boosted the sale prices of nearby homes by 2% (Watchter and Wong, 2008). In recent research, CPD (Chicago Park District) indicated that parks generate significant benefits for Chicago’s residents and economy (Kelly, 2014). In particular, they stated that mini-parks have the highest property value impact on the city, and the residents in the City of Chicago benefit primarily through access to green spaces in urban neighborhoods. In other words, it gives tangible value for residents, whose property value is increased by their proximity to parks. Moreover,
Received 2020. 09. 30, Revised 2020. 10. 16, Accepted 2020. 10. 21
1) Member, Dept. of Geography Education, Dongguk University (E-mail: [email protected])
https://doi.org/10.7848/ksgpc.2020.38.5.487 Original article
This is an Open Access article distributed under the terms of the Creative Commons Attribution Non-Commercial License (http://
the green spaces make people feel relaxed mentally, and physically able to lead more active lifestyles that can help lower rates of cardiovascular disease, diabetes, and obesity (Maroko et al., 2009).
Despite the various benefits of the green spaces, many challenges exist. Today, due to the COVID-19 (Coronavirus Disease-19) outbreak, parks are closed. In general, when a positive COVID-19 case is confirmed around or in the parks, the parks are shut down. It reduces the number of tourists and negatively affects recreational opportunities for the general public. The results will be directly associated with negative effects in terms of the benefits of the use of green spaces.
Second, green spaces are not available for everyone who want to have a reasonable walking distance or easy to access by the public transportation because of unequal spatial distribution of parks and green spaces (Solecki and Welch., 1995). Moreover, green spaces are needed to prevent the negative health conditions that are becoming more common in urban areas. There is a continual struggle to prove the importance of natural spaces in a world of development and economic gain. According to the Chicago Tribune, about 8.5% (about 580 parks) of the Chicago area is park space open to the public, so Chicago has the oldest and largest park district in America. While some neighborhoods in the Chicago area have an abundance of green space, relatively, other community areas do not. Furthermore, access to green space gives the public opportunities to do physical activities, participate in community engagement, and improve their health, yet there are ecological and socioeconomic disparities in green space access (Dai, 2011; Egorov et al., 2016). In particular, as we have recently experienced, a pandemic causes minority groups to lose more opportunities to use public parks or green spaces (Honey-Rosees et al., 2020).
In Hartig’s research, he found evidence for an association between green space and levels of physical activity (Hartig et al., 2014). Furthermore, several studies have demonstrated that recreational walking, increased physical activity, and reduced sedentary time were associated with access to, and use of, green spaces in working-age adults, children, and senior citizens (Bedimo¯Rung et al., 2005; Comber et al., 2008; Li et al., 2008; Maroko et al., 2009), who have demonstrated associations between visiting forests and
improved immune responses, including the expression of anti¯cancer proteins(Li et al., 2008). This research assumed that immune systems may benefit from relaxation provided by the natural environment or through contact with certain physical or chemical factors in the green space. Another researcher stated that providing attractive urban green space might encourage people to spend more time outdoors and facilitate physical activity (Bedimo¯Rung et al., 2005).
Regarding the benefits addressed here, this study is directed toward assessing spatial disparities in the availability of green spaces in the City of Chicago. In particular, this research used the 12 variables present in the three benefits of health-related, socioeconomic, and physical environment factors. Each of the factors has four variables.
For example, for the health-related factor, diabetes, lung cancer, childhood lead poisoning, and adult obesity datasets are used, provided by the CDPH (Chicago Department of Public Health). The datasets were calculated from geocoded annual birth and death certificates. Obesity affects one in five children aged 10 to 17 in Illinois. These data were also converted to geographic data. For socioeconomic data, four variables are used: unemployment, violent crime incidents, income inequality, and a hardship index score. The data was collected from the Chicago GIS data portal. For the physical environment factor, severe housing cost burden, vacant housing units, elevated blood lead levels, and physical inactivity are used to investigate spatial disparities of the study area. This research also developed a schematic with analytical steps that aid in assessing the benefits of the uses of green spaces. For analysis, this study used spatial statistics including optimized hotspot analysis and network analysis.
To finally rank and compare outputs of this study, z- and composite scores are used. As is commonly known, GISs (Geographic Information Systems) offer a powerful set of analytical tools for representing geographic data and have been used in several green space studies. Spatial analysis may help buttress arguments for new green spaces in community areas in the Chicago area, especially if they are underserved and ultimately help facilitate the identification of sites in need of a park.
2. Methodology
2.1 Study area and data collection
Chicago is the third-largest American city, occupying 234 square miles in the northeastern state of Illinois and bordered by Lake Michigan in the east. As of July 2019, the total population of Chicago was 2,693,976 (USCB, 2019).
Dividing the total number of people by the area shows that the population per square mile is around 11,842. Chicago is made up of 77 different community areas and has a large and diverse minority population with great spatial dispersion in socioeconomic circumstances. The poverty rate in Chicago is about 20.6% and minorities with lower incomes are mainly clustered in the less-developed southern and western areas of the city (Acosta-Córdova, 2017). Higher income levels can generally be found in the eastern and northern areas of the city.
Fig. 1. Study area: green spaces in Chicago
Fig. 1(a) shows all green spaces in the City of Chicago. Of the 77 community areas in the City of Chicago, there are 597 parks (as of 2017), 24 cemeteries, and 19 forest areas. Urban green spaces may include places with “natural surface”
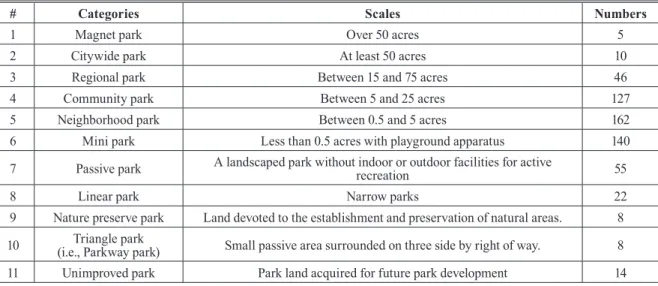
or “natural settings.” In this research, therefore, the author considered public parks to be typical green spaces. The CPD manages the public parks in the city and these are extremely diverse in size and characteristics. As shown in Fig. 1(b), there are 12 categories of parks in the City of Chicago as follows: magnet parks, citywide parks, regional parks, community parks, neighborhood parks, mini-parks, passive parks, parkway parks, linear parks, nature preserve parks, triangle parks, and unimproved parks. As shown in Table 1, there are 5 magnet parks, 10 citywide parks, 46 regional parks, 127 community parks, 162 neighborhood parks, 140 mini-parks, 55 passive parks, 22 linear parks, 8 nature preserve parks, 8 parkway parks, and 14 unimproved parks.
Each of the community areas has different types of parks.
When simply counting the number of parks, the Rogers Park community has the biggest number of parks with 23. West Town community has 20 parks. Community areas in the West and North Sides have a higher number of parks (Fig. 1d). The O’Hare community area has only one Neighborhood Park. Considering the size of the park, the community areas near Lake Michigan have bigger areas than those other community areas (Fig. 1(c)).
Table 1. Categories of the parks in Chicago
# Categories Scales Numbers
1 Magnet park Over 50 acres 5
2 Citywide park At least 50 acres 10
3 Regional park Between 15 and 75 acres 46
4 Community park Between 5 and 25 acres 127
5 Neighborhood park Between 0.5 and 5 acres 162
6 Mini park Less than 0.5 acres with playground apparatus 140
7 Passive park A landscaped park without indoor or outdoor facilities for active
recreation 55
8 Linear park Narrow parks 22
9 Nature preserve park Land devoted to the establishment and preservation of natural areas. 8
10 Triangle park
(i.e., Parkway park) Small passive area surrounded on three side by right of way. 8
11 Unimproved park Park land acquired for future park development 14
2.2 Variables selected
As stated in the introduction, various benefits result from green spaces. Therefore, this research considered multiple factors such as health-related, socioeconomic, and physical environment factors that are directly associated with the benefits of green spaces. The following Table 2 shows a list of factors selected in this study.
As for the health-related factor, four variables are used as follows. These datasets are drawn from the CDPH and the Centers of Disease Control and Prevention, namely, the Diabetes-related dataset, children’s lead poisoning, adult obesity, and lung cancer datasets. Regarding the socioeconomic factor, four variables are used as follows.
First is the violent crime incident rate per 100,000 people.
The data includes homicide, criminal sexual assault, robbery, aggravated assault, and aggravated battery. Next is income inequality, which is computed by the Gini–Simpson formula.
Next is the hardship index score which indicates worse economic conditions estimated from the six variables, and last is the unemployment rate which represents people over the age of 16 years. As for the physical environment factor, four variables are deployed as follows. First, the severe housing cost burden indicates the percentage of households that spend 35% or more of their income on housing costs.
Next, the vacant housing data represents vacant housing
units as a proportion of the total housing units. Next, the elevated blood lead levels is an estimated percentage of those tested and found to have an elevated blood lead level based on annual numbers. Last is physical inactivity, i.e., the percentage of adults aged 20 and over reporting no leisure- time physical activity. Examples of the physical activities provided include running, calisthenics, golf, gardening, or walking for exercise. Geographical units of the 12 variables are in a census tract, blocks, or community areas. Through the preprocessing process, all variables are combined into a polygon feature including the 77 community areas. The polygon feature is referenced to the North American Datum of1983 NAD 83 and projected to the Universal Transverse Mercator zone 16N.
2.3 Developing a schematic and analytical process
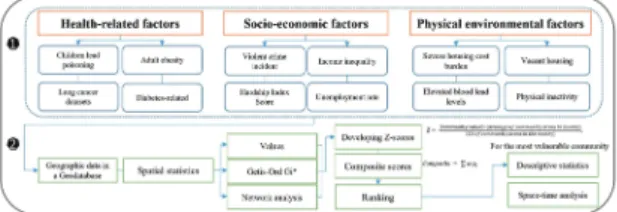
2.3.1 Developing a schematic diagram of this study
Fig. 2. Processing diagram of the research approach Table 2. Factors considered in this research
Factors Data
Health-related factor
Diabetes (%) Lung Cancer (%) Childhood Lead Poisoning (%)
Adult Obesity (%) Socio-economic factor
Unemployment (%) Violent Crime Incidents
Income Inequality (%) Hardship Index Score (%) Physical environment factor
Severe Housing Cost Burden (%) Vacant Housing Unit Elevated Blood Lead Levels (%)
Physical Inactivity (%)
Others Crime incidents from 2012 to 2019
In this study, the author developed a schematic to assess the spatial disparities of the urban green spaces in the city.
As introduced in the previous section, the three factors are represented in the GIS database (1 of Fig.2). Spatial statistics are utilized to assess the community areas in terms of the benefits of the green spaces. In addition to that, this study used a z-score and a composite score to rank and finally identify where the most vulnerable area is. The next section will introduce the specific analytical processes used to meet the objectives of this study.
2.3.2 Analytical processes
The selected spatial statistics are a hotspot analysis, space–
time analysis, and network analysis. First, this study uses the hotspot analysis to investigate the spatial distribution of the health, socioeconomic, and physical environmental factors.
The hotspot analysis can identify statistically significant hotspots and cold spots and reveal spatial trends in the clustering of polygon features that are determined by the field. It consequently assesses where high values of the 12 variables in the three factors are spatially clustered (Park et al., 2020; Hwang et al., 2020). Furthermore, the author also used the optimized hotspot analysis that determines an appropriate polygon cell size that is used to produce optimal hotspot analysis results. The analysis reveals a high or low percentage of given weighted indicators in relation to the percentage in the surrounding areas. Furthermore, spatial trends can determine an optimal scenario by monitoring an increase or decrease in relation to the benefits of using the green spaces. The following shows the Getis-Ord Gi*
equation (Getis and Ord 1992; Ord and Getis, 1995).
(1)
where, is the attribute value for feature j, is the spatial weight between features i and j, and n is equal to the total number of features.
As for the distance measure of the spatial relationship, this research used the inverse distance squared model. In terms of the weight values of the model, this study applied
the default weight in the GIS application. The model returns the z-scores and p-values that indicate where the features with either high or low values cluster spatially. In particular, for statistically significant positive z-scores, the larger the z-score is, the more intense the clustering of high values (hotspot). For statistically significant negative z-scores, the smaller the z-score is, the more intense the clustering of low values (Coldspot).
2.3.3 Ranking the community areas
To assess the spatial disparities of green spaces, this study used the z-scores of all values of the 12 variables. The Z -score is used to standardize the different measurement units.
The following shows an equation of the Z-score.
(2)
where, Z-score is a standardized variable, represents the data value in each community, m denotes the average of the community values, and denotes the standard deviation (SD).
In general, the Z-score measures how many standard deviations above or below the mean the data value is. It assumes that all variables are under the same condition. It may cause over-estimated and underestimated results. In addition to that, this way is not able to visually represent the distribution of the Z-scores on a map. Thus, we computed another Z-score from the results of hotspot analysis. The model produces three confidence levels at 90% (p < 0.1), 95% (p < 0.05), or 99% (p < 0.01). A confidence level of 99% means that it would be less than a 1% probability to be simply a random pattern. In other words, it will have a clustering on the selected value. Thus, this research assigned three points to the hotspot areas with 99%. The two points are given to the areas with 95% and one point is allocated to the areas with 90%. After assigning all values to the three intervals of hotspot areas respectively, this study calculated a z-score again to spatially assess where the most vulnerable community area is from the 12 variables.
In addition to that, this study uses a composite score that is the average of the Z-scores. This is to finally rank all community areas resulting from the 12 variables. This approach helps us
logically comprehend outputs of Z-score, rather than individual measure. Consequently, it increase the level of precision. Next illustrates the composite score of Z values.
C = ∑WiZi (3)
where, C is the composite score of Z values for all variables, Wi is the weight of the three factors.
In this study, equal weights are assigned into the three factors: health-related, socioeconomic, and physical environment factors. For these procedures, a Python script was used to integrate all research outputs.
2.3.4 Accessibility analysis and Space-time cluster analysis
Regarding the accessibility analysis, the effects of spatial disparity of parks in Chicago could be highlighted by relating it to accessibility and health effects. In this project, the distance between the green space and census tracts was measured using the network analysis technique. This technique calculates service areas based on each green space, encompassing all streets accessible within the different specified impedances (Zhang and Holt, 2011). A GIS-based network analysis has been used frequently to determine the accessibility of urban green space (Comber et al., 2008).
Network analysis is a type of spatial analysis and provides the optimal method for evaluation as it calculates the actual distance from the access point via the real roads. This study considered a 0.5-mile walking distance. It is equivalent to a 10-minute walk, which is considered a moderate walking distance to parks (Comber et al., 2008), with parks ideally being larger than 5 acres (Harnik et al., 2016). To use the geoprocessing tool, the green spaces were first subdivided into groups of below and over five acres to be able to calculate for the different criteria. Access points for the parks were created by making centroid points and adding access points for the larger parks. After that, service areas of 0.5 mile for the green space with an area less than 5 acres, and 0.5 mile for the green space over five acres were created with the centroid points to parks as the origin.
Even though this study used the variables that are directly associated with the benefits in terms of the uses of green
spaces, this analysis plays crucial roles in realistically representing physical accessibility to each of green spaces or from access points.
The next analysis is space–time cluster analysis. This analysis is used to spatially represent crime patterns in the community area that is selected as the most vulnerable area. It is important to determine what issues will have an impact on decreasing the quality of use of the green spaces, therefore, this research used all crime incidents that had occurred in the community areas over the last eight years. For the analysis, this study used the optimized hotspot analysis and emerging hotspot analysis tools to visualize the temporal and spatial distribution of the last eight years’ crime data. The optimized hotspot analysis also uses Getis-Ord Gi*
statistics that assess high and low values of the number of crimes that cluster spatially. Furthermore, it creates a map of statistically significant hot and cold spots to produce optimal results of clustering and automatically aggregates incident data. Once the optimized hotpots are determined in a fishnet polygon mesh with an appropriate cell size, a space-time cube is created by emerging hot spot analysis. This analysis uses the Mann-Kendall statistic and detects eight trends of hot or cold spots (Hamed, 2009). This approach not only considers this research a spatial context but also a temporal context (Yang, 2019).
3. Results and Analysis
3.1 Spatial trends of the health-related factors As introduced in the previous section, this study used rates of diabetes, lung cancer, childhood lead poisoning, and adult obesity to investigate spatial trends of the health-related variables.
Fig. 3. Spatial trends of the health-related factor:
(a) population density, (b) diabetes, (c) adult obesity, (d) child poisoning, and (e) lung cancer
As shown in Fig. 3(a), the city’s population is primarily clustered at the northern part of the city. The map shows the data in a range from −3 (Cold Spot: 99% Confidence) to 3 (Hotspot: 99% Confidence), with 0 being non-significant. In the case of diabetes (Fig. 3(b)), some of the neighborhoods in the southern area are statistically significant hotspots. Cold spots at the 90% confidence level exist in the northern part of the city. This means that the high adult obesity rates are spatially clustered at the southern part of the city. It means that the clustering pattern with the low rates is not spatially relevant to their neighborhoods. Surprisingly enough, most adult-obesity-related hotspots (Fig. 3(c)) are located in the southern part of the city. Regarding the child poisoning variable (Fig. 3(d)), the hotspot zones are clustered in the same areas as those with the diabetic variable. As for the lung cancer variable, no hotspots exist.
As addressed before, the hotspot analysis can identify the locations of statistically significant hotspots and cold spots in the data. The areas denoted in red mean that the variables are spatially clustered and the areas in blue mean that the areas are not spatially associated with the values of each of the variables. The areas in white indicate that the values have spatially random patterns.
3.2 Spatial trends of the Socio-economic factors
Fig. 4. Spatial trend of the socio-economic factors: (a) hardship Index, (b) violence crime, (c) income inequality
and (d) unemployment
Fig. 4 illustrates the spatial distribution of the socioeconomic factors. As for the hardship index variable, hotspot zones exist in the Southwest Side (Fig.4(a)). Regarding violent crime, hotspot zones are represented in the Southwest and South Sides. As for the income inequality variable, hotspot zones occurred around the Far North, Northwest, and North Sides. In particular, unemployment rates are highly clustered in the areas below the Near South Side, Lower West Side, and South Lawndale community areas.
3.3 Spatial trends of the physical environment factors
Fig. 5. Spatial trend of the physical environment factors:
(a) vacant housing (b) severe housing cost burden, (c) physical inactivity and (d) elevated blood lead levels Fig. 5 displays spatial trends of the physical environment factors. Hotspot zones exist around West, Southwest, Far Southwest, and the South Sides for the four variables. As for the cold spot, it rarely occurred in the Far North, North, and Far Southwest Sides. As stated before, the red zones indicate highly clustered areas from the attribute values in the features. The spatial pattern of the four variables is sporadically distributed out, and/or hotspot zones are markedly clustered in the West, Southwest, and South Sides.
In the following step, the three confidence levels at the hotspot zones are used to compute z-scores and finally calculate a composite score.
3.4 Ranking the community areas: Z- and composite scores
Fig. 6. Ranking the community areas: (a) sum of the hotspot zones, (b) Composite score for Z-scores of the values of the twelve variables. (c) Composite score for the
Z-scores of hotspot zones of the twelve variables Based on the z-score and the composite score, this study revealed the most vulnerable community areas from the benefits in terms of the uses of green spaces. As shown in Fig.
6(a), this study used three scales before computing Z-scores.
Fig. 6(a) shows the total of the hotspot zones resulting from the 12 variables. It was revealed that four community areas had the highest negative aspects in terms of the benefits of the green spaces: West Englewood, Englewood, Greater Grand Crossing, and Chatham. Fig. 6(b) indicates the composite score that is associated with the Z-score from the original values of the 12 variables. The third results from the composite score that is computed from the z-score of the total of the hotspot zones regarding the 12 variables. As a result, the community areas near Southwest, South, West, and Far Southwest Sides are selected as the most vulnerable areas, such as West Garfield Park, Austin, North Lawndale, Englewood, West Englewood, Greater Grand Crossing, Chatham, and Roseland community areas. When comparing the multiple community areas in the three outputs, Englewood is selected as the most vulnerable community area.
3.5 Accessibility
The next analysis centers on accessibility. Accessibility is related to the effects of spatial disparity of parks. It is
important to know how many parks in a community area are within a boundary of walkable distance.
Fig. 7. Accessibility analysis
Regarding the network analysis, this research identified a distance of 0.5 mile, which is equivalent to a 10-minute walk to a park. The 10-minute walking distance is a common national standard. For the accessibility analysis, centroids are extracted from the parks that are larger than neighborhoods parks. Neighborhood parks are generally larger than a half- acre and less than five acres with playground apparatus. The parks include indoor or outdoor recreational facilities such as baseball playgrounds or children’s playgrounds including a slide, swings, see-saw, or jungle gym. The resultant service areas help us identify vulnerable areas in terms of the public parks. As a result, all parks are mostly accessible from the public bus stops and within a10-minute walking distance (Fig. 7). Thus, even though accessibility is one of the most well-known factors used in research associated with green spaces or public parks, this study did not consider the results of network analysis as one of the factors measuring spatial disparities in the area of interest. Therefore, its output is not considered in the following analytical processes.
3.6 Scrutinizing the most vulnerable community areas
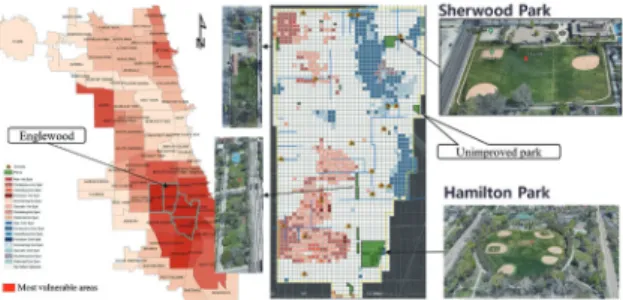
Fig. 8. Spatial analysis using crime data and Space-time cluster analysis
Through the analytical processes, this study could conclude where the most vulnerable community areas are from the benefits of the green spaces. In this section, this research selected Englewood for an additional in-depth understanding of the community area. Englewood is well-known as one of the most dangerous community areas and highly segregated with the highest rates of violence in the Chicago area (Yang, 2019). Homicide rates in West Englewood are three times higher than the Chicago average (SINAI, 2016). This study used space–time analysis using the crime data from 2012 to 2019 because crime is one of the major factors negatively affecting the quality of green space or public parks. This research collected crime data that reflects incidents of crime.
The data is acquired from the Chicago Police Department’s Citizen Law Enforcement Analysis and Reporting system.
For the privacy of crime victims, addresses are not identified, but the block-level locations are identified in this dataset. As shown in Fig. 8, the optimized hotspot analysis assessed high and low values of the number of crimes clustering spatially.
It created maps of statistically significant hot and cold spots to produce optimal results of clustering and automatically aggregated incident data. This research concluded that patterns with a high number of crimes primarily concentrated near Hamilton Park. The park is one of the regional parks in the city and the biggest one in the community area (Fig. 8).
Three types of emerging hotspot pattern exist near Hamilton Park. Consecutive, intensifying, sporadic hotspots appeared.
Another park that holds enough facilities or size for the public is Sherwood Park, but it manifested as a cold spot.
Fig. 9. Crime incidents by type occurred at the park properties in Englewood
Fig. 9 illustrates the crime incidents that occurred in the park properties over the last 8 years from 2012 to 2019.
There were 235 crime incidents in the park properties in Englewood. As shown in the above graph, narcotics have the highest number of crime incidents, next is battery, and theft is third. Such crime incidents are important factors that undermine the quality of the uses of green spaces.
4. Conclusion
There is growing interest in the importance of green space because it supports healthy living in urban areas.
Furthermore, recent research revealed evidence of multiple benefits from urban green spaces. Therefore, this research offers a review of the existing green spaces in Chicago alongside investigating the spatial distribution of benefits relevant to green spaces. This research proposed a GIS- based approach to identify spatially vulnerable community areas from the resources related to the public parks. More specifically, this study aimed at exploring socioeconomic relationships between green spaces and their surrounding communities and evaluating the spatial disparities from a variety of perspectives. Future studies will be associated with equitable distributions of green spaces for smart green cities with information and communication technologies.
References
Acosta-Córdova, J.M. (2017), The Latino Neighborhoods Report: Issues and Prospects for Chicago, Institute for Research on Race and Public Policy (IRRP) & Great Cities Institute (GCI), University of Illinois at Chicago, Chichgo, IL, USA.
Bedimo¯Rung, A.L., Mowen, A.J., and Cohen, D.A.
(2005), The significance of parks to physical activity and public health: A conceptual model, American Journal of Preventive Medicine, Vol. 28, No. 2, pp. 159¯168.
Comber, A., Brunsdon, C., and Green, E. (2008), Using a GIS-based network analysis to determine urban greenspace accessibility for different ethnic and religious groups, Landscape and Urban Planning, Vol. 86, No. 1, pp. 103-114.
Dai, D. (2011), Racial/ethnic and socioeconomic disparities in urban green space accessibility: Where to intervene, Landscape and Urban Planning, Vol. 102, No. 4, pp. 234- 244.
Egorov, A.I., Mudu, P., Braubach, M., and Martuzzi, M.
(2016), Urban Green Spaces and Health–A Review of Evidence, World Health Organization, Geneva, Switzerland.
Getis, A. and J.K. Ord. (1992). The Analysis of Spatial Association by Use of Distance Statistics, Geographical Analysis, Vol. 24, No. 3, pp. 189-206.
Hamed, K.H. (2009), Exact distribution of the Mann-Kendall trend test statistic for persistent data, Journal of Hydrology, Vol 365, No. 1-2, pp. 86-94.
Harnik, P., Martin, A., and Treat, M. (2016), 2016 City Park Facts, The Trust for Public Land, San Francisco, CA, USA.
Hartig, T., Mitchell, R., De Vries, S., and Frumkin, H. (2014) Nature and health, Annual Review of Public Health, Vol.
35, pp. 207-228.
Honey-Roses, J., Anguelovski, I., Bohigas, J., Chireh, V., Daher, C., Konijnendijk, C., Litt, J., Mawani, V., McCall, M., Orellana, A., Oscilowicz, E., Sánchez, U., Senbel, M., Tan, X., Villagomez, E., Zapata, O., and Nieuwenhuijsen, M. (2020), The impact of COVID-19 on public space: a review of the emerging questions, OSF pre-print.
Hwang, C.S., Hong, S.Y., Hwang, T., and Yang, B. (2020), Strengthening the statistical summaries of economic output areas for urban planning support systems, Sustainability, Vol. 12, No. 5640, pp. 1-21.
Kelly, M.P. (2014), The Power of Parks: An Assessment of Chicago Parks’ Economic Impact, Chicago Park District (CPD), Chicago, IL, USA.
Lee, A.C. and R. Maheswaran, R. (2011), The health benefits of urban green spaces: A review of the evidence, Journal of Public Health, Vol. 33, No. 2, pp. 212-222.
Li, Q., Morimoto, K., Kobayashi, M., Inagaki, H., Katsumata, M., Hirata, Y., Hirata, K., Suzuki, H., Li, Y. J., Wakayama, Y., Kawada, T., Park, B. J., Ohira, T., Matsui, N., Kagawa, T., Miyazaki, Y., and Krensky, A. M. (2008), Visiting a forest, but not a city, increases human natural killer activity and expression of anti¯cancer proteins, International Journal of Immunopathology and Pharmacology, Vol. 21,
No. 1, pp. 117¯127.
Maroko, A.R., Maantay, J.A., Sohler, N.L., Grady, K.L., and Arno, P.S. (2009), The complexities of measuring access to parks and physical activity sites in New York City: a quantitative and qualitative approach, International Journal of Health Geographics, Vol. 8, No. 1, 34, pp. 1-23.
Ord, J.K. and Getis, A. (1995), Local spatial autocorrelation statistics: distributional issues and an application, Geographical Analysis, Vol. 27, No. 4, pp. 286–306.
Park, J., Kim, J., Yang, B. (2020), Spatializing an Artist- Resident Community Area at a Building-Level: A Case Study of Garosu-Gil, South Korea. Sustainability Vol.12, No. 6116, pp. 1-21.
Sinai Health System (SINAI), (2016), Community Health Needs Assessment Schwab
Rehabilitation Hospital. 2016. Available online: https://
www.sinai.org/sites/default/files/HCH%20CHNA_final_
revised_%20(1).pdf
(last date accessed:11 Sep 2020).
Solecki, W.D. and Welch, J.M. (1995), Urban parks: green spaces or green walls?, Landscape and Urban Planning, Vol. 32, No. 2, pp. 93-106.
US Census Bureau (USCB), QuickFacts, Chicago city, Illinois, https://www.census.gov/quickfacts/
chicagocityillinois (last date accessed: 23 January 2019).
Wachter, S.M. and Wong, G. (2008), What is a tree worth?
Green-city strategies, signaling and housing prices, Real Estate Economics, Vol. 36, No. 2, pp. 213-239.
Yang, B. (2019), GIS crime mapping to support evidence- based solutions provided by community-based organizations, Sustainability, Vol. 11, No. 18, 4889, pp.
1-25.
Zhang X., Lu, H., and Holt, J.B. (2011), Modeling spatial accessibility to parks: a national study. International Journal of Health Geographics, Vol. 10, No. 1, 31, pp. 1-14.