Regime Shift of the Early 1980s in the Characteristics of the Tropical Cyclone Affecting Korea
Ki-Seon Choi* and Tae-Ryong Kim
National Typhoon Center/Korea Meteorological Administration, Jeju 699-942, Korea
Abstract: By performing a statistical change-point analysis of activities of the tropical cyclones (TCs) that have affected Korea (K-TCs), it was found that there was a significant change between 1983 and 1984. During the period of 1984-2004 (P2), more TCs migrated toward the west, recurved in the southwest, and affected Korea, compared to the period of 1965-1983 (P1). These changes for P2 were related to the southwestward expansion of the subtropical western North Pacific high (SWNPH) and simultaneously elongation of its elliptical shape toward Korea. Because of these changes, the central pressure and lifetime of K-TC during P2 were deeper and longer, respectively, than figures for P1. This stronger K-TC intensity for P2 was related to the more southwestward genesis due to the southwestward expansion of the SWNPH. The weaker vertical wind shear environment during P2 was more favorable for K-TC to maintain a strong intensity in the mid-latitudes of East Asia.
Keywords: Change-point analysis, tropical cyclone, subtropical western Pacific High, shift, vertical wind shear
Introduction
Many factors including SST, vertical wind shear, thermodynamic instability/stability, upper-tropospheric momentum flux convergence, mid-tropospheric moisture, and so on have an influence on tropical cyclone (TC) activity (Gray, 1968; Molinari and Vollaro, 1989;
Pfeffer and Challa, 1992; DeMaria et al., 2001;
Goldenberg et al., 2001; Baik and Paek, 2001). In particular, the movement and intensity of TC in the subtropics or mid-latitudes is greatly influenced by environmental circulation systems, such as the location and strength of the subtropical western North Pacific high (SWNPH).
Gong and Ho (2002) demonstrated that the SWNPH has enlarged, intensified, and shifted southwestward in recent years, which gives rise to an anticyclonic circulation anomaly over the region from the South China Sea to the western Pacific and thus causes wet anomalies over the Yangtze River valley. Ho et al.
(2004) also showed that this southwestward expansion of the SWNPH from the late 1970s led to a decrease in TC passage frequency in the East China Sea but to
an increase in the South China Sea. In addition, they suggested that this change in the SWNPH resulted in the westward shift of the recent major TC tracks and therefore contributed to a larger elliptic pathway of TC migration. On the contrary, Choi and Kim (2007) and Choi et al. (2009) demonstrated that both frequency and intensity of a TC at landfall in the Korean Peninsula have rapidly increased since the late 1980s. In particular, they showed that the frequency of TC with intensity greater than tropical storm (34 kts
≤ maximum sustained wind speed ≤47 kts) has increased remarkably and suggested that this result is because a SWNPH tend to retreat eastward in recent years.
On the other hand, in relation to the interdecadal variations in the climate of the late August, Inoue and Matsumoto (2007) showed that in the early 1980s, there were shifts not only in TC activity but also in the entire large-scale circulation pattern over East Asia and the western North Pacific (WNP). Therefore, it was known that except for variation of Korean Peninsula landfalling TC, most of the climate changes associated with the activity of the SWNPH in the aforementioned studies occurred between the late 1970s and early 1980s. In fact, climate regime shift in the later 1970s or the early 1980s occurred not only in
*Corresponding author: [email protected]
*Tel: +8264-801-0230
*Fax: +8264-805-0366
East Asia but also in the seas and air over the Pacific, and thus related various studies were accumulated (e.g., Nitta and Hu, 1996; Niebauer, 1998; Chang et al., 2000; Stephens et al., 2001; Bond et al., 2003; Wu et al., 2005; Ye and Hsieh, 2006;).
This study also found that a climate shift related to TC activity affecting Korea exists in the early 1980s.
Thus, we first analyzed the interdecadal changes on the activity of the TC affecting Korea and then their relation to atmospheric circulation patterns in East Asia and the WNP regions.
Data and Methods
The present study used the TC best track dataset archived by the Regional Specialized Meteorological Center (RSMC)-Tokyo. This dataset includes TC measurements at 6-hour intervals of latitude-longitude and intensity, including central pressure (hPa) and maximum sustained wind speed (MSWS; kt). A TC that affected Korea (hereafter, K-TC) was defined as one that passed through the area of 32o-40oN, 120o- 138oE (KMA, 1996; boxes in Fig. 2) for July- September. Based on this definition, 156 TCs were selected for the period of 1965-2004 (40 years). The TC intensity was divided into 5 stages on the basis an intensity of the MSWS; tropical depression (TD;
MSWS <34 kts), tropical storm (TS; 34 kts≤ MSWS
≤ 47 kts), severe tropical storm (STS; 48 kts ≤ MSWS
≤ 63 kts), typhoon (TY; MSWS ≥ 64 kts), and extratropical cyclone (EC). Storms at the TD and EC stages were included in the K-TC activity, because these storms cause tremendous damage in the mid- latitude countries of East Asia, such as China, Korea, and Japan (Kitabatake, 2002).
On the other hand, we defined a K-TC recurving location as the point where a TC’s direction of movement changes from a westward to an eastward movement. Also, to define the K-TC passage frequency, TC position was binned into the corresponding 5o×5o grid box and even if the same TC entered the same grid box multiple times, it was only counted once.
We also used the 6-hour measurements of geopotential height (gpm) and horizontal wind (m s−1) reanalyzed by the National Center for Environmental Prediction-the National Center for Atmospheric Research (NCEP-NCAR) to characterize the large- scale circulation patterns related to the decadal variation in the K-TC activity (Kalnay et al., 1996;
Kistler et al., 2001). These data are available on a 2.5o×2.5o grid at standard pressure levels.
In order to avoid any possible problems with data reliability in the present results, all of the calculations were confined to the period of 1965-2004 (40 years), during which weather satellites have operated. The interdecadal change in the K-TC activity was determined through a statistical change-point analysis (CPA). This type of statistical analysis can identify significant regime shifts in a time series in an objective manner. The details of this analysis method are well described in Elsner et al. (2000), Chu (2002), and Ho et al. (2004). The vertical wind shear (VWS) analyzed to diagnose the large-scale condition related to the K-TC activity is calculated as follows:
Here, u and v indicate the zonal and meridional flows, respectively. 200 and 850 represent 200-hPa and 850- hPa levels, respectively.
The composite analysis is an average for the months of the K-TC activity and an anomalous map was obtained by subtracting the climatological summer (July, August, and September; JAS) mean during the period of 1965-2004 from the average for the months of K-TC activity. Here, JAS is defined as the seasons that the K-TC activity is the most active Park et al.
(2006).
For the significance test in this study, the statistical method of Student’s t test is used (e.g., Wilks, 1995).
Regime Shift between 1983 and 1984
TC frequency and recurving location
As a result of applying the K-TC frequency to the VWS= (u200–u850)2+(v200–v850)2
statistical CPA, a significant change point was found between 1983 and 1984 (Fig. 1a). While there were 61 K-TCs for the period of 1965-1983 (hereafter, P1), there were 95 for the period of 1984-2004 (hereafter, P2). That is, there were only about two thirds as many K-TCs in P1 as in P2.
Ho et al. (2004) have already shown that the change in the TC passage frequency in the WNP is related to the southwestward shift of the SWNPH in the late 1970s. Also, in the present study, an investigation was made of the change in the SWNPH averaged for the months of the K-TC activity in each period, as shown in Fig. 2. As a result, the SWNPH (5860 gpm contour) for P2 is shifted more southwestward than that for P1. At the same time, the
shape of the SWNPH becomes more elliptical toward Korea for P2. In addition, 5880 gpm contours for P2 were also stretched more toward Korea than those of P1 (not shown). This means that during P2, the SWNPH provides a more favorable environment for TC to approach Korea. This feature can be seen in detail by examining the location of the SWNPH for each K-TC during the two periods (right panel of Fig.
2).
Due to this southwestward expansion of the SWNPH and its elliptical shape toward Korea, the K- TC track for P2 tends to migrate more westward than that for P1 (Fig. 3). That is, the higher K-TC passage frequency for P2 is distributed along the western periphery of the 5860 gpm contour (filled circle).
Thus, East Asian coastal regions, such as the Philippines, the east coast of China, Korea, and Japan show a higher TC passage frequency for P2. This is well consistent with the results of Inoue and Matsumoto (2007), who analyzed the difference in the TC track frequencies in the late August between 1984-2000 and 1961-1983. On the other hand, the middle of China has the highest frequency in mainland China for P2. This may play an important role in the strengthening of wet anomalies over the Yangtze River valley in recent years, as analyzed by Gong and Ho (2002).
Generally, TCs tend to migrate along the western periphery of the SWNPH. The recurving location of K-TCs may also change because of this recent shift in the SWNPH. In relation to the change in the latitude of the recurving location, 34 of the 52 TCs (65.4%) that recurved in P1 recurved to the north of 30oN, while just 26 of the 77 TCs (33.7%) that recurved in P2 did so. In other words, about 70% of all the K- TCs that recurved during P2 recurved to the south of 30°N. Therefore, it can be concluded that K-TCs tended to recurve to the north of 30oN during P1 and to the south of 30oN during P2. On the other hand, in relation to the change in longitude, while only 7 of the 52 TCs for P1 recurved to the west of 120oE, 28 of the 77 TCs for P2 did so. Although the number of TCs that recurved to the west of 120oE is not very Fig. 1. Decadal variations in (a) frequency, (b) longitude,
and (c) latitude for the recurving location of TCs affecting Korea (hereafter, K-TC). The thick and thin dotted lines denote t-values of change-point analysis and average values for three variables for the periods 1965-1983 (P1) and 1984- 2004 (P2), respectively.
high for either period, the number of TCs that recurved to the west of 120oE for P2 is about four
times that of P1. Also, in order to examine whether there was a significant change in the recurving location of K-TCs, we applied the time series of the latitude and longitude portions of the recurving locations to the CPA, respectively (Figs. 1b and 1c).
Dramatically, this shows that there is clear change point between 1983 and 1984 for the two variables, just as with the TC frequency. The average recurving location for P1 is 31.2oN, 124.6oE and it is 27.6oN, 121.8oE for P2. The differences in average latitude and longitude recurving locations between the two periods are significant at the 90% confidence level.
Therefore, we can objectively confirm through the CPA that the recurving location of K-TCs has been shifted more southwestward since 1984.
TC intensity
The shifts in the track and recurving location of K- TCs, along with the recent southwestward expansion Fig. 2. 500-hPa geopotential height composite averaged for the months of K-TC activity (left) and 5860 gpm contours in each of the months with K-TC activity (right) for (a) P1 and (b) P2. The dots on the left denote the recurving locations of the K- TCs. The solid line box represents the K-TC area (32o-40oN, 120o-138oE).
Fig. 3. Differences in mean K-TC passage frequencies (TPF) between P2 and P1 within each 5o×5o latitude-longi- tude grid box. The solid and dashed lines denote 5860 gpm contours for P2 and P1, respectively.
of the SWNPH, may have had an effect on TC intensity. Thus, the statistical CPA was also applied to the interannual variation in the average central pressure in the maximal approach to the boundary line of the K-TC area using the 6-hour TC best track dataset (Fig. 4). As a result, a significant shift was also shows between 1983 and 1984, like the frequency and recurving location shifts. That is, this indicates that all the activities related to a K-TC experienced a significant change between 1983 and 1984. The average central pressure (975.9 hPa) for P2 is about 10 hPa deeper than the average (985.5 hPa) for P1 and its difference between the two periods is significant at the 95% confidence level.
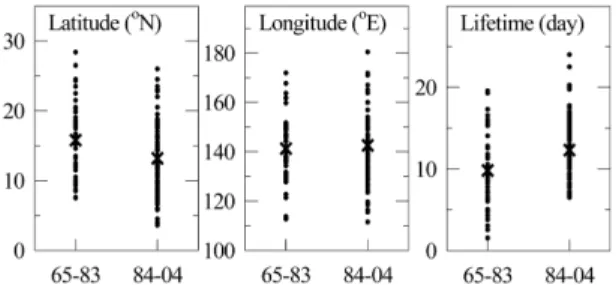
Wang and Chan (2002), Han and Baik (2006), and Jang and Ha (2008) pointed out that the further southeastward in the western Pacific a TC is when it is formed, the stronger its intensity becomes and, therefore, the longer its lifetime becomes. Accordingly, the latitudes and longitudes of K-TC genesis locations and the K-TC lifetimes for the two periods were analyzed, as shown in Fig. 5. In relation to the longitude, the TCs during P2 occur further to the east (P1: 141.2oE, P2: 142.5oE), even though the difference between the two periods is not significant statistically.
On the other hand, there is a difference of about 3oN for the latitude (P1: 15.8oN, P2: 13.1oN), which is significant at the 90% confidence level. This more southeastward TC genesis for P2 may be related, not only to the monsoon trough, but also to the southwestward expansion of the SWNPH, as analyzed
in Chen et al. (1998). In addition, the closer to the equator a TC is during its formation, the longer its lifetime tends to become (P2:12.3 days, P1: 9.8 days), as indicated by Wang and Chan (2002). The difference in the TC lifetime between the two periods is significant at the 95% confidence level.
Vertical Wind Shear difference between P1 and P2
In order to investigate the effect of large-scale conditions on the difference in the TC intensity between the two periods, we analyzed the vertical wind shear (VWS) anomalies for P1 (Fig. 6a) and P2 (Fig. 6b) and its difference between P2 and P1 (Fig.
6c). Associated with the VWS, Gray (1968, 1975) and McBride and Zehr (1981) have already emphasized that the patterns of the VWS have a critical role in an intensification of the TC. While the center of the positive anomalies for P1 is located around Korea and Japan and the region of negative anomalies is located to the south of 30oN (Fig. 6a), the negative anomalies for P2 is located not only to the south of 30oN, but also in Korea (Fig. 6b). In addition, the negative anomalies in the region south of 30oN for P1 are generally stronger for P2 (Fig. 6c). This indicates that during P2, K-TCs have a more favorable environment and thus could maintain stronger intensities than during P1, as analyzed in section 3.2. In addition, in relation to the VWS difference between P2 and P1, the center of the negative anomalies is located in the mid-latitudes of East Asia, such as Korea, Japan, and Fig. 4. Same as Fig. 1, but for the annual variation in the
central pressure averaged for the maximal approach to the boundary line of the K-TC area using the 6-hour TC best track dataset.
Fig. 5. Latitude (left) and longitude (middle) locations of K- TC genesis and TC lifetime (right) for P1 and P2. Multipli- cation marks indicate the mean value for each period.
some parts of northern China, and Japan. Also, most regions of the analysis area predominantly show negative anomalies. Consequently, this environment for P2 can also provide favorable conditions for maintaining a strong intensity in a K-TC, until it moves north into the mid-latitudes.
Eventually, it can be concluded that the VWS in most regions of East Asia and the WNP is generally
weaker for P2 than for P1. Thus, we can confirm that the period of P2 shows the potential for a TC to maintain a strong intensity in the mid-latitudes of East Asia.
Summary and Conclusions
The statistical change-point analysis (CPA) was performed for tropical cyclone (TC) activities that affected Korea (K-TC) during the period of 1965- 2004. As a result, we suggest that there is a clear shift in K-TC activities between 1983 and 1984 as follows:
There were 95 TCs for the period of 1984-2004 (P2) and only 61 for the period of 1965-1983 (P1). The tracks and recurving locations of these TCs shifted more westward and southwestward in P2, respectively.
This recent shift in K-TC activities was related to the southwestward expansion of the subtropical western Pacific high (SWNPH) and, simultaneously, its elliptic shape toward Korea.
Associated with the K-TC intensity, the central pressure of the TCs near Korea also showed a difference between the two years. That is, the average central pressure for P2 was about 10 hPa deeper than that for P1. This was because the TCs during P2 occurred further to the southeast because of the recent southwestward expansion of the SWNPH and, therefore, had a longer lifetime than those for P1. The cause of this difference in the TC intensity between the two periods was well confirmed through a vertical wind shear (VWS) analysis. The VWS for P2 was weaker over most regions of East Asia and the western North Pacific (WNP) than that for P1.
Eventually, it could be determined that the period of P2 had a greater potential for a K-TC to maintain a strong intensity in the mid-latitudes of East Asia.
Acknowledgments
This research was supported by the National Typhoon Center of Korea Meteorological Administration as a part of major project named ‘Operation of the National Typhoon Center (1131-301-210-13). We Fig. 6. Vertical wind shear (VWS) anomalies for (a) 1965-
1983 (P1) and (b) 1984-2004 (P2) and (c) the VWS differ- ence between P2 and P1. The areas exceeding the 95% con- fidence level are shaded. The contour interval is 3 ms−1.
thank Dr. Joo-Hong Kim of Seoul National University for providing the program of statistical change-point analysis.
References
Baik, J.J. and Paek. J.S., 2001, Relationship between verti- cal wind shear and typhoon intensity change, and devel- opment of three predictor intensity prediction model.
Journal of the Meteorological Society of Japan, 79, 695-700.
Bond, N.A., Overland, J.E., Spillane, M., and Stabeno, P., 2003, Recent shifts in the state of the North Pacific.
Geophysical Research Letters, 30, doi:10.1029/
2003GL018597.
Chang, C.P., Zhang, Y., and Li, T., 2000, Interannual and interdecadal variations of the East Asian summer mon- soon and tropical Pacific SSTs. Part II: The meridional structure of the monsoon. Journal of Climate, 13, 4326- 4340.
Chen, T.C., Weng, S.P., Yamazaki, N., and Kiehne, S., 1998, Interannual variation in the tropical cyclone for- mation over the western North Pacific. Monthly Weather Review, 126, 1080-1090.
Choi, K.S. and Kim, B.J., 2007, Climatological characteris- tics of tropical cyclones making landfall over the Korean Peninsula. Asia-Pacific Journal of Atmospheric Sciences, 43, 97-109.
Choi, K.S., Kim, B.J., and Byun, H.R., 2009, Relationship between Korean Peninsula landfalling tropical cyclones and interannual climate variabilities. Journal of Korean Earth Science Society, 29, 375-389.
Chu, P.S., 2002, Large-scale circulation features associated with decadal variations of tropical cyclone activity over the central North Pacific. Journal of Climate, 15, 2678- 2689.
DeMaria, M., Knaff, J.A., and Connell, B.H., 2001, A tropical cyclone genesis parameter for the tropical Atlantic. Weather and Forecasting, 16, 219-233.
Elsner, J.B., Jagger, T., and Niu, X.F., 2000, Changes in the rates of North Atlantic major hurricane activity dur- ing the 20th century. Geophysical Research Letters, 27, 1743-1746.
Goldenberg, S.B., Landsea, C.W., Mestas-Nunez, A.M., and Gray, W.M., 2001, The recent increase in Atlantic hurri- cane activity: Causes and implications. Science, 293, 474-479.
Gong, D.Y. and Ho, C.H., 2002, Shift in the summer rain- fall over the Yangtze River valley in the late 1970s.
Geophysical Research Letters, 2001GL014523.
Gray, W.M., 1968, Global view of the origin of tropical disturbances and storms. Monthly Weather Review, 96,
669-700.
Gray, W.M., 1975, Tropical cyclone genesis. Atmospheric Sciences, Paper No. 234, Colorado State University, 121 p.
Han, J.Y. and Baik, J.J., 2006, Seasonal predictability of typhoon activity using an atmospheric general circula- tion model and observed sea surface temperature data.
Journal of Korean Earth Science Society, 27, 653-658.
Ho, C.H., Baik, J.J., Kim, J.H., and Gong, D.Y., 2004, Interdecdal changes in summertime typhoon tracks.
Journal of Climate, 17, 1767-1776.
Inoue, T. and Matsumoto, J., 2007, Abrupt climate changes observed in late August over central Japan between 1983 and 1984. Journal of Climate, 20, 4957-4967.
Jang, S.R. and Ha, K.J., 2008, On the relationship between typhoon intensity and formation region: Effect of devel- oping and decaying ENSO. Journal of Korean Earth Science Society, 29, 29-44.
Kalnay, E., Kanamitsu, M., Kistler, R., Collins, W., Deaven, D., Gandin, L., Iredell, M., Saha, S., White, G., Woollen, J., Zhu, Y., Leetmaa, A., Reynolds, R., Chelliah, M., Ebisuzaki, W., Higgins, W., Janowiak, J., Mo, K.C., Ropelewski, C., Wang, J., Jenne, R., and Joseph, D., 1996, The NCEP-NCAR 40-year reanalysis project. Bulletin of American Meteorological Society, 77, 437-471.
Kistler, R., Kalnay, E., Collins, W., Saha, S., White, G., Woollen, J., Chelliah, M., Ebisuzaki, W., Kanamitsu, M., Kousky, V., van den Dool, H., Jenne, R., and Fiorino, M., 2001, The NCEP-NCAR 50-year reanaly- sis: Monthly means CD-ROM and documentation. Bul- letin of American Meteorological Society, 82, 247-267.
Kitabatake, N., 2002, Extratropical transformation of typhoon Vicki (9807): Structure change and the role of upper-tropospheric disturbances. Journal of Meteorologi- cal Society of Japan, 80, 229-247.
Korea Meteorological Administration, 1996, Typhoon White Book, Korea Meteorological Administration, Seoul, 22 p.
McBride, J.L. and Zehr, R., 1981, Observational analysis of tropical cyclone formation, Part II: Comparison of non-developing versus developing systems. Journal of Atmospheric Sciences, 38, 1132-1151.
Molinari, J. and Vollaro, D., 1989, External influences on hurricane intensity, Part I: Outflow layer eddy angular momentum fluxes. Journal of Atmospheric Sciences, 46, 1093-1105.
Niebauer, H.J., 1998, Variability in Bering Sea ice cover as affected by a regime shift in the North Pacific in the period 1947-1996. Journal of Geophysical Research, 103, 27717-27737.
Nitta, T. and Hu, Z.Z., 1996, Summer climate variability in China and its association with 500 hPa height and trop-
ical convection. Journal of Meteorological Society of Japan, 74, 425-445.
Park, J.K., Kim, B.S., Jung, W.S., Kim, E.B., and Lee, D.G., 2006, Change in statistical characteristics of typhoon affecting the Korean peninsula. Atmosphere, 16, 1-17. (In Korean with English abstract).
Pfeffer, R.L. and Challa, M., 1992, The role of environ- mental asymmetries in Atlantic hurricane formation.
Journal of Atmospheric Sciences, 49, 1051-1059.
Stephens, C.S., Levitus, S., Antonov, J., and Boyer, T.P., 2001, On the Pacific Ocean regime shift. Geophysical Research Letters, 28, 3721-3724.
Wang, B. and Chan, J.C.L., 2002, How strong ENSO events affect tropical storm activity over the western North Pacific. Journal of Climate, 15, 1643-1658.
Wilks, D.S., 1995, Statistical Methods in the Atmospheric Sciences. Academic Press, CA, USA, 467 p.
Wu, L., Lee, D.E., and Liu, Z., 2005, The 1976/1977 North Pacific climate regime shift: The role of subtropi- cal ocean adjustment and coupled ocean-atmosphere feedback. Journal of Climate, 18, 5125-5140.
Ye, Z. and Hsieh, W.W., 2006, The influence of climate regime shift on ENSO. Climate Dynamics, 26, 823-833.
Manuscript received: July 21, 2011 Revised manuscript received: September 16, 2011 Manuscript accepted: September 18, 2011