<연구논문(Original Article)>
Pd 2+ 검출용 고감도 형광화학센서
왕 정
1,2†⋅하창식
2†1
Guangxi University 화학 및 화학공학과,
2부산대학교 고분자공학과
(2013년 1월 22일 접수, 2013년 3월 4일 수정, 2013년 3월 11일 채택)
Highly Sensitive and Selective Fluorescent Chemosensors Specific for Pd 2+ Detection
Jing Wang
1,2†and Chang-Sik Ha
2†1
School of Chemistry and Chemical Engineering, Guangxi University, Nanning, Guangxi 530004, People’s Republic of China
2
Department of Polymer Science and Engineering, Pusan National University, Busan 609-735, Korea (Received January 22, 2013; Revised March 4, 2013; Accepted March 11, 2013)
요 약 : 팔라듐은 치과 및 의료용 기구, 의료용 재료, 보석 및 자동차, 고기능성 점⋅접착제 등을 생
산하는데 중요한 역할을 한다. 팔라듐을 이용하는 반응에서의 중요성에도 불구하고 팔라듐은 최종생
성물에 잔존할 경우 인체에 해로운 독성을 가지고 있다. 그 중에서도 특히 PdCl
2는 독성이 가장 크
다. 따라서 Pd
2+이온 검출은 매우 중요한 연구과제인데 그 중에서도 특히 형광분석법은 가장 손쉽
고 경제적이면서 감도가 높고 선택성이 높은 방법으로 알려져 있다. 본 연구에서는 알파-카보닐로 치 환된 파이렌 유도체인 감마-옥소-1-파이렌부틸산(OPBA)이 수용액에 금속이온으로 감도가 크고 선택 성이 우수한 것으로 밝혀졌다.
Abstract: Palladium plays a pivotal role in the production of dental and medicinal devices, medicinal substances, jewellery, automobile and high-performance adhesives. Despite the frequent and fruitful use of such reactions, one major setback is the high level of palladium in the resultant compounds which can harm the human body. Among the palladium species, PdCl
2is the most toxic. As a consequence it is desirable to detect the Pd
2+cations by fluorescence spectra because it can provide an operationally simple and cost-effective detection method together with high sensitivity and selectivity. Herein, an α-carbonyl substituted pyrene derivative, γ-oxo-1-pyrenebutyric acid (OPBA), was demonstrated to be a highly sensitive and selective fluorescent probe for Pd
2+among the metal cations examined in aqueous solutions.
Keywords: Pd
2+cations, γ-oxo-1-pyrenebutyric acid (OPBA), chemosensor
1. Introduction
1)
The development of arti ficial receptors for the sensing and recognition of environmentally and biologically important species has been actively investigated in recent years[1,2].
Palladium is a rare transition metal that plays a pivotal role in the production of dental and medicinal devices, jewellery, automobile, and high-performance adhesives[3-5].
Moreover, organic synthesis that uses palladium as the
†Corresponding author: Jing Wang ([email protected]), Chang-Sik Ha ([email protected])
catalyst is widely applied in the production of medicinal substances. Despite the frequent and fruitful use of such reactions, one major setback is the high level of palla- dium in the resultant compounds which can harm the hu- man body[6,7]. Among the palladium species, PdCl
2is the most toxic[8]. As a consequence it is desirable to de- velop efficient methods for detecting the presence of Pd
2+cations. Fluorescence spectra stands out because it can provide an operationally simple and cost-effective detection method together with high sensitivity and selectivity[9,10]
compared to the other typical analytical methods used for
quanti fication of Pd
2+cations.
nition systems were successfully devised[14-19]. However, less attention was paid to the applications of α-carbonyl substituted pyrene chromophores, a special class of pyr- ene derivatives. To date, only a few studies have reported that employed α-carbonyl substituted pyrene derivatives in sensing systems[20]. Especially, the metal chemo- sensors constructed by α-carbonyl substituted pyrene de- rivatives is rare[21]. Based on these above information, we explored the application of γ-oxo-1-pyrenebutyric acid (OPBA), with a carbonyl group substituted on the α-position of the pyrene chromophore, as a selective and sensitive fluorescent chemosensor specific for Pd
2+detection. We hope that the efforts made in this work will contribute to the development of metal chemosensors based on α-car- bonyl substituted pyrene derivatives.
2. Experimental
2.1. Materials and Instrumentations
All solvents used were of analytical grade. γ-Oxo-1-pyr- enebutyric acid (OPBA), 1-pyrenebutyric acid (PBA) and 1-pyrene-carboxaldehyde (PyCHO) were all purchased from Sigma-Aldrich. The Fourier-Transform Infrared (FTIR) spectra were recorded at room temperature on a JASCO FTIR 460 Plus operated at a resolution 4 cm
-1.
1H-NMR spec- tra were recorded on a Varian Gemimi-2000 (300 MHz) spectrometer. The UV-Vis spectra were measured using a Hitachi U-2010 spectrometer. The fluorescence spectra were measured using a Hitachi F-4500 spectrometer. A pH 64 Radiometer (Copenhagen, Denmark) combined with a GK 2401 B electrode was used for the pH measurements.
2.2. Preparation of OPBA Solutions for the Concentration Effect
2.2.1. Studies on the Fluorescence Spectra
12.0 mM solutions of OPBA (0.1825 g, 0.6 mmol) were prepared in dimethylsulfoxide (DMSO) (5 mL), then diluted 2 times with H
2O to get the 6.0 mM stock solutions.
The stock solutions of OPBA (6.0 mM) were diluted by using DMSO/H
2O (1/1, v/v) to get the solutions of OPBA ranging from 3.0 mM to 0.5 µM. The fluorescence spectra
times by using H
2O to get the 1.0 µM solutions of OPBA in DMSO/H
2O (2/98, v/v). 3.0 mL of OPBA solution at 1.0 µM in DMSO/H
2O (2/98, v/v) was placed in quartz cell (10.0 mm width) and the absorption spectra were recorded.
2.3. Preparation of Solutions for the Fluorescent Detection of Metal Ions by OPBA
0.48 mM solutions of OPBA (0.0073 g, 0.024 mmol), pyrene (0.0049 g, 0.024 mmol), PBA (0.007 g, 0.024 mmol), and PyCHO (0.0055 g, 0.024 mmol) were prepared in DMSO (50 mL), then diluted 240 times with H
2O to get the 2 µM stock solutions. The total volume of DMSO contained in the 2 mM stock solutions was below 0.5%.
All of the metal ion stock solutions were prepared at 0.4 mM in H
2O. 1.5 mL of OPBA stock solution was placed in quartz cell (10.0 mm width) and the fluorescence spectra were recorded before and after the addition of 1.5 mL stock solutions of metal ions (200.0 equiv.) to the solution of 1.5 mL OPBA. The metal recognition behavior of OPBA was evaluated from the changes in fluorescence spectra at the emission wavelength of 455 nm upon addi- tion of that sodium salt. The fluorescence spectra of each solution were recorded with excitation at 480 nm.
2.4. Preparation of Solutions for the Sensing of Pd
2+by OPBA
A stock solution of OPBA (2.0 µM) was prepared as illustrated in section 2.3. The solution of PdCl
2was in- troduced in portions and the fluorescence intensity changes were recorded at room temperature each time.
2.5. Preparation of Solutions for the
1H NMR and IR Studies
20 µM stock solution of OPBA was prepared similar
to the procedures shown in section 2.3. 0.12 mM stock
solution of PdCl
2was prepared. The stock solution of
OPBA was diluted 2 times by using water and by using
the PdCl
2stock solution, respectively. After several minutes,
the
1H NMR and IR spectra of samples OPBA (1.0 µM)
and OPBA-Pd
2+(1.0 µM / 6.0 µM) were recorded.
(a) (b)
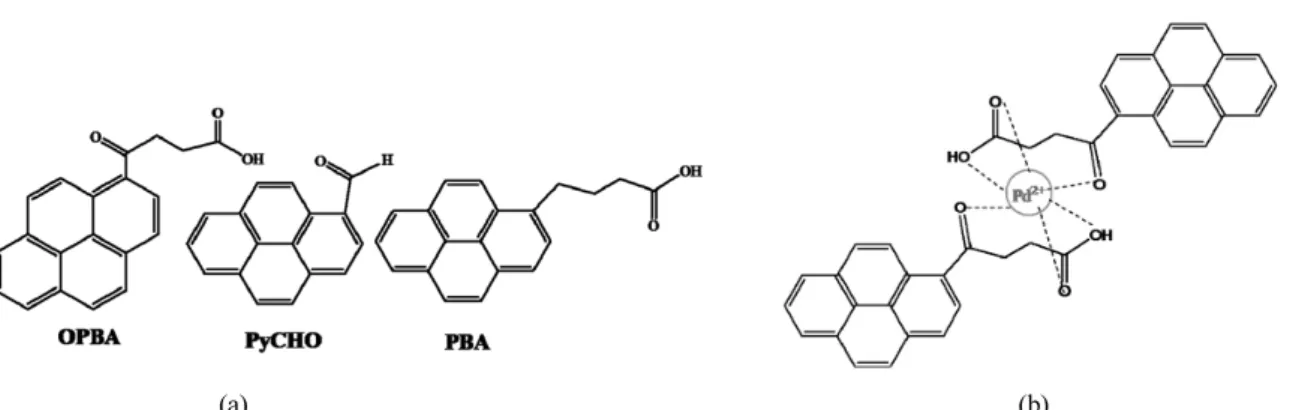
Scheme 1. (a) Chemical structures of γ-oxo-1-pyrenebutyric acid (OPBA), 1-pyrenebutyric acid (PBA) and 1-pyrene-carbox- aldehyde (PyCHO); (b) proposed Pd
2+sensing process.
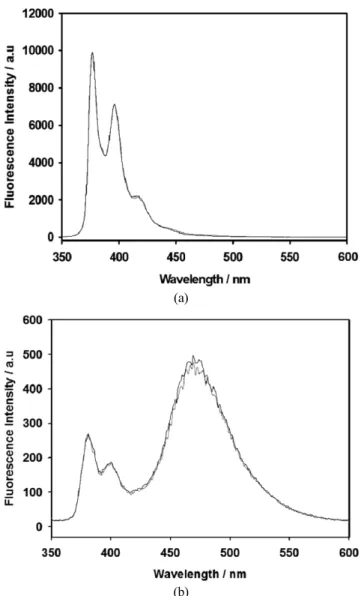
Figure 1. Fluorescence spectra of OPBA with different concentrations (0.6 × 10
-3M) in DMSO/H
2O (1 : 1 (v/v), λ
ex= 340 nm).
3. Results and Discussion
3.1. Photophysical Properties of OPBA
The fluorescence spectra of OPBA (Scheme 1(a)) were recorded with different concentrations (0.6 × 10
-3M) in DMSO/H
2O (1 : 1 (v/v), λ
ex= 340 nm). The fluorescence emission intensity of OPBA at 440 nm increased in the
concentration range of 0.5 × 10
-5M (Figure 1). Further
increasing the concentration above 1 × 10
-4M, the emission
of OPBA was red-shifted and significantly decreased, when
the concentration of OPBA was at 6 × 10
-3M, the monomer
emission at 440 nm completely disappeared and a new
emission peak at approximately 518 nm appeared due to
the excimer formation of pyrene chromophore on OPBA
(a) (b) (c)
Figure 2. (a) Fluorescence spectra of OPBA (6 × 10
-3M) in DMSO/H
2O (1 : 1 (v/v), λ
ex= 340 nm), (b) the plot of λ
em= 455 nm versus the concentration of OPBA (0.1 × 10
-5M), (c) UV-Vis absorption spectra of OPBA (1 × 10
-6M) in aqueous solutions (DMSO/H
2O, 2 : 98 (v/v)).
(a)
(b)
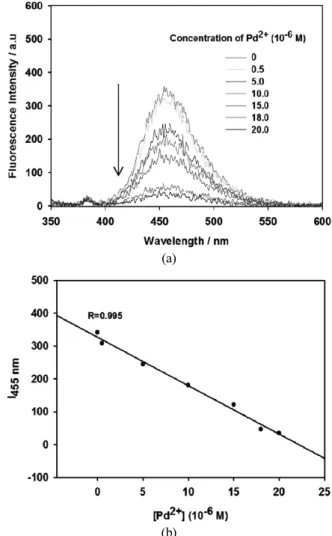
Figure 3. (a) Fluorescence emission spectra of OPBA (1 × 10
-6M) in the presence of different amounts of Pd
2+cati- ons (0.2 × 10
-5M); (b) fluorescence emission of OPBA at 455 nm versus the concentration of the added Pd
2+cations.
(Figures 1 and 2(a))[22-25]. In the concentration range of 0.1 × 10
-5M (Figure 2(b)), the emission of OPBA at 440 nm versus the concentration of OPBA revealed a linear rela- tionship (R = 0.996). The concentration of OPBA was selected at 1 × 10
-6M for all of the following experi- ments in aqueous solutions (DMSO/H
2O (2 : 98, (v/v)).
As shown in Figure 2(c), the absorption spectra of OPBA (1 × 10
-6M) shows an intense band centered at 351 nm, while in the emission spectra the monomer emission maxima of OPBA (1 × 10
-6M) was about 455 nm (Figure 3(a))[26]. The Stokes’shift was calculated from the difference in the absorption and the emission maxima to be 104 nm. Moreover, with increasing the water con- tent, we observed strong red shift of the fluorescence emission band from 440 nm (DMSO/H
2O (1 : 1 (v/v)), Figure 1) to 455 nm (DMSO/H
2O (2 : 98 (v/v)), Figure 3) which can be attributed to the fact that hydrogen bonding raises the energy of the triplet
3n- π* (which was found in the vicinity of lowest singlet
1π-π* excited states) above the lowest singlet
1π-π* excited states thereby re- ducing the ef ficiency of the intersystem crossing[24,26].
3.2. Fluorescence Detection of Pd
2+Cations
Upon titration with Pd
2+(0.2 × 10
-5M), the fluorescence intensity of the monomer emission maximum at 455 nm decreased gradually with the increase of Pd
2+concentration (Figure 3(a)). The fluorescence intensities at 455 nm are linearly proportional to the amount of Pd
2+in the range of 0.2 × 10
-5M (Figure 3(b)) which demonstrated that the Pd
2+ions can be detected quantitatively in the con- centration range of 0.2 × 10
-5M. This curve (Figure 3(b)) can also be served as the calibration curve for the de- tection of Pd
2+, the detection limit of Pd
2+was calculated
to be approximately 0.14 µm[12]. It was assumed that
the FL changes was induced by the 2 : 1 complex for-
(a) (b) (c)
Figure 4. (a) Plot of 1/(I-I
0) versus (1/[Pd]
2+)
1/2based on 2 : 1 binding stoichiometry between OPBA and Pd
2+, (b) Plot of I
0/(I-I
0) versus [Pd
2+]
-1based on 1 : 1 binding stoichiometry, and (c) plot of I
0/(I-I
0) versus [Pd
2+]
-2based on 1 : 2 stoichiometry (bottom) between OPBA and Pd
2+. I
0and I are the fluorescence intensity of OPBA at 455 nm in the absence and presence of Pd
2+.
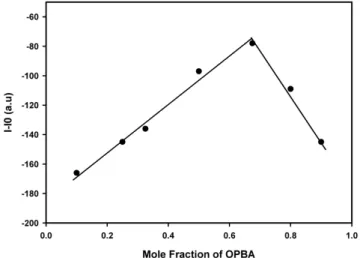
Figure 5. Job’s plot of OPBA with Pd
2+. I and I
0are the fluorescence intensity of OPBA in the presence and absence of Pd
2+, respectively; the total concentration of OPBA and Pd
2+is 10 µM.
(a) (b) (c)
Figure 6.
1H NMR spectra of OPBA (1 × 10
-5M) in the absence (black lines) and presence (red lines) of Pd
2+(6 × 10
-5M).
mation between OPBA and Pd
2+, the association constant was calculated to be 1.6 × 10
3M
-2(Figure 4)[27a]. Moreover,
The approximate Job’s plot[27b] also suggests that OPBA forms a 2 : 1 complex with Pd
2+(Figure 5). There was no pyrene excimer emission in the 2 : 1 complex formed between OPBA and Pd
2+which suggested that the two pyrene chromophores are in the divergent position[11-21].
1