DOI https://doi.org/10.12791/KSBEC.2018.27.4.326 eISSN 2288-100X
Development of Models for Estimating Growth of
Quinoa ( Chenopodium quinoa Willd.) in a Closed-Type Plant Factory System
Jirapa Austin and Young-Yeol Cho*
Major of Horticultural Science, Jeju National University, Jeju 63243, Republic of Korea
Abstract. Crop growth models are useful tools for understanding and integrating knowledge about crop growth.
Models for predicting plant height, net photosynthesis rate, and plant growth of quinoa (Chenopodium quinoa Willd.) as a leafy vegetable in a closed-type plant factory system were developed using empirical model equations such as linear, quadratic, non-rectangular hyperbola, and expolinear equations. Plant growth and yield were measured at 5- day intervals after transplanting. Photosynthesis and growth curve models were calculated. Linear and curve relation- ships were obtained between plant heights and days after transplanting (DAT), however, accuracy of the equation to estimate plant height was linear equation. A non-rectangular hyperbola model was chosen as the response function of net photosynthesis. The light compensation point, light saturation point, and respiration rate were 29, 813and 3.4 μmol·m-2·s-1, respectively. The shoot fresh weight showed a linear relationship with the shoot dry weight. The regres- sion coefficient of the shoot dry weight was 0.75 (R2=0.921***). A non-linear regression was carried out to describe the increase in shoot dry weight of quinoa as a function of time using an expolinear equation. The crop growth rate and relative growth rate were 22.9 g·m-2·d-1 and 0.28 g·g-1·d-1, respectively. These models can accurately estimate plant height, net photosynthesis rate, shoot fresh weight, and shoot dry weight of quinoa.
Additional key words : crop growth rate, expolinear equation, photosynthesis rate, plant height
Introduction
A crop model is a simple representation of a crop, in general, it is used to study crop growth and calculate the growth of a specific species. There are many crop growth models that simulate physiological development, growth, and yield of crops on the basis of interactions between environmental variables and plant physiological processes (Miglietta and Bindi, 1993; Mo et al., 2005). Recently, crop growth models have been used to investigate the optimal control set points associated with plant factory operations (Ioslovich and Gutman, 2000), and these models have become an essential tool to support field research and to improve agricultural productivity. Also, crop growth mod- els can be used in research, and applications such as yield predictions, agricultural planning, farm management, cli- matology and agrometeorology (Miglietta and Bindi, 1993).
A closed-type plant factory system is an automated facil- ity for the production of plants; it provides the benefits of
consistent production of good quality vegetables, particu- larly through monitoring the growing conditions of the plants. Proper environmental control is essential for an increase in productivity and quality in plant factories (Morimoto et al., 1995).
Quinoa (Chenopodium quinoa Willd.) seed provides high nutritional values. The leaves and sprouts can also provide high nutritive values, as well as having high antioxidant and anticancer properties (Gawlik-Dzik et al., 2013; Paśko et al., 2009; Schlick and Bubenheim, 1996); hence, there are a number of benefits to using these as vegetables. This experiment was carried out to collect basic data which could be used for the predicting potential effects on the growth rates of quinoa in a closed-type plant factory sys- tem.
Materials and Methods
1. Plant material
The experiment was conducted in a closed-type plant factory (700×500×300cm, L×W×H) at Jeju National Univer- sity. The seeds were sown into 288 cells of a polyurethane sponge (2.5×2.5×2.5cm) in a plastic tray (30×23×6cm), and sub-irrigated once a day with tap water. Emerged seedlings
*Corresponding author: [email protected]
*Received September 13, 2018; Revised October 6, 2018;
*Accepted October 10, 2018
with fully developed cotyledons were sub-irrigated once a day with a nutrient solution with electrical conductivity (EC) of 0.5dS·m-1 and 1.0dS·m-1 at intervals of one week before transplanting. At the fourth true leaf stage, plants were transplanted into plastic plugs in the holes of a trough.
The plants were spaced 10cm apart within each trough and troughs were spaced 15cm apart (67plants/m2). Plants were grown in the nutrient solution with an EC of 2.0dS·m-1.
2. Closed-type plant factory system
Three-band radiation type fluorescent lamps (55W, Philips Co., Ltd., Amsterdam, the Netherlands) were used as the light source in the closed-type plant factory system.
Light intensity (photosynthetic photon flux density, PPFD) was measured with a quantum sensor (LI-190, Li-Cor Inc., Lincoln, NE, USA), and was maintained at 143μmol·m-2·s-1. The photoperiod was 16/8h (day/night). Temperature was maintained at 23-25oC, and relative humidity and CO2 con- centration were 50-70% and 400-600μmol.mol-1, respec- tively. The nutrient film technique (NFT) system with three layers and four troughs per layer was used for the hydro- ponic system. Total volume of the nutrient solution in the tank was 90L and the nutrient solution was composed of 15 NO3-N, 1 NH4-N, 1 P, 7 K, 4 Ca, 2 Mg, 2 SO4-S mM·L-1. The EC of nutrient solutions was adjusted by mixing with tap water. The pH and EC of the nutrient solution in each treat- ment tank were measured daily, using a pH meter (HI 98106, Hanna Instruments Ltd., Leighton Buzzard, Bed- fordshire, UK) and a portable conductivity meter (COM- 100, HM Digital Inc., Culver City, CA, USA), respec- tively. The pH was adjusted to the range of 5.5-6.5 with potassium hydroxide (KOH) or phosphoric acid (H3PO4), and electrical conductivity was adjusted with concentrated nutrient solution or tap water as necessary. The nutrient solutions were supplied via semi-continuous nutrient cycling through the trough with the pump switching on or off every 10 minutes throughout the growing period. Nutri- ent solution was not renewed during the experimental period.
3. Measurements
Plant growth parameters including plant height, and fresh and dry weight of shoots were measured on 12 plants every 5 days after transplanting. Photosynthetic rate was mea- sured 22 days after transplanting using a portable photosyn- thetic measurement system (Li-6400, Li-Cor Inc., Lincoln,
NE, USA). Plants were randomly selected with 10 replica- tions, and measurements were made on fully expanded leaves.
4. Model construction and validation
Plant height was defined using the following linear and quadratic equations:
H = a·DAT + b or H = a + b·DAT + c·DAT2 (1)
where H is the plant height (cm), DAT is the number of days after transplanting (days), and a, b and c are constants.
Net photosynthetic rate (Pn) was defined with a non-rect- angular hyperbola equation and was calculated according to Goudriaan and Van Laar (1994):
Pn= Pmax·{1− exp(-αxPAR/Pmax)}− R (2)
where Pn is the net photosynthesis rate (μmol·CO2·m-2·s-1), Pmax is the potential photosynthesis rate (μmol·CO2·m-2·s-1), α is the initial gradient under low light conditions (μmol·- CO2·m-2·s-1), PAR is the photosynthetic active radiation (μmol·m-2·s-1), and R is the photosynthesis rate (μmol·- CO2·m-2·s-1) at PAR 0.
The mathematical function used for expressing shoot dry weight by time is called an expolinear equation (Gou- driaan and Monteith, 1990):
Wt= Cm/Rm·1n [1 + exp{Rm· (t− tb)}] (3)
where Wt is biomass (shoot dry weight, g·m-2) at t days from transplanting, Cm is the maximum crop growth rate (g·m-2·d-1), Rm is the maximum relative growth rate (g·g-1·d-1) in the exponential growth phase, t is the time after trans- planting (day), and tb is the time at which the crop effec- tively reaches a linear phase of growth (lost time, d).
5. Statistical analysis
The experiment had a completely randomized design.
Statistical analyses were carried out using the SAS system (Release 9.01, SAS institute Inc., Cary, NC, USA) and Sig- maPlot (Version 9.01, Sistat Software Inc. San Jose, CA, USA). The number of plants for making the plant height model was 16 plants, and the number of validated plants was 144 plants. Variables were estimated using the Gauss- Newton algorithm, a nonlinear least squares technique. The
slopes, intercepts and regression coefficients of the models were compared using the SAS REG procedure. Correla- tion coefficients were calculated between the measured and estimated data.
Results and Discussion
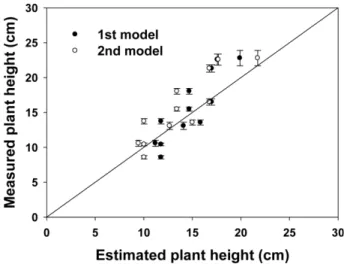
Both linear and curve relationships were observed between the plant heights and days after transplantation (Fig. 1). The plant height model of quinoa was 5.4+0.58·DAT(R2=0.932, P<0.001) or 5.7+0.2·DAT+0.02·DAT2 (R2=0.962, P<0.001), producing a change in plant height of 0.58cm per day or 0.22cm per day. Measured and estimated plant heights were compared (Fig. 2). The linear or curve regression coefficients were 1.07 and 1.12, respectively. The mea- sured and estimated plant heights were shown to be a rea- sonably good fit with two functions, however, a linear relationship was observed between plant height and days after transplantation. For example, when the distance between the light source and the plants is 30cm, they should be harvested in about 50 days after transplanting.
Plant height is one of the most simple and important bio- mass yield components previous research has shown that increasing plant height is the most obvious and direct way to improve biomass yield for biofuel crops (Salas Fernan- dez et al., 2009). The potential growth, and hence the potential increase in total biomass, is adjusted daily accord- ing to the growth constraints. The adjusted daily total bio-
mass production accumulates through the growing season (Arnold et al., 1995). Therefore, total biomass in closed- type plant factory system could be estimated as plant height.
The response of the net photosynthesis rate (Pn) of qui- noa to various light levels was measured and modeled (Fig.
3). The non-rectangular hyperbola model (Goudriaan and Van Larr, 1994) was chosen as the response function of net photosynthesis. From our results, the light compensation point was 29μmol·m-2·s-1 and the light saturation point was Fig. 1. Plant height changes of Chenopodium quinoa with days
after transplanting (DAT). Linear and curve regression analyses were conducted for the modeling of plant height with DAT as a variable. Vertical bars indicated SE (n=4).
Fig. 2. Relationship between the estimated and measured plant height of Chenopodium quinoa. 1st model was 5.4+0.58·DAT and 2nd model was 5.7+0.2·DAT+0.02·DAT2. Vertical bars indi- cated SEs (n=12).
Fig. 3. Light response curves of Chenopodium quinoa leaves at 1,000µmol·mol-1 of CO2 concentration, 50-60% of relative humidity, and 25.0oC of leaf temperature.
813μmol·m-2·s-1 for the quinoa grown for 22 days under a closed-type plant factory system with fluorescent lamps (143μmol·m-2·s-1), and the respiration rate was 3.4μmol·m-2·s-1. The potential photosynthesis rate (Pmax) was 25.3μmol
·CO2·m-2·s-1, and the initial gradient under low light condi- tions (α) was 0.14μmol·CO2·m-2·s-1. The equation of the non-rectangular hyperbola has frequently been used to describe observed leaf photosynthetic responses to environ- mental variables (Calama et al., 2013; Cannell and Thorn- ley, 1998; Kim et al., 2004; Lieth and Pasian, 1990;
Thornley, 2002).
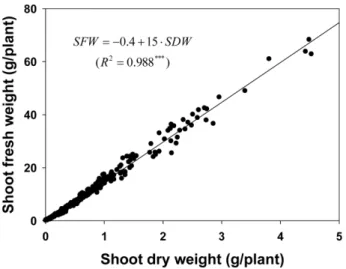
Shoot fresh weight (SFW, g/plant) was shown to be closely related to shoot dry weight (SDW, g/plant), the SFW had a linear relationship with the SDW (Fig. 4). From the model, the SFW was calculated as 15 times the SDW.
The measured and estimated SFWs were shown to have a reasonably good fit with this function. Most research on crop productivity has usually concentrated on dry matter, however, fresh weight is of economic interest in the com- mercial vegetable production sector (Cho and Son, 2009).
A non-linear regression was carried out to describe the increase in shoot dry weight of quinoa as a function of time using an expolinear equation. The maximum crop growth rate was 22.9g·m-2·d-1, the maximum relative growth rate was 0.28g·g-1·d-1 in the exponential growth phase, and the time at which the crop effectively reached a linear phase of growth was 13 days (Fig. 5). The curve of the function indicated a pattern of expolinear growth as suggested by Goudriaan and Monteith (1990). Basically, the growth of
crop was exponential with a maximum relative growth rate, and later becomes linear with a maximum crop growth rate.
The expolinear growth model as a type of crop growth model has been applied to many crops and has the poten- tial to predict crop growth and yield.
The measured and estimated shoot dry weights were compared (Fig. 6). The regression coefficient was 0.75 (R2=0.921, P<0.001), indicating estimated shoot dry weights were 25% less than the measured values. The mea- sured and estimated shoot dry weights were shown to be a reasonably good fit with this function. The crop yield was Fig. 4. Relationship between shoot dry weight and shoot fresh
weight of Chenopodium quinoa (n=333).
Fig. 5. Shoot dry weights (g·m-2) of quinoa with days after trans- planting. Vertical bars indicated SEs of the means of 4 replica- tions.
Fig. 6. Relationship between the estimated and measured shoot dry weights of Chenopodium quinoa. Vertical bars indicated SEs (n=4).
calculated as the total dry matter multiplied by the harvest index (Mo, et al., 2005). For instance, with fresh weight per plant at harvest (30g), we can estimate plant height (about 10cm), harvest time (about 18 days), and fresh weight per area (about 2kg·m-2).
It is concluded from this modeling study that growth and yield of quinoa in a closed-type plant factory system respond to photosynthetic active radiation. The non-rectan- gular hyperbola model was chosen as the response func- tion for net photosynthesis. The modeling growth and yield responses to environmental variables are very useful for the prediction of attainable quinoa yield and to identify the constraints on crop production and management strategies.
The results of the present study evidence the importance of continuous research on the economic feasibility for produc- ing quinoa as a leafy vegetable grown in a closed-type plant factory system.
Acknowledgement
Financial support for this research was supported by a grant from 2018 research Fund (PJ013852) of Rural Devel- opment Administration, Republic of Korea
Literature Cited
Arnold, J.G., M.A. Weltz, E.E. Alberts, and D.C. Flanagan.
1995. Plant growth component. Chapter 8 in USDA–water erosion prediction project: hillslope profile and watershed model documentation, 8.1-8.41. NSERL report No. 10. D.C.
Flanagan, Nearing, M.A., and J.M. Laflen (eds.). West Lafayette, Ind: USDA-ARS National Soil Erosion Research Laboratory.
Calama, R., J. Puértolas, G. Madrigala, and M. Pardosa. 2013.
Modeling the environmental response of leaf net photosyn- thesis in Pinus pinea L. natural regeneration. Ecol. Model.
251:9-21.
Cannell, M.G.R. and J.H.M. Thornley. 1988. Temperature and CO2 responses of leaf and canopy photosynthesis: a clarifi- cation using the non-rectangular hyperbola model of photo- synthesis. Ann. Bot. 82:883-892.
Cho, Y.Y. and J.E. Son. 2009. Determination of suitable parameters for developing adequate growth model of pak- choi plants. Hortic. Environ. Biotechnol. 50:532-535.
Gawlik-Dziki, U., M. Świecaa, M., Sułkowski, D.Dziki, B.
Baraniaka, and J. Czyz. 2013. Antioxidant and anticancer activities of Chenopodium quinoa leaves extracts–In vitro study. Food Chem.Toxicol. 57:154-160.
Goudriaan, J. and J.L. Monteith. 1990. A mathematical func- tion for crop growth based on light interception and leaf area expansion. Ann. Bot. 66:695-701.
Goudriaan, J. and H.H. Van Laar. 1994. Modelling potential crop growth processes: Textbook with exercises. Current issues in production ecology 2. Dordrecht: Kluwer Aca- demic Publishers. Ioslovich, I. and P.O. Gutman. 2000.
Optimal control of crop spacing in a plant factory. Automat- ica 36:1665-1668.
Kim, S.H., K.A. Shackel, and J.H. Lieth. 2004. Bending alters water balance and reduces photosynthesis of rose shoot. J.
Amer. Soc. Hortic. Sci. 129:896-901.
Lieth, J.H. and C.C. Pasian. 1990. A model for net photosyn- thesis of rose leaves as a function of photosynthetically active radiation, leaf temperature, and leaf age. J. Amer.
Soc. Hortic. Sci. 115:486-491.
Miglietta, F. and M. Bindi. 1993. Crop growth simulation models for research, farm management and agrometeorol- ogy. EARSel, Advances in Remote Sensing 2(2-VI):148- 157.
Mo, X., S. Liua, Z. Lina, Y. Xub, Y. Xianga, and T.R. McVi- carc. 2005. Prediction of crop yield, water consumption and water use efficiency with a SVAT-crop growth model using remotely sensed data on the North China Plain. Ecol.
Model. 183:301-322.
Morimoto, T., T. Torii, and Y. Hashimoto. 1995. Optimal con- trol of physiological processes of plants in a green plant fac- tory. Control Eng. Pract. 3:505-511.
Paśko, P., H. Bartoń, P. Zagrodzki, S. Gorinstein, M. Fołta, and Z. Zachwieja. 2009. Anthocyanins, total polyphenols and antioxidant activity in amaranth and quinoa seeds and sprouts during their growth. Food Chem. 115:994-998.
Salas Fernandez, M.G., P.W. Becraft, Y. Yin, and T. Lubberst- edt. 2009. From dwarves to giants? Plant height manipula- tion for biomass yield. Trends Plant Sci. 14:454-461.
Schlick, G. and D.L. Bubenheim. 1996. Quinoa: candidate crop for NASA's controlled ecological life support systems.
p. 632-640. In: J. Janick (ed.), Progress in new crops. ASHS Press, Arlington, VA. https://www.hort.purdue.edu/newcrop/
proceedings1996/V3-632.html. Accessed 10 Sep. 2018.
Thornley, J.H.M. 2002. Instantaneous canopy photosynthesis:
analytical expressions for sun and shade leaves based on exponential light decay down the canopy and an acclimated non-rectangular hyperbola for leaf photosynthesis. Ann.
Bot. 89:451-458.
완전제어형 식물공장에서 퀴노아 (Chenopodium quinoa Willd.)의 생장을 예측하기 위한 모델 개발
오스틴 지라파
1· 조영열
1*
1제주대학교 원예환경전공
적 요. 작물 생육 모델은 작물의 생육을 이해하고 통합하기 위해 유용한 도구이다. 완전제어형 식물공장에서
엽채류로 활용하기 위한 퀴노아(Chenopodium quinoa Willd.)의 초장, 광합성률, 생장 모델을 예측하기 위한 모 델을 1차식, 2차식 및 비선형 및 선형지수 등식을 사용하여 개발하였다. 식물 생육과 수량은 정식 후 5일간격 으로 측정하였다. 광합성과 생장 곡선 모델을 계산하였다. 초장과 정식 후 일수(DAT)간의 선형 및 곡선 관계 를 얻었으나, 초장을 정확하게 예측하기 위한 모델은 선형 등식이었다. 광합성률 모델을 비선형 등식을 선택하 였다. 광보상점, 광포화점, 및 호흡률은 각각 29, 813and 3.4µmol·m-2·s-1였다. 지상부 생체중과 건물중은 선형 관계를 보였다. 지상부 건물중의 회귀계수는 0.75 (R2=0.921***)였다. 선형지수 수식을 사용하여 시간 함수에 따른 퀴노아의 지상부 건물중 증가를 비선형 회귀식으로 수행하였다. 작물생장률과 상대생장률은 각각 22.9 g·m-2·d-1 and 0.28 g·g-1·d-1였다. 이러한 모델들은 정확하게 퀴노아의 초장, 광합성률, 지상부 생체중과 건물 중을 예측할 수 있다.
추가주제어 : 작물생장률, 선형지수 등식, 광합성률, 초장