1. Introduction
1.1 Background and Research Problems Approximately 40 % of the world ’ s population currently lives within 50 kilometers of the coast (Small and Nicholls, 2003) and 37 % of the total U.S. population resides in coastal counties con- sidering both ocean and Great Lake Shores (Crowell et al., 2007).
With the increasing demand of living in near coasts, coastal areas are particularly prone to conflicts of interest between development and preservation because they embody multiple values as places for residence, commerce, outdoor recreation, wildlife habitat, nurs- eries of commercial fisheries, and ecosystem services (Klein, Osleeb, and Viola, 2004). There is growing concern, however,
that increasing human activity and urban sprawl threaten the coastal environment in barrier islands particularly, and measures need to be taken to protect coastlines from development pressure (Yu, 2009; Zhang and Leatherman, 2011; Yang, 2011).
Therefore, a comprehensive master plan taking into account human and natural activity is required along with long-term moni- toring. Additionally, human activity related to development is a topic that generates severely conflicting opinions among stake- holders.
The area of interest in this study is Jekyll Island, one of the bar- rier islands of the state of Georgia (GA). Jekyll Island has been facing problems associated with redevelopment undertaken to increase economic profits. The island is off the southeast coast of
Investigating Ways of Developed and
Undeveloped Features from Satellite Images -Balancing Coastal Development and Preservation-
Byungyun Yang
1)Abstract
This research attempted to find possibilities of the practical use utilizing geospatial methods for the balanced promo- tion of sustainable coastal development and preservation through a case study of Jekyll Island, one of Georgia’s barrier islands. In response, this research provided ways for practical use in sustainable development and preservation plans.
First this research thoroughly investigated the 1996 master plan of Jekyll Island and tried to recalculate developed and undeveloped areas. Second, new estimations for developed areas were investigated through field survey. Third, this research proposed the use of the satellite images with different levels of spatial resolutions and tested different classifi- cation schemes to find possibilities for practical use. For these purposes, first, we classified developed and undeveloped features by manual digitization using an aerial photo image with 0.5m spatial resolution. Second, a Landsat 7 ETM+
and a QuickBird satellite images with mid- and high-levels of spatial resolutions were applied to identify developed and undeveloped areas using both the National Land Cover Data (NLCD) and the Coastal Change Analysis Program (C- CAP) classification schemes. Also, GEOBIA (Geographic Object-Based Image Analysis) was conducted to accurately identify developed and undeveloped areas.
Keywords : coastal area, barrier island, GEOBIA (Geographic Object-Based Image Analysis), QuickBird satellite image, developed and undeveloped areas
1) Member, Research Associate, Center for Remote Sensing and Mapping Science (CRMS), University of Georgia, Athens, GA USA
(E-mail : [email protected]).
the U.S in Glynn County, Georgia. Jekyll Island is owned by GA and managed by the Jekyll Island State Park Authority (JISPA) for the purposes of public use. According to the 1996 master plan, there are several standards for development: First, with the signing of House Bill (HB) 214 into law by Governor Sonny Perdue, Jekyll Island entered a new phase of revitalization with strict pro- tections from overdevelopment intact. By law, the size of the developed area of the island was limited to 35 % sometime around 1970. HB 214 reinforces limited development of the fragile barrier island to not more than 35% of land above mean high water (MHW) level, leaving 65 % to remain in a natural state (JIA, 1996). In addition, in 2007, the Georgia legislature limited devel- opment on the southern portion of the island, defined as that por- tion “lying south of 31 degrees, 1 minute, 34 seconds north lati- tude as depicted on the U.S. Geological Survey (USGS) topo- graphic survey 7.5 minute series” , which is roughly described as south of the large water tower (JIA, 2004). The JISPA calculated developed and undeveloped acres based on comprehensive map- ping with field verification. Total estimation is 17.105㎢ which was referenced to 1.31 m MHW referenced to the National Geodetic Vertical Datum of 1929 (NGVD 29). The undeveloped areas are 11.557㎢ (65 %), while the developed areas are 5.548㎢
(32.44 %). It means that the remaining 0.438㎢ (2.56 %) is avail- able for potential development. Accordingly, the JISPA wants to rebuild some of the resorts and parking lots for potential future development (JIA, 1996). In response to these major development plans, the Initiative to Protect Jekyll Island (IPJI), a non-profit organization, was created to protect the island’ s unspoiled land- scape from the recent redevelopment (IPJI, 2009). The IPJI and JISPA seek a breakthrough to resolve the differences regarding development and preservation resulting from differing affiliations and perspectives.
In response to the need for sustainable costal management of Jekyll Island, this research proposed the use of the satel- lite images with different levels of spatial resolutions and tested different classification standards already established to find possibilities for practical use. For these purposes, we classified developed and undeveloped areas manual digitiza- tion using an aerial photo image with 0.5m spatial resolu- tion. Second, a Landsat 7 ETM+ and a QuickBird satellite image with mid- and high-levels of spatial resolution were applied to identify developed and undeveloped areas using
the National Land Cover Data (NLCD) classification schemes developed by the Multi-Resolution Land Characteristics Consortium (MRLC) and the Coastal Change Analysis Program (C-CAP) classification schemes developed by NOAA. Also, Geographic Object-Based Image Analysis (GEOBIA) was conducted to accurately classify developed and undeveloped areas. All estimations for developed and undeveloped areas were compared for the use of coastal management using satellite images.
2. Study Area
Jekyll Island was selected for this research because it is a state- owned and managed island of growing interest to coastal man- agers, conservationists, residents, and, especially, the public with regard to both development and preservation concerns. Figure 1 shows the golf course (a), historical cottage (b) once owned by a millionaire, driftwood (c) affected by beach erosion process, and beach (d).
Jekyll Island is one of the many barrier islands on Georgia’ s coast. It also is one of the Golden Isles of Georgia (McDonald, 2010). Georgians call it Georgia’ s Jewel. The reason is clear, Jekyll island offers significant and diverse natural areas such turtle habitats, extensive marshes, shrimp, and other local seafood, and in spite of being comparatively small, it has a diversity of marine, beach, and dune systems including uplands and freshwater habi- tats that support an estimated 845 plants, 219 invertebrates, 215 fish, 41 amphibians, 66 reptiles, 346 birds, and 50 mammal species (Bagwell, 2001).
Fig. 1. Study area (Jekyll Island, GA).
3. Methods and Data
This research provided examples of how applied satellite images can be used, along with the aforementioned classification techniques, to find the best way to analyze quickly and accurately land use type of a wider area. The best accurate way to calculate areas for all features would be a field survey such as Global Positioning System (GPS) or Total Station (TS) surveying.
However, these methods are costly, and labor and time intensive (Bossler, 2010; Yang et al., 2012a and 2012b). Thus, this research not only provided various ways to estimate total developed and undeveloped areas using classification schemes by the satellite images but also proposed possibilities for the practical use of high resolution satellite images. Such a process will assist coastal man- agers in gaining a better understanding for management of coastal planning. The flowing Figure 2 shows the flow chart of this study.
First, reassessment for the 1996 master plan is strongly needed to resolve the current conflict between coastal managers and con- servationists (a). Thus, this research first investigated the 1996 master plan and added recent development of paved bike paths acquired by field survey (b). The locations of bike paths were determined by a hand-held GPS unit. The paths were delineated on an aerial photo (Figure 3). Specifically, for recalculation, this research utilized two methods; first, the recently changed or devel- oped bike trails, some of the paved access roads, the landfill area, and the Residential VISTAS areas were calculated, and the width of these features were estimated by buffering analysis.
Furthermore, land use types for developed and undeveloped areas
were identified by manual delineation on an aerial photo image with 0.5m spatial resolution. Second, the classification schemes were introduced to estimate total developed and undeveloped areas (c-1). This research used the National Land Cover Data (NLCD) classification schemes developed by the Multi- Resolution Land Characteristics Consortium (MRLC) and the Coastal Change Analysis Program (C-CAP) classification schemes developed by NOAA (Anderson et al., 1971; Cowardin et al., 1979). The two classification schemes were used using Landsat 7 ETM+. C-CAP is a nationally standardized database of land cover and land change information, developed using remote- ly sensed imagery, for the coastal regions of the U.S (Dobson et al., 1995). Therefore, there are a few differences in the classifica- tions when comparing NLCD to C-CAP data. Additionally, a QuickBird satellite image was used to classify developed and undeveloped areas applied by GEOBIA and pixel-based image analysis (c-2). The QuickBird satellite image has a 0.68 cm spatial resolution in a panchromatic image and 4 multispectral bands. The satellite image is provided by the DigitalGlobe Inc. and was taken Jan 31, 2003. Finally, rates of developed area were estimated using the considerations above (d).
In this study, we used GEOBIA, which has been proposed to classify developed and undeveloped areas. GEOBIA considers spatial relationships between objects, and contextual information such as a color and texture information in a step of segmentation (Blaschke et al., 2008; Hay and Castilla, 2008; Addink et al., 2012). It also means that GEOBIA follows Tobler’ s first law spa- tially. Additionally, it uses that fuzzification has available condi- tions to be classified, such as “and,” “or,” “exclusive,”and
“combined condition.”Last, classified objects over GEOBIA can
be easily converted as vector format to be used in GIS environ-
ments (Kim et al., 2010). Conventionally, automated LULC clas-
sification has used pixel-based spectral information from multiple
bands as input to statistical methods that separate multidimension-
al clusters of digital numbers and assign LULC classes to each
cluster. However, this approach has limitations in that imagery of
high spatial resolution creates increase spectral variability within
individual object training sets for classification, which, therefore,
may not be spectrally unique or homogeneous. Thus, GEOBIA
provides semi-automated classification analysis to overcome these
problems using multiple criteria associated with human’ s experi-
ences. The purpose of the study is to find possibilities for the prac-
Fig. 2. Study flow-chart.
tical use of the satellite images in coastal management. Thus, tech- nical processes with respect to GEOBIA will not be covered in this research.
4. Results
4.1 Investigation of the 1996 Master Plan
The 1996 master plan provided 38 tables calculating developed and undeveloped areas. First, we thoroughly examined the 38 tables to confirm all the totals. The column lines in both the devel- oped and the disturbed areas in the 38 tables appear to be a little confusing due to the arrangement of the different lines. However, regardless of the different arrangement of values, all value totals should be in accordance with the total values, as stated by the Authority.
The first column’ s values show recalculated sums in each row, including natural, developed, disturbed, and Below Mean High Water (BMHW). Each row’ s values have different values, so we assumed that the total values were miscalculated at that time.
Thus, all the table’ s values in the 1996 master plan should be
reconsidered or recalculated. Second, we found logical contradic- tions in terms of the definitions of developed and undeveloped areas proposed by the JIASP (Table 2).
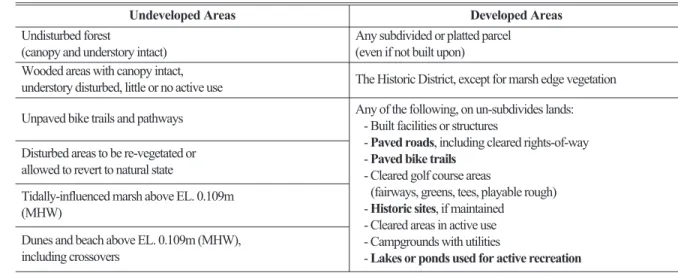
As noted in Table 2, the definitions of developed and unde- veloped areas were determined by the JIASP. The legislation, generally, provides no definitions for these terms, so the plan- ning team adopted classification criteria (Table 2) with the con- currence of the state Attorney General’ s office (JIA, 1996).
Although the planning team did research based on legal prece- dent along with the specific site conditions of Jekyll Island, the 1996 master plan had significant calculation errors. In summary, the undeveloped areas include natural areas, unpaved roads, and no active use areas, while the developed areas contain paved roads, built facilities and residential areas. Given this research relies on the definitions (texts in bold in Table 2), the ponds for human use, historical sites, and spots being active should be cor- rectly included in developed areas. Additionally, Residential VISTAS (0.019㎢) and Land Fill (0.0595㎢) areas classified as the disturbed areas in the 1996 master plan, are being used for human activity and uses. Through field survey, we found that residential VISTAS areas were paved. Although landfill area is
Table 2. Definitions of undeveloped and developed areas (Source: JIA, 1996).
Table 1. Miscalculations in the 38 tables in the 1996 master plan.
Sum Natural Developed Disturbed BMHW
Recalculated sum 10.586 5.010 1.290 3.656
Sum of the 1996 Master plan 10.812 5.246 1.046 3.580
Differences -0.226 -0.236 0.244 0.076
Unit: ㎢㎢
Undeveloped Areas Developed Areas
Undisturbed forest
(canopy and understory intact)
Any subdivided or platted parcel (even if not built upon) Wooded areas with canopy intact,
understory disturbed, little or no active use The Historic District, except for marsh edge vegetation Unpaved bike trails and pathways Any of the following, on un-subdivides lands:
- Built facilities or structures
- Paved roads, including cleared rights-of-way - Paved bike trails
- Cleared golf course areas
(fairways, greens, tees, playable rough) - Historic sites, if maintained
- Cleared areas in active use - Campgrounds with utilities
- Lakes or ponds used for active recreation Disturbed areas to be re-vegetated or
allowed to revert to natural state
Tidally-influenced marsh above EL. 0.109m (MHW)
Dunes and beach above EL. 0.109m (MHW),
including crossovers
of the destroyed natural areas for human use, the area was not regarded as the developed area. Besides, we had a couple of questions related to the definition’ s ambiguity. For example, ponds being used for active recreation were defined as devel- oped area, but the ponds in golf fairways were not included as developed area. In the Discussion session, the issue will continue to be debated. Last, from the above evidence, it would be a seri- ous oversight to conclude that the developed area determined by the Authority is correct.
4.2 New Estimation based on the 1996 Master Plan
In this section, we added areas of new paved bike trails, some paved access roads, a landfill, and residential VISTAS investigat- ed in the previous section. These, definitely, should be included as developed areas. Thus, using field survey, this research examined the bike paths recently updated or rebuilt. To estimate the loca- tions, we used a hand-held GPS unit with a tape measure to deter- mine the widths of the bike paths. Finally, polygon features for bike paths were created on the aerial photo image. Figure 3 shows estimations of bike paths.
Figure 3A presents the bike trails areas, which had only 0.0203
㎢ in the 1996 master plan. This research considered a total of 0.104㎢ of bike paths resulting from the field survey. The polygon features for the bike paths were generated by buffering analysis.
Finally, we excluded 0.0203㎢ from the 0.104㎢ because the planning teams had been already considered these 0.0203㎢ in the 1996 master plan.
4.3 Comparison of Classification Schemes and Image Classification Analysis for Developed and Undeveloped Areas
In this section, we used both the C-CAP and the NLCD classifi- cation schemes presented by NOAA and MRLC. The two classi- fication schemes are commonly used for LULC classification.
The C-CAP and NLCD classification schemes are useful for accurate intermediate-scale land cover information for a variety of applications and are used for predictions of land-use and land- cover changes. The classification schemes for LULC, therefore, could be very important for the practical uses of coastal manage- ment. First, we manually delineated developed and undeveloped areas based on the definitions in the 1996 master plan (Figure 4A).
Second, the image classification schemes of both NLCD and C- CAP were utilized to estimate total developed and undeveloped areas (Figure 4B and C).
Figure 4A has 4.568 ㎢ for residential areas and 1.545㎢ for golf fairways. So, the total developed areas are 6.113 ㎢. Figure 4B illustrates the developed and undeveloped areas using the NLCD classification scheme implemented by Landsat 7 ETM+ with 30 m spatial resolution. The developed areas are 6.113 ㎢. The area classified by the C-CAP classification scheme has 3.936 ㎢ (Figure 4C). Figures 4B and 4C showed big differences for devel- oped areas because, first, they have a mid-level of spatial resolu- tion that is not sufficient to classify small features and, second, the classification schemes have different criteria for separating levels of classes.
Fig. 3. Bike paths newly calculated by field measurement.
Fig. 4. Comparison of developed (red + green colors) and undevel-
oped (yellow color) areas by manual delineation (A), Landsat
7 ETM+ (B and C), and a QuickBird satellite image (D + E).
In the next step, we used a high resolution satellite image in order to obtain highly detailed feature identification. First, a pixel- based information analysis was conducted by the iterative Self Organizing Data Analysis Technique (ISODATA), which is an unsupervised classification method (Schowengerdt, 1997; Duda et al., 2001; Stow et al., 2003). So, it estimated 4.357㎢ as developed areas. Using the results in Figure 4D, however, it is hard to cor- rectly identify all features because the image holds a great level of detailed reflectance values in each pixel. Thus, the pixel-based image classification is limited in its ability to identify all features using the very high spatial resolution satellite images. In other words, previously classified features are often included in inappro- priate classes. We, thus, used GEOBIA which has 6.513㎢ for developed areas. In sum, Table 3 shows the developed acres based on different approaches provided above.
We used 17.105㎢ for total area of Jekyll Island which was originally estimated by JISPA and developed acres newly estimat- ed were applied with the total area to estimate the rate of devel- oped areas. Taking all of these into account, developed areas were calculated differently. First, manually digitized developed areas represented 35.74 % and when considering the wrong values and the logical contradictions proposed in this research, the new calcu- lation showed 33.37 % for the developed areas. The two estima- tions were close to the existing calculation of the 1996 master plan (32.44 %). Using different classification schemes, the NLCD clas- sification scheme presented 28.41 %, and the C-CAP classifica- tion scheme showed 23.01 % for developed areas. In cases in which a Quick Bird satellite image was used, the result from a pixel-based image classification was 25.47 %, while the estima-
tion resulting from GEOBIA showed 38.08 % for the developed areas.
These results estimated above provided examples of how applied satellite images can be used, along with the aforemen- tioned classification techniques, to find the best way to analyze quickly and accurately land use types of a wider area (Lee and Hwang, 2006; Hwang, 2008). The classification results estab- lished in this research were much clearer than the other classifica- tion schemes. The reason is that NLCD and C-CAP were exam- ined using post-classification and ancillary data to improve classi- fication accuracy. Despite the improvement of classification accu- racy, the two classification schemes use slightly different criteria for land use/cover types. Therefore, although they used the same dataset (Landsat 7 ETM+), the big differences for the developed areas were represented. Regarding the use of the QuickBird satel- lite image, a pixel-based image analysis, conventionally, is used to classify features. The analysis implemented by the pixel-based image classification showed poorer classification results and lower estimation for the developed areas than the result and classification applied by GEOBIA (Table 4 and Figure 4). In fact, this research did not consider problems such as the confused reflectance values between urban and beach areas, shadows of forest areas, and espe- cially canopy problems of forest vegetation. However, the estima- tion resulting from GEOBIA was accurately calculated for all fea- tures.
5. Discussion
As stated earlier, this research is limited in its ability to define Table 3. All of recalculated results of Jekyll Island.
Unit: ㎢㎢Based on the 1996 Master Plan
LANDSAT (30m): 2001 QuickBird Satellite Image Existing New Calculations
Methods
Aerial photo interpretation and Land survey
Manual Digitization
Bike Paths, Landfill, and Residential VISTAS
NLCD C-CAP Pixel-Based
Information GEOBIA
Undeveloped 11.557
Developed 5.548 6.113 5.708 4.860 3.936 4.357 6.513
Total area 17.105
Percent 32.44 % 35.74 % 33.37 % 28.41 % 23.01 % 25.47 % 38.08 %
Residential VISTAS, Bike trails, and paved access roads
0.0595 [Landfill] +0.0190 [Residential VISTAS] + (0.104 - 0.0203)[Bike trails and access roads] = 0.162
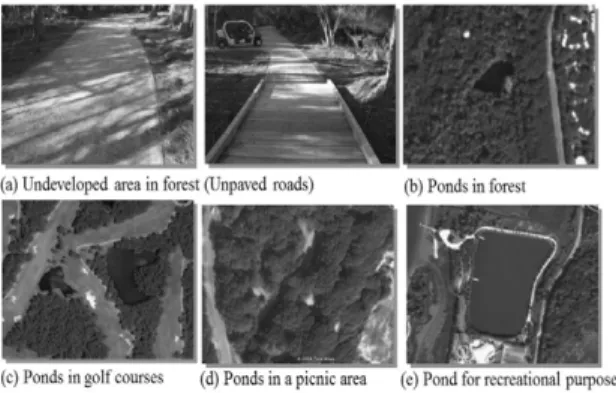
developed areas and undeveloped areas. It is not clear yet whether or not unpaved roads and ponds should be included in developed and undeveloped areas (Figure 5).
Figure 5 shows unpaved roads in a forest (Figure 5a). Though unpaved roads were built by human and were used for recreational activity, According to the 1996 master plan, unpaved roads in for- est were not considered as developed area, while unpaved roads or dirt roads in developed areas were included as developed area. In cases of ponds, these present more critical contradictions for clas- sifying features in developed and undeveloped areas. Based on the definition of the 1996 master plan, lakes or ponds used for active recreation should be in developed area. However, the ponds in both golf courses and one recreational park have contradictory results. For example, Figure 5c is of ponds in golf fairways; it was not included as developed area. Figure 5b is of ponds in a forest area; it was also included as undeveloped area. Ponds in Figures 5d and e were included as developed area; figure 5d is of ponds located at the south east portion of the island, and the area is designed as a picnic area for the public. Figure 5e is of a pond for recreational purpose. In fact, all the ponds in the island were first naturally created, and ponds in golf courses and the pond in Figure 5e are managed for human use.
Given these interpretations, we can include the ponds of golf fairways as developed areas. The reasons are that ponds of golf fairways have recreational purposes and are artificial structures like the ponds in Figure 5e. However, the Authority did not include the ponds within golf fairways. According to the table of the disturbed area given by the 1996 master plan, the size of the ponds within golf fairways was 0.265㎢. So, if we add 0.265㎢ to the newly recalculated developed area, which is 5.708㎢ (33.37
%), the total developed acreage would be reached to 35 %. The conclusion provided above can be briefly stated as follows: first, we need new definitions of developed and undeveloped areas regarding scientific approaches. In addition, developed and unde- veloped areas of Jekyll Island should be recalculated by means of more accurate and precise approaches such as GIScience and Remote Sensing.
6. Conclusions
Coastal management issues of sustainable development and preservation are global in scope and growing in importance (Yu, 2009). Especially, the natural resources on coasts are threatened by human and natural activity and these activities result from big damages on it. Additionally, excessive coastal development to increase economic growth brings conflict of interest among stake- holders. Thus, considering geographic perspectives, systematic approach is necessary, and efforts to resolve the conflicts are demanded using a variety of reasonable ways.
In sum, this study assessed the 1996 master plan to resolve the conflict of interest between coastal managers and conservationists.
Especially, the public’ s and scientists’participation were strongly encouraged by the JISPA and IPJI. In response to their request, we conducted this research to assess and investigated the 1996 master plan and provided possibilities for the practical use of satellite images. Through this research, we concluded that it is necessary both to recalculate the acreage on Jekyll Island and to attempt to build a conceptual design about what the definition of developed and undeveloped areas are. These also require a scientific-based approach to finally establish a classification standard for coastal resources. Ultimately, such criteria are able to allow coastal man- agers to develop an ecosystem model for sustainable development and preservation. Also, the criteria would be applied to a new mas- ter plan having an effective balance between the development and preservation of barrier islands. Therefore, we need to make an effort to implement an environmentally friendly long-term plan, rather than a short-sighted policy, as we could spoil the landscape and lose vital natural resources.
References
Addink, E. A., Van Coillie, F. M. B., and De Jong, S. M. (2012),
Fig. 5. Confusion of developed and undeveloped areas.
Introduction to the GEOBIA 2010 special issue: From pixels to geographic objects in remote sensing image analysis, International Journal of Applied Earth Observation and Geoinformation, Vol.15, No. 0, pp. 1-6.
Anderson, J.R. (1971), Land use classification schemes used in selected recent geographic applications of remote sensing, Photogrammetric Engineering and Remote Sensing, Vol. 37, No. 4, pp. 379-387.
Bagwell, T. E. (2001), Images of America: Jekyll Island State Park A State Park, Arcadia Publishing, Charleston, SC.
Blaschke, T., Lang, S., and Hay, G. (2008), Object-based Image Analysis Spatial Concepts for Knowledge-driven Remote Sensing Applications. In Lecture notes in geoinformation and cartography, Springer, Berlin, London.
Bossler, J.D., Campbell, J.B., McMaster, R.B., and Rizos, C.
(2010), Manual of Geospatial Science and Technology 2
nded., CRC Press/Taylor & Francis, Boca Raton, FL.
Cowardin, L.M., Carter, V., Golet, F.C., and Laroe, E.T. (1979), A Classification of Wetlands and Deep-water Habitats of the United States, Washington, D.C.: U.S. Government Printing Office, Office of Biological Services, Fish and Wildlife Service, FWS/ OBS-79/31, stock number GPO 024-010-00524-6.
Crowell, M., Edelman, S., Coulton, K., and McAfee, S. (2007), How many people live in coastal areas? Journal of Coastal Research, Vol. 23, No. 5, pp. Iii-Vi.
Dobson, J.E., Bright, E.A., Ferguson, R.L., Field, D.W., Wood, L.L., Haddad, K.D., Iredale, H., Jensen, J.R., Klemas, V.V., Orth, R.J., and Thomas, J.P. (1995), NOAA Coastal Change Analysis Program (CCAP): guidance for regional implementa- tion, NOAA Technical Report NMFS 123, U.S. Department of Commerce, Seattle, Washington.
Duda, R., Hart, P. E., and Stork, D .G. (2001), Pattern Classification, 2
nded., John Wiley and Sons, Inc., New York, NY.
Hay, G.J., and Castilla, G. ( 2008), Geographic object-based image analysis (GEOBIA): A new name for a new discipline, Object-Based Image Analysis - Spatial Concepts for Knowledge-driven Remote Sensing Applications (T. Blaschke, S. Lang, and G.J. Hay, editors), Springer, Verlag, Berlin.
Hwang, C.S. (2008), The application of spatial statistics for land- use and land-cover change followed by substantial develop- ment, The Geographical Journal of Korea, Vol. 42, No. 4, pp.
647-658.
IPJI. (2009), The Initiative to Protect Jekyll Island State Park (IPJI): Who We Are and What We Stand For, Jekyll Island, Glynn County, GA.
JIA. (1996), The Jekyll Island State Park State Park Authority (JIA): Final Master Plan for The Management Preservation, Protection, and Development of Jekyll Island State Park, Jekyll Island, Glynn County, GA.
JIA. (2004), Jekyll Island State Park Island-wide Master Plan Update, Jekyll Island, Glynn County, GA.
Kim, M, Madden, M, and Xu, B. (2010), GEOBIA Vegetation Mapping in Great Smoky Mountains National Park with Spectral and Non-spectral Ancillary Information, Photogrammetric Engineering and Remote Sensing, Vol. 76, No. 2, pp. 139-149.
Klein, Y. L., Osleeb, J. P., and Viola, and M. R. (2004), Tourism- generated earnings in the coastal zone: A regional analysis, Journal of Coastal Research, Vol. 20, No. 4, pp. 1080-1088.
Lee Hyungdong, Hwang, C. (2006), The Spatio-temporal Change of the Land Use Pattern According to the Substantial Residential Site Development, The Geographical Journal of Korea, Vol. 40, No. 1, pp. 155-167.
McDonald, B. (2010), Remember Jekyll Island State Park, Langdon Street Press, Minneapolis, MN.
Schowengerdt, R. A. (1997), Remote Sensing Models and Methods for Image Processing, 2
nded., Academic, New York, NY.
Small, C. and Nicholls, R.J. (2003), A global analysis of human settlement in coastal zones, Journal of Coastal Research, Vol.
19, No. 3, pp. 584-599.
Stow, D., Coulter, L., Kaiser, J., Hope, A., Service, D., Schutte, K., and Walters, A. (2003), Irrigated Vegetating Assessments for Urban Environments, Photogrammetric Engineering and Remote Sensing, Vol. 69, No. 4, pp. 381-390.
Yang, B. Y. (2011), A GIScience Framework for Sustainable Development, Tourism and Management of Coastal Barrier Islands in Georgia, Dissertation, University of Georgia, Athens, GA.
Yang, B. Y., Madden, M., Jordan, T.R., and Kim, J. (2012a), Geospatial Analysis of Barrier Island Beach Availability, Tourism Management, Vol. 33, No. 4, pp. 840-854.
Yang, B. Y., Madden, M., Jordan, T.R., and Cordell, K.H.
(2012b), Geospatial Methods for Demarcating Barrier Islands, Ocean & Coastal Management, Vol. 55, No. 1, pp. 42-51.
Yu, K. B. (2009), Coastal zone management in the United States of America, Journal of the Korean Geographical Society, Vol.
44, No. 4, pp. 481-496.
Zhang, K., and Leatherman, S. (2011), Barrier island population along the U.S. Atlantic and Gulf Coasts, Journal of Coastal Research, Vol. 27, No. 2, pp. 356-63.
(접수일 2012. 04. 09, 심사일 2012. 04. 14, 심사완료일 2012. 04. 24)