1. INTRODUCTION
Renewable alternatives to petroleum-based fuel are of increasing interest in research and development. Bioethanol produced from corn grain is the most widely used renewable trans-
portation fuel, although there has been consid- erable debate regarding the effect of bioethanol production on the food supply (Hill et al., 2006). The annual worldwide production of lignocellulosic biomass has been estimated to be 1 × 10
10MT (Sanchez and Cardona, 2008).
1 Date Received March 25, 2015, Date Accepted May 13, 2015
2 Department of Forest Biomaterials, North Carolina State University, Raleigh, NC 27695, USA
3 Department of Forest Sciences, College of Agriculture and Life Sciences, Seoul National University, Seoul 151-921, Republic of Korea
4 Research Institute for Agriculture and Life Sciences, College of Agriculture and Life Sciences, Seoul National University, Seoul 151-921, Republic of Korea
† Corresponding author: In-Gyu Choi (e-mail: [email protected])
Optimization of The Organosolv Pretreatment of Yellow Poplar for Bioethanol Production by Response Surface Methodology
1Ho-Yong Kim
2⋅Chang-Young Hong
3⋅Seon-Hong Kim
3⋅Hwanmyeong Yeo
3,4⋅In-Gyu Choi
3,4,†ABSTRACT
We investigated the optimization of the organosolv pretreatment of yellow poplar for bioethanol production.
Response surface methodology was used to determine the optimal conditions of three independent variables (reaction temperature, reaction time, and sulfuric acid (SA) concentration). Reaction temperature is the most significant variable in the degradation of xylan and lignin in the presence of an acid catalyst, and ethanol production increased with a decrease in the lignin content. The highest ethanol concentration (42.80 g/ℓ) and theoretical ethanol yield (98.76%) were obtained at 152℃ (2.5 bar) with 1.6% SA for 16 min. However, because of excessive degradation of the raw material, the overall ethanol yield was less than under other pretreatment conditions which has approximately 50% of WIS recovery rate after pretreatment. The optimal conditions for the maximum overall ethanol yield (146℃ with 1.22% SA for 15.9 min) were determined with a predicted yield of 17.11%, and the experimental values were very close (17.15%). Therefore, the quadratic model is reliable.
Keywords : organosolv pretreatment, yellow poplar, overall ethanol yield, simultaneous saccharification and fermentation, response surface methodology
Conversion of lignocellulosic biomass to etha- nol is a reliable alternative to corn-based etha- nol with diminishing net energy balance and dramatic decreases in GHG emissions (Farrell et al., 2006; Halvorsen et al., 2009). However, pretreatment is required in the bioconversion processes to increase yields and reduce costs (Saddler et al., 1993).
Thus, various pretreatment processes have been developed to enhance lignocellulosic bio- ethanol conversion (Cara et al., 2008; Wyman et al., 2005; Alvira et al., 2010). Organosolv pretreatment is a promising method to enhance the recovery of glucose by improving the di- gestibility of high-lignin lignocellulosic biomass (Chum et al., 1990; Koo et al., 2011; Park et al., 2010). Organosolv pretreatment makes cel- lulose more accessible to enzymes by extracting lignin from biomass (Holtzapple and Humphrey, 1984). In addition, organosolv lignin extracted by the organosolv pretreatment process has high purity and valuable applications (Koo et al., 2011; Domínguez et al., 2008; El Hage et al., 2010). Organosolv pretreatment is commonly performed with low boiling point organic sol- vent (ethanol, methanol) and a catalyst that is an inorganic acid or base (hydrochloric acid, sulfuric acid, sodium hydroxide) (Koo et al., 2011; Zhao et al., 2009). Several organosolv pretreatment studies have examined various lignocellulosic biomasses, such as poplar, Miscanthus and wheat straw (Koo et al., 2011;
Park et al., 2010; El Hage et al., 2010; Sidiras and Koukios, 2004). However, previous or- ganosolv pretreatment studies are limited by
insufficient optimization of conditions.
The optimization of pretreatment conditions is one of the most important stages for ex- perimental scale-up and industrial applications (Kim et al., 2010; Perez et al., 2008). Response surface methodology (RSM) is an effective op- timization tool that maps response surfaces over regions of interest. Among RSMs, central com- posite design (CCD) is well suited for fitting a quadratic surface and typically works well for process optimization. A CCD with three factors requires 17 runs with a center point of 3 replicates. For these reasons, RSM and CCD have been successfully applied to biomass pretreatment (Kim et al., 2010; Goh et al., 2011;
Maache-Rezzoug et al., 2011; Kim et al., 2013).
The main purpose of this experiment was to determine the optimal conditions to produce maximum lignocellulosic bioethanol by orga- nosolv pretreatment and simultaneous saccha- rification and fermentation from yellow poplar.
For this purpose, RSM based on three variables (reaction temperature, reaction time, acid con- centration) and CCD were adopted to determine optimal pretreatment conditions by measuring the water-insoluble solid recovery rate and ethanol concentration. Fundamental analyses of the solid fraction were performed after pretreat- ment to support condition optimization.
2. MATERIALS and METHODS 2.1. Raw materials
Twenty year-old yellow poplar (Liriodendron
tulipifera) stems grown in Hwaseong-si, Gyeong-ki do, South Korea, were provided by the Korea Forest Research Institute. Raw materials were milled and screened to less than 0.5 mm using a Cutting Mill pulverisette 15 (FRITSCH GmbH, Germany) and stored in plastic bags at 4 ℃ (less than 10% the initial moisture content).
2.2. Organosolv pretreatment
Pretreatment was conducted in a 1 ℓ reactor (Bolted Closure Vessels, Hanwoul Engineering Co. Ltd., Korea) made of stainless steel (SUS
316) and containing an inner thermocouple to control and measure the internal temperature.
The reactor was loaded with 25 g of wood powder and 500 m ℓ of a 50 : 50% ethanol : water mixture (v/v) containing sulfuric acid at concentrations from 0 to 2% (w/w) as an acid catalyst. The reaction temperature was electri- cally controlled from 120 ℃ to 160℃ by an ex- ternal controller. The reactor was preheated to the reaction temperature for 25 min to 35 min and the reaction time (0 min to 20 min) and pressure (from 0.5 to 3 bar) were monitored when the desired temperature was achieved.
After pretreatment, the reactor was placed in an
Std Variables Code levels
Temperature (℃)
Reaction time (min)
Acid concentration
(%) Temperature Reaction time Acid concentration
x1 x2 x3 x1 x2 x3
1 128 4 0.4 - 1 - 1 - 1
2 152 4 0.4 1 - 1 - 1
3 128 16 0.4 - 1 1 - 1
4 152 16 0.4 1 1 - 1
5 128 4 1.6 - 1 - 1 1
6 152 4 1.6 1 - 1 1
7 128 16 1.6 - 1 1 1
8 152 16 1.6 1 1 1
9 120 10 1 - 1.68 0 0
10 160 10 1 1.68 0 0
11 140 0 1 0 - 1.68 0
12 140 20 1 0 1.68 0
13 140 10 0 0 0 - 1.68
14 140 10 2 0 0 1.68
15 140 10 1 0 0 0
16 140 10 1 0 0 0
17 140 10 1 0 0 0
Table 1. Central composite design varying on three factors: Pretreatment temperature, reaction time and sulfuric acid (SA) concentration
ice chamber to cool to below room temperature within 20 min. Pretreated mixtures were washed with a double volume of distilled water to remove degraded products and solvents (Holtzapple and Humphrey, 1984), and divided into the solid fraction (pretreated biomass) and liquid fraction (aqueous-organosoluble fraction) by filtration using Advantec No. 2 filter paper (Toyo Roshi Kaisha Ltd., Japan). The water- insoluble solid (WIS) recovery rate (Table 2) was measured based on the filtered WIS weight after pretreatment or the simultaneous saccharification and fermentation (SSF) process.
The degraded components (%) from the solid
fraction during pretreatment were calculated by Eq. (1) and are presented in Table. 2.
Degraded components (%) =
(1)
2.3. Simultaneous saccharification and fermentation
SSF was performed to evaluate the efficiency of organosolv pretreatment (Lee et al., 2008).
Cellulase (NS-50013, enzyme loading of 30
Std Composition of solid fraction after pretreatment (%) Composition of liquid fraction after SSF process (72h) Glucana
(%)
Xylana (%)
K. lignina (%)
A.S.L.
(%) WIS recovery (%)
Glucose (g/ℓ)
Xylose (g/ℓ)
Ethanol (g/ℓ)
Y1b
(%) Y2c
(%)
WIS recovery (%) 1 44.47 (11.06) 17.12 (10.90) 19.86 (34.14) 3.45 79.16 0.015 0.288 6.67 29.41 5.28 83.05
2 71.64 (7.86) 7.69 (74.27) 10.93 (76.68) 1.67 50.90 - 0.492 32.33 88.48 16.46 21.06
3 47.08 (14.40) 12.54 (40.68) 18.71 (43.59) 3.01 71.95 - 0.512 9.69 40.35 6.97 71.36
4 80.42 (11.12) 5.44 (84.35) 8.14 (85.09) 1.24 43.74 - 0.324 37.27 90.88 16.30 13.42
5 55.94 (4.06) 12.09 (46.04) 19.10 (45.67) 2.67 67.88 - 0.470 11.64 40.80 7.90 61.88
6 84.14 (11.24) 4.03 (88.92) 7.99 (86.03) 1.07 41.75 - 0.245 38.85 90.54 16.22 11.37
7 68.64 (4.88) 8.33 (69.97) 14.02 (67.79) 2.00 54.85 - 0.473 27.48 78.50 15.07 34.18
8 84.98 (20.57) 2.19 (94.66) 6.87 (89.35) 0.85 37.00 - 0.123 42.80 98.76 15.84 11.82
9 47.57 (10.16) 14.36 (29.42) 23.68 (25.86) 2.53 74.74 - 0.426 7.77 32.02 5.81 75.46
10 90.40 (10.91) 1.98 (94.91) 5.60 (90.86) 0.87 39.01 - 0.094 38.71 83.96 15.10 10.10
11 62.66 (6.40) 9.55 (62.86) 15.54 (61.52) 3.08 59.12 - 0.520 19.73 61.74 11.67 44.31
12 81.42 (7.65) 6.31 (81.38) 8.77 (83.50) 1.52 44.89 - 0.340 36.63 88.21 16.44 14.27
13 40.91 (-0.36) 15.21 (2.89) 26.12 (-6.27) 2.63 97.11 - 0.130 9.07 43.48 8.81 84.33
14 86.27 (13.82) 1.75 (95.46) 10.53 (82.57) 0.82 39.54 - 0.081 38.37 87.21 15.17 11.92
15 72.39 (7.65) 6.90 (77.09) 11.83 (74.97) 1.67 50.49 - 0.455 30.92 83.75 15.61 19.94
16 73.91 (9.61) 6.53 (79.21) 11.40 (76.89) 1.62 48.41 - 0.361 32.20 85.42 15.59 18.97
17 72.19 (9.25) 7.23 (76.33) 10.68 (77.74) 1.79 49.76 - 0.463 32.18 87.41 16.01 22.46
Control 39.58 15.21 23.87 2.99 - - 0.136 2.36 11.69 2.24 86.12
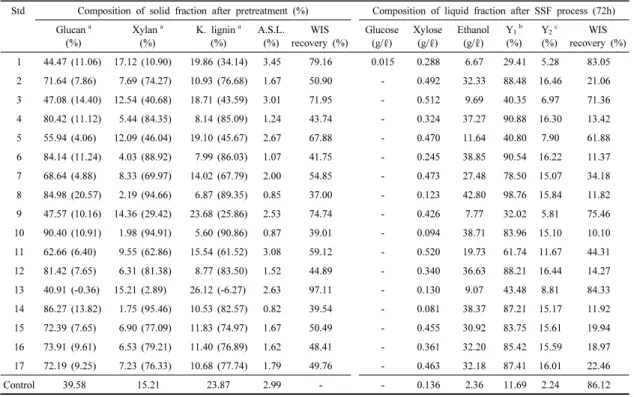
a Percentage of degraded rate of components after pretreatment was calculated followed by Eq. (1).
b Theoretical ethanol yield based on the glucose content of pretreated solid fraction was calculated followed by Eq. (2).
c Overall ethanol yield based on initial input measured by WIS recovery rate after pretreatment and concentration of produced ethanol was cal- culated followed by Eq. (4).
Table 2. Composition analysis of pretreated solid fraction and liquid fraction after SSF process
Filter Paper Units (FPU)/g substrate), ß-gluco- sidase (NS-50010, 0.3 times the NS-50013 in- put amount), and Saccharomyces cerevisiae (ATTC
®26603, 1 g/ ℓ) were used for the SSF procedure. Both NS-50013 and NS-50010 were kindly provided by Novozyme Korea Ltd. A total of 5 g of solid fraction was placed in a 50 m ℓ working volume including enzymes, yeast, and trace elements (0.1 m ℓ/g substrate) and 50 mM acetate buffer in a 250 m ℓ Erlenmeyer flask. Incubation was performed in a shaking incubator at 30 ℃, 150 rpm for 72 h.
2.4. Statistical approach
Analyses were conducted to determine the optimal conditions of organosolv pretreatment to produce the highest bioethanol yield by the SSF process. Three independent variables, reaction temperature (x
1, ℃), reaction time (x
2, min) and sulfuric acid (SA) concentration (x
3,
% (w/w)) based on 2
3full factorial CCD for RSM were performed using Design Expert 8.0.6 software (Stat-Ease, Inc., MN, USA).
Theoretical ethanol yield (Y
1, %) and overall ethanol yield (Y
2, %) were the dependent variables. Fifteen conditions composed of six axial points are listed in Table 1, and tripli- cation was performed at the central point (140 ℃, 10 min, 1% (w/w)).
2.5. Analytical methods
Carbohydrate compositions of raw material and solid fractions after pretreatment were
measured in accordance with the National Renewable Energy Laboratory Chemical Analysis and Testing Standard (Sluiter et al., 2004). The amounts of glucose, xylose, and ethanol were analyzed by high performance liquid chromatography (LC 1100, Agilent, USA) at 40 ℃ with 50 mM H
2SO
4as the eluent at a flow rate of 0.5 m ℓ/min and an injection volume of 10 µ ℓ. An Aminex HPX-87H col- umn (300 mm × 7.8 mm, 5 µm) was used for determining the glucose, xylose, and ethanol concentrations. A refractive index detector (LC 1100, Agilent, USA) was used to quantify the products.
3. RESULTS and DISCUSSION 3.1. Effects of independent variables on
chemical composition
Glucan, xylan, Klason lignin and acid soluble
lignin content of the solid fractions for all
treatment combinations are presented in Table
2. Organosolv pretreatment with SA degraded
much more than xylan and lignin, and therefore
glucan content was relatively increased. All of
the independent variables caused degradation of
the raw materials. However, higher reaction
temperature greatly increased the degradation of
xylan and lignin. Run #10, pretreatment at 160 ℃
with 1% SA for 10 min, degraded more than
90% of the xylan and Klason lignin with only
10% glucan degradation. Alternatively, Run #8,
pretreatment at 152 ℃ with 1.6% SA for 16
min, degraded the most glucan (20.57%) with
94.66% and 89.35% degradation of xylan and Klason lignin, respectively. Additionally, Run
#13, pretreatment at 140 ℃ without SA for 10 min, did not degrade the raw materials. This suggests that in organosolv pretreatment, re- action temperature is the most significant varia- ble to degrade xylan and lignin under the pres- ence of an acid catalyst. Although SA was not introduced in Run #13, higher reaction temper- ature and acetic acid auto-generated by acetyl group might be resulting slightly higher ethanol yield compared to Run #3, #5, and #9. The WIS recovery rate ranged from 37.00% to 97.11% based on treatment combinations (Table 2). The WIS recovery rate was significantly affected by the reaction temperature, followed by the SA concentration and reaction time.
Compared to a recent study reporting 78.3%
solid recovery for organosolv pretreatment with 1% SA of yellow poplar at 120 ℃, and 60.7%
at 140 ℃ (Koo et al., 2011), a lower WIS re- covery rate was obtained with higher lignin degradation. A higher WIS recovery rate was obtained using organosolv pretreatment with alkali catalyst to reduce lignin degradation compared to pretreatment with an acid catalyst (Koo et al., 2011), illustrating the dependence of the process on the choice of catalyst.
Delignification in the organosolv pretreatment is not the major factor enhancing enzymatic hydrolysis (Teramoto et al., 2008). However, in this study ethanol production increased with the decrease in the lignin content of the solid frac- tion after pretreatment, and further study was required to reveal the action of the remaining
lignin in enzymatic hydrolysis or fermentation.
3.2. Response surface methodology for theoretical ethanol yield
The ethanol concentrations obtained after the SSF process are presented in Table 2. Most of the hydrolyzed glucose was converted to ethanol after 72 h. As expected, ethanol concentration was significantly affected by the treatment conditions and increased with the decrease in lignin content and WIS recovery rate after pretreatment. Run #8, pretreatment at 152 ℃ with 1.6% SA for 16 min, produced the most ethanol (42.80 g/ ℓ) compared to 2.36 g/ℓ ethanol from the control. Ethanol concentration was significantly enhanced by acid catalyst (Koo et al., 2011) compared to ethanol produced from yellow poplar by organosolv pretreatment with an alkali catalyst (29.9 g/ ℓ, 140 ℃ with 1 % sodium hydroxide for 10 min).
To confirm the efficiency of the pretreatment and SSF process, the theoretical ethanol yield based on the glucose content in a pretreated solid fraction (Y
1) was calculated with Eq. (2):
(2)
where Conc
ethanolis the concentration of pro-
duced ethanol (g/ ℓ), G is the glucan amount
in the pretreated solid fraction, K is the
consistency for SSF (100 g/ ℓ), 180/162 is the
conversion constant for glucan to glucose and
0.51 is the conversion constant for glucose to
ethanol.
A maximum theoretical ethanol yield was 98.76% from Run #8 (152 ℃ with 1.6% SA for 16 min), and greater than 80% theoretical etha- nol yield was obtained from over 140 ℃ re- action temperature. These results corroborate those of a previous investigation in which the enzymatic conversion rate of a pretreated ligno- cellulosic biomass by organosolv pretreatment with an acid catalyst was significantly enhanced by increasing the pretreatment temperature (Zhao et al., 2009).
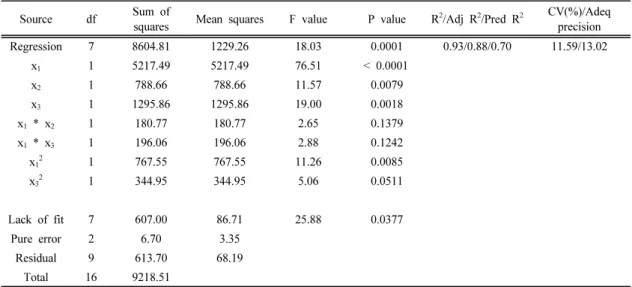
RSM was used to determine the optimal pre- treatment conditions to produce the greatest the- oretical ethanol yield, and the modeling results are presented in Fig. 1 and Eq. (3). In order to visualize the first order interaction effect for theoretical ethanol yield, three dimensional plot and two dimensional contour are shown in Fig.
1a and b. z
1is the predicted theoretical ethanol yield (%) and the analysis of the variance for the fitted model is presented in Table 3.
(3)
This regression model was significant at a 99% confidence level (p = 0.0001), and the P-values of the reaction temperature (p <
0.0001), reaction time (p = 0.0079), and SA concentration (p = 0.0018) were less than 0.01.
Of the independent variables considered, the re- action temperature had a significant influence on the theoretical ethanol yield, followed by SA concentration and reaction time. As observed from Table 3, the reaction temperature, reaction time and SA concentration all had positive in- fluences on ethanol yield. However, interactions between the reaction temperature and reaction time, reaction temperature and SA concen- tration, and quadratic terms of the reaction tem- perature, reaction time and SA concentration had negative influences on the theoretical etha- nol yield, although the interactions were not
Source df Sum of
squares Mean squares F value P value R2/Adj R2/Pred R2 CV(%)/Adeq precision Regression 7 8604.81 1229.26 18.03 0.0001 0.93/0.88/0.70 11.59/13.02
x1 1 5217.49 5217.49 76.51 < 0.0001
x2 1 788.66 788.66 11.57 0.0079
x3 1 1295.86 1295.86 19.00 0.0018 x1 * x2 1 180.77 180.77 2.65 0.1379 x1 * x3 1 196.06 196.06 2.88 0.1242
x12 1 767.55 767.55 11.26 0.0085
x32 1 344.95 344.95 5.06 0.0511
Lack of fit 7 607.00 86.71 25.88 0.0377 Pure error 2 6.70 3.35
Residual 9 613.70 68.19 Total 16 9218.51
Table 3. Analysis of variance for fitted model for theoretical ethanol yield
significant at p < 0.05.
3.3. Response surface methodology for overall ethanol yield
To identify the productivity of ethanol from the organosolv pretreatment and SSF process, the overall ethanol yield based on the initial in- put (Y
2) was calculated using Eq. (4):
(4)
where Conc
ethanolis the concentration of pro- duced ethanol (g/ ℓ), WIS
recoveryis the water in- soluble solid recovery rate (%) and K is the consistency for SSF (100 g/ ℓ).
The maximum overall ethanol yield was 16.46% from Run #2 (152 ℃ with 0.4% SA for 4 min). Additionally, Run #4 (152 ℃ with 0.4
% SA for 16 min) and Run #6 (152 ℃ with 1.6
% SA for 4 min) provided greater than 16%
ethanol yield. The highest theoretical ethanol yield was obtained from Run #8 (152 ℃ with 1.6% SA for 16 min). However, because of the poor WIS recovery rate caused by excessive degradation of the raw material, the overall ethanol yield was slightly less than those of other pretreatment conditions. Previous research producing 13.0% overall yield of bioethanol by concentrated sulfuric acid hydrolysis from glucose of cornstalks was significantly less than that of this study (Demirbas, 2005).
Furthermore, considering the possibility of xylose fermentation, the overall yields of bioethanol by organosolv pretreatment with SA might be greater.
The modeling results for overall ethanol yield are illustrated in Fig. 2 and Eq. (5). The first order interaction effects on the overall ethanol yield are shown in Fig. 2a and b. z
2is the predicted overall ethanol yield (%). ANOVA for the fitted model is presented in Table 4.
(a) (b)
Fig. 1. Effect of independent variables interaction (a: three dimensional plot, b: detailed contour) on theoretical ethanol yield. Reaction time was fixed at 20 min (codded level: - 1.68).
(5)
This regression model (p < 0.0001) and in- dependent variables including reaction temper- ature (p < 0.0001), reaction time (p = 0.0087), and SA concentration (p = 0.0022) were sig-
nificant at a 99% confidence level. Similar to the theoretical ethanol yield, the reaction tem- perature, reaction time and SA concentration had significant influences on overall ethanol yield, whereas interactions between reaction temperature and reaction time, reaction temper- ature and SA concentration, and quadratic terms
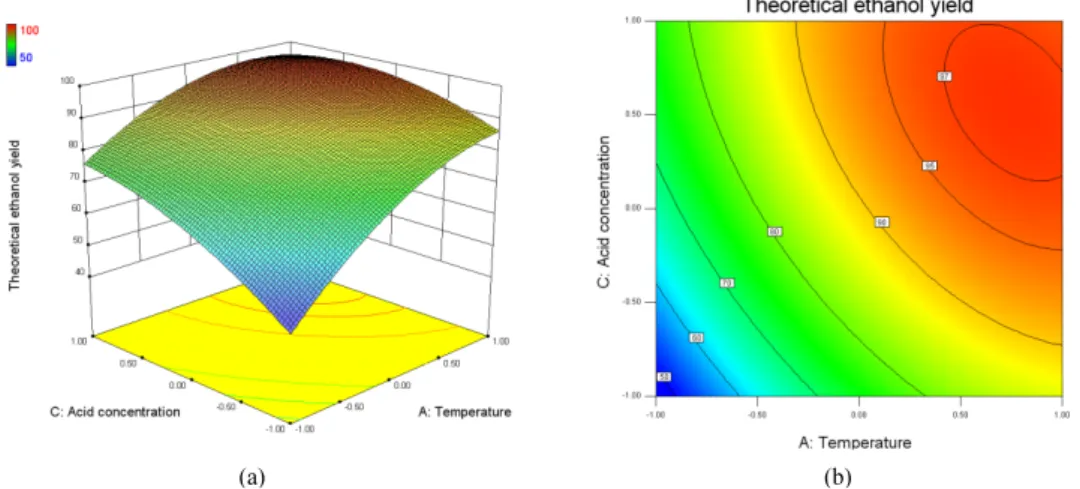
Source df Sum of squares Mean squares F value P value R2/Adj R2/Pred R2 CV(%)/Adeq precision Regression 7 266.22 38.03 21.59 < 0.0001 0.94/0.90/0.76 10.24/14.62
x1 1 149.71 149.71 84.99 < 0.0001
x2 1 19.60 19.60 11.13 0.0087
x3 1 31.41 31.41 17.83 0.0022
x1 * x2 1 11.05 11.05 6.27 0.0336 x1 * x3 1 16.31 16.31 9.26 0.0140
x12 1 31.84 31.84 18.07 0.0021
x32 1 13.92 13.92 7.90 0.0203
Lack of fit 7 15.74 2.25 39.26 0.0251
Pure error 2 0.11 0.06
Residual 9 15.85 1.76
Total 16 282.07
Table 4. Analysis of variance for fitted model for overall ethanol yield
(a) (b)
Fig. 2. Effect of independent variables interaction (a: three dimensional plot, b: detailed contour) on overall ethanol yield. Reaction time was fixed at 20 min (codded level: - 1.68).
of reaction temperature, reaction time and SA concentration had negative influences on overall ethanol yield. Contrary to ANOVA results regarding theoretical ethanol yield, both inter- actions between the reaction temperature and reaction time (p < 0.0336), reaction temperature and SA concentration (p < 0.0140) were stat- istically significant.
The interaction effects of the reaction temper- ature and SA concentration are shown in Fig.
2. At low reaction temperatures, the overall ethanol yield rises sharply with an increase in the SA concentration. However, at high temper- atures, the high SA concentration starts to neg- atively impact ethanol yield due to glucose loss in the pretreatment process because of rapid de- composition at high temperatures under acidic conditions (Teramoto et al., 2008).
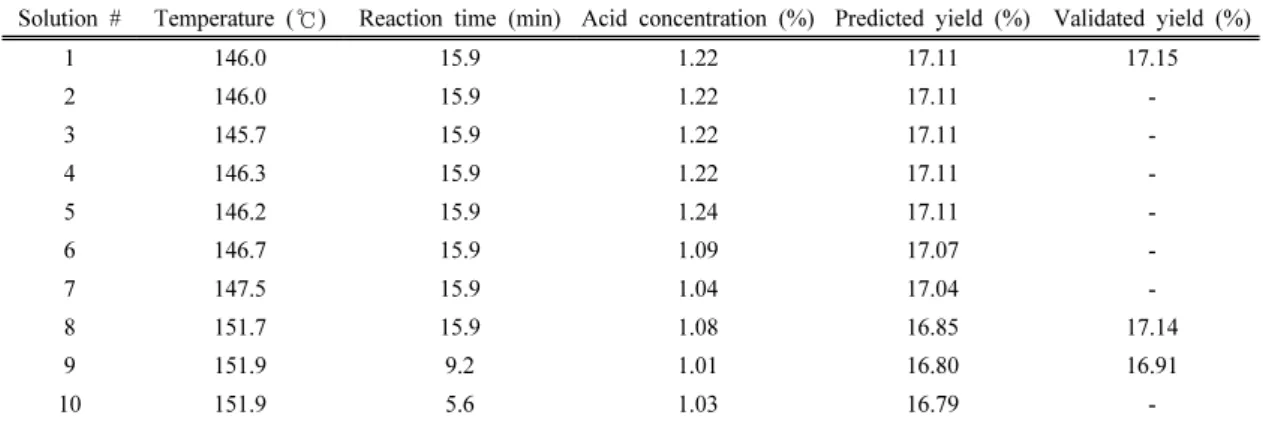
3.4. Optimization and validation
The conditions required for achieving the maximum overall ethanol yield were optimized using the obtained model and input criteria. By
considering each response value, 13 solutions were determined using Design Expert 8.0.6 software (Stat-Ease, Inc., MN, USA), and the top ten solutions are shown in Table 5. The maximum response for the quadratic model was achieved at 146 ℃ with 1.22% SA for 15.9 min, predicting an overall ethanol yield of 17.11%. In order to confirm the predicted re- sults, organosolv pretreatment was performed at three different optimum conditions (solution
#1, 8, and 9). The actual optimum yields of solution #1, #8, and #9 were 17.15%, 17.14%
and 16.91% of the overall ethanol yield, respectively. The experimental values were very close to the predicted values, and the optimal condition was located at the central point with- in the experimental scale. Therefore, the quad- ratic model was found to be reliable.
A mass balance diagram is shown in Fig. 3.
A large quantity of 17.15 g ethanol was pro- duced from 100 g DM yellow poplar because most of the glucose was converted to ethanol.
The large amount of xylose in the liquid hydro- lysates should be used for fermentation after the
Solution # Temperature (℃) Reaction time (min) Acid concentration (%) Predicted yield (%) Validated yield (%)
1 146.0 15.9 1.22 17.11 17.15
2 146.0 15.9 1.22 17.11 -
3 145.7 15.9 1.22 17.11 -
4 146.3 15.9 1.22 17.11 -
5 146.2 15.9 1.24 17.11 -
6 146.7 15.9 1.09 17.07 -
7 147.5 15.9 1.04 17.04 -
8 151.7 15.9 1.08 16.85 17.14
9 151.9 9.2 1.01 16.80 16.91
10 151.9 5.6 1.03 16.79 -
Table 5. Solutions for optimal conditions and validation
detoxification process. Furthermore, the organo- solv lignin dissolved in liquid hydrolysates and the enzymatic hydrolyzed lignin remaining after the SSF are likely to be of large amount with- out remarkable denaturalization, suggesting add- ed value as an additional products that may be used as structural material.
4. CONCLUSION
In organosolv pretreatment, reaction temper- ature has the most influence of all variables on the degradation of xylan and lignin. The highest theoretical ethanol yield (98.76%) was obtained at 152 ℃ with 1.6% SA for 16 min, however the overall ethanol yield was decreased due to low WIS recovery rates. The optimal conditions for maximum overall ethanol yield were de- termined (146 ℃ with 1.22 % SA for 15.9 min) with a predicted yield of 17.11%. The ex- perimental values (17.15%) were very close to the predicted values, and the optimal condition was located at the central point, indicating that the quadratic model was reliable.
ACKNOWLEDGEMENTS
This study was carried out with the support of a
“Forest Science & Technology Projects (Project No.
S120811L140130)” grant provided by the Korea Forest Service and the National Research Foundation of Korea (NRF) Grant funded by the Korean Government (MOE) (NRF-2012R1A1A2008592).
REFERENCES
Alvira, P., Tomas-Pejo, E., Ballesteros, M., Negro, M. 2010. Pretreatment technologies for an effi- cient bioethanol production process based on en- zymatic hydrolysis: A review. Bioresource Technology 101(13): 4851∼4861.
Cara, C., Ruiz, E., Oliva, J., Saez, F., Castro, E.
2008. Conversion of olive tree biomass into fermentable sugars by dilute acid pretreatment and enzymatic saccharification. Bioresource Technology 99(6): 1869∼1876.
Chum, H.L., Johnson, D.K., Black, S.K. 1990.
Organosolv pretreatment for enzymic hydrolysis of poplars. 2. Catalyst effects and the combined severity parameter. Industrial & Engineering Chemistry Research 29(2): 156∼162.
Demirbas, A. 2005. Bioethanol from cellulosic mate- rials: A renewable motor fuel from biomass.
Energy Sources 27(4): 327∼338.
Fig. 3. Mass balance diagram of organosolv pretreatment followed by SSF process.
Domínguez, J., Oliet, M., Alonso, M., Gilarranz, M., Rodríguez, F. 2008. Thermal stability and py- rolysis kinetics of organosolv lignins obtained from Eucalyptus globulus. Industrial Crops and Products 27(2): 150∼156.
El Hage, R., Brosse, N., Sannigrahi, P., Ragauskas, A. 2010. Effects of process severity on the chemical structure of Miscanthus ethanol organo- solv lignin. Polymer Degradation and Stability 95(6): 997∼1003.
El Hage, R., Chrusciel, L., Desharnais, L., Brosse, N. 2010. Effect of autohydrolysis of Miscanthus x giganteus on lignin structure and organosolv delignification. Bioresource Technology 101(23):
9321∼9329.
Farrell, A.E., Plevin, R.J., Turner, B.T., Jones, A.D., O'hare, M., Kammen, D.M. 2006. Ethanol can contribute to energy and environmental goals.
Science 311(5760): 506∼508.
Goh, C.S., Tan, H.T., Lee, K.T., Brosse, N. 2011.
Evaluation and optimization of organosolv pre- treatment using combined severity factors and response surface methodology. Biomass &
Bioenergy 35(9): 4025∼4033.
Halvorsen, K.E., Barnes, J.R., Solomon, B.D. 2009.
Upper midwestern USA ethanol potential from cellulosic materials. Society and Natural Resources 22(10): 931∼938.
Hill, J., Nelson, E., Tilman, D., Polasky, S., Tiffany, D. 2006. Environmental, economic, and energetic costs and benefits of biodiesel and ethanol biofuels. Proc. Natl. Acad. Sci. U. S. A.
103(30): 11206∼11210.
Holtzapple, M., Humphrey, A. 1984. The effect of organosolv pretreatment on the enzymatic hy- drolysis of poplar. Biotechnology and Bioengineering 26(7): 670∼676.
Kim, H., Lee, J., Jeffries, T., Choi, I. 2010.
Response surface optimization of oxalic acid
pretreatment of yellow poplar (Liriodendron tuli- pifera) for production of glucose and xylose monosaccarides. Bioresource Technology 102(2):
1440∼1446.
Kim, Y.H., Na, B.I., Lee, S.M., Lee, H.W., Lee, J.W. 2013. Optimal Condition for Torrefaction of Eucalyptus by Response Surface Methodology. J. Korean Wood Sci. & Tech 41(6): 497∼506.
Koo, B.W., Kim, H.Y., Park, N., Lee, S.M., Yeo, H., Choi, I.G. 2011. Organosolv pretreatment of Liriodendron tulipifera and simultaneous saccha- rification and fermentation for bioethanol production. Biomass & Bioenergy 35(5): 1833∼ 1840.
Koo, B.-W., Park, N., Jeong, H.-S., Choi, J.-W., Yeo, H., Choi, I.-G. 2011. Characterization of by-products from organosolv pretreatments of yellow poplar wood (Liriodendron tulipifera) in the presence of acid and alkali catalysts. Journal of Industrial and Engineering Chemistry 17(1):
18∼24.
Lee, J.W., Kim, H.Y., Koo, B.W., Choi, D.H., Kwon, M., Choi, I.G. 2008. Enzymatic saccha- rification of biologically pretreated Pinus densi- flora using enzymes from brown rot fungi.
Journal of Bioscience and Bioengineering 106(2): 162∼167.
Maache-Rezzoug, Z., Pierre, G., Nouviaire, A., Maugard, T., Rezzoug, S. 2011. Optimizing ther- momechanical pretreatment conditions to en- hance enzymatic hydrolysis of wheat straw by response surface methodology. Biomass &
Bioenergy 35(7): 3129∼3128.
Park, N., Kim, H., Koo, B., Yeo, H., Choi, I. 2010.
Organosolv pretreatment with various catalysts for enhancing enzymatic hydrolysis of pitch pine (Pinus rigida). Bioresource Technology 101(18):
7046∼7053.
Perez, J., Ballesteros, I., Ballesteros, M., Saez, F., Negro, M., Manzanares, P. 2008. Optimizing liq- uid hot water pretreatment conditions to enhance sugar recovery from wheat straw for fuel-ethanol production. Fuel 87(17-18): 3640∼3647.
Saddler, J.N., Ramos, L.P., Breuil, C. 1993.
Bioconversion of Forest and Agricultural Plant Wastes. CAB International, London, UK.
Sanchez, O., Cardona, C. 2008. Trends in bio- technological production of fuel ethanol from different feedstocks. Bioresource Technology 99(13): 5270∼5295.
Sidiras, D., Koukios, E. 2004. Simulation of acid-catalysed organosolv fractionation of wheat straw. Bioresource Technology 94(1): 91∼98.
Sluiter, A., Hames, B., Ruiz, R., Scarlata, C., Sluiter, J., Templeton, D., Crocker, D. 2004.
Determination of structural carbohydrates and lignin in biomass. National Renewable Energy Laboratory, Golden, CO.
Teramoto, Y., Lee, S.H., Endo, T. 2008.
Pretreatment of woody and herbaceous biomass for enzymatic saccharification using sulfuric acid-free ethanol cooking. Bioresource Technology 99(18): 8856∼8863.
Teramoto, Y., Tanaka, N., Lee, S.H., Endo, T. 2008.
Pretreatment of eucalyptus wood chips for enzy- matic saccharification using combined sulfuric acid free ethanol cooking and ball milling.
Biotechnology and Bioengineering 99(1): 75∼ 85.
Wyman, C.E., Dale, B.E., Elander, R.T., Holtzapple, M., Ladisch, M.R., Lee, Y.Y. 2005. Coordinated development of leading biomass pretreatment technologies. Bioresource Technology 96(18):
1959∼1966.
Zhao, X., Cheng, K., Liu, D. 2009. Organosolv pretreatment of lignocellulosic biomass for enzy- matic hydrolysis. Applied Microbiology and Biotechnology 82(5): 815∼827.