1. 서 론
대기 중 PM2.5는 폐기능 저하, 심혈관계 질환 유발
등과 같은 인체 유해성, 직∙간접적인 빛의 산란, 흡 수로 인한 시정 저하 및 기후 변화에의 영향 등 인 간 삶의 질에 악영향을 미치는 것으로 알려져 있다 (WHO, 2006; U.S. EPA, 1997). 이런 영향을 고려해 대부분의 선진국에서는 이미 PM2.5의 대기환경기준 을 설정, 규제하고 있다. 미국은 1997년도에 PM2.5환 J. KOSAE Vol. 28, No. 2 (2012) pp. 211~221
Journal of Korean Society for Atmospheric Environment DOI: http://dx.doi.org/10.5572/KOSAE.2012.28.2.211
국내 배출원별 PM
2.5배출량 산정 및 배출 기여도 분석 The Estimation of PM
2.5Emissions and Their Contribution
Analysis by Source Categories in Korea
진형아*∙이주형1)∙이경미∙이향경∙김보은∙이동원∙홍유덕 국립환경과학원 기후대기연구부 기후변화연구과, 1)교통안전공단 (2011년 11월 15일 접수, 2011년 12월 14일 수정, 2012년 3월 9일 채택)
Hyung-Ah Jin*, Ju-Hyoung Lee1), Kyung-Mi Lee, Hyang-Kyeong Lee, Bo-Eun Kim, Dong-Won Lee and Youdeog Hong
Climate Change Research Division, Climate and Atmospheric Research Department, National Institute of Environmental Research
1)Korea Transportation Safety Authority
(Received 15 November 2011, revised 14 December 2011, accepted 9 March 2012)
Abstract
The Ministry of Environment will enforce air quality standards for PM2.5in 2015 because it affects human health as well as climate change and brings about other adverse effects. Until recently, even though a number of researches have reported PM2.5emissions according to sources, they have not precisely considered the emission factors corre- spondent to each source for emission estimation. For the sake of establishing PM2.5emission inventories, this study was undertaken using activity data of each source taken from CAPSS (Clean Air Policy Support System) multiplied by each emission factor of U.S. EPA Speciate or EEA CORINAIR.
The 2008’s total annual PM2.5emission (73.971 ton/yr) can be apportioned into five sources, such as fuel combustion facilities (62.2%), mobiles (33.8%), production processes (3.2%), fires (0.4%), and waste treatments (0.3%). The results show that fuel combustion facilities and mobiles are the predominant sources of PM2.5, and they should be taken into great account in establishing PM2.5standards. In addition, it is necessary and urgent to develop effective measures for reduction of PM2.5emissions from those two main sources as well.
Key words : PM2.5, PM2.5emission inventory, CAPSS
*Corresponding author.
Tel : +82-(0)32-560-7319, E-mail : [email protected]
경기준(일 65μg/m3, 연 15 μg/m3)을 신설, 2006년에 일 기준을 35μg/m3로 강화한 바 있다. 유럽 역시 대 기질을 개선하기 위한 환경프로그램을 통해 PM2.5의 농도를 2020년까지 현재 수준보다 75% 낮출 것을 제 안함과 동시에 연 25μg/m3를 2011년 1월 1일까지의 목표기준으로 설정하였다 (Jang et al., 2009a). 일본도 미국과 같은 수준의 대기환경기준을 마련하여 시행 중에 있으며, 캐나다 (일 30μg/m3)와 호주 (일 25μg/m3, 연 8μg/m3)는 이보다 더 높은 기준을 시행하고 있다.
WHO도 인체에 위해를 줄 수 있는 농도의 불확실성 을 이유로 그간 설정되지 않았던 PM10과 PM2.5에 대 한 24시간 평균, 연평균 농도에 대한 권고기준을 추 가하였다 (WHO, 2006). 이에 따라 환경부도 PM2.5대 기환경기준 (일 50μg/m3, 연 25 μg/m3)을 신설, 2015 년 시행 예정으로 있다 (환경부, 2011).
대기 중 PM2.5농도는 측정망이 전국적으로 구축 단계라 현재로선 추세를 파악하긴 어렵지만 연구보 고서에 나타난 주요 도시의 농도는 미국, 유럽보다 1.7~2.3배 높으며 지역적으로 수도권, 계절적으로 겨 울철이 높은 특징을 나타내고 있어 지역에 따라 일 시적 고농도 노출에 대한 특별한 관리가 필요할 것 으로 보인다 (Ahn et al., 2009).
PM2.5의 국내 배출량을 산정하고 기여율을 파악하 기 위한 연구는 기존에 있었다 (장영기 등, 2009a, b).
이 연구는 대기정책지원시스템(Clean Air Policy Sup- port System, 이하 CAPSS)에서 누락된 배출원을 추
가하여 신뢰도를 높인 측면은 있으나 도로재비산, 축 산활동, 생물성 연소 등 일부 배출원만 PM2.5배출계 수를 적용하여 배출량을 산정하였을 뿐 배출 기여율 이 높은 연료 연소, 이동 오염원 부문은 PM10중 PM2.5분율을 일괄적으로 90%로 적용하는 등 배출계 수를 적용하는 데 있어 다양한 배출원의 특성을 반 영하지 못했다.
연료 연소, 자동차 등 인간의 활동에 의해 주로 배 출되는 PM2.5의 배출원별 배출량을 정확히 산정, 기 여율을 파악하는 것은 향후 시행될 대기환경기준 달 성을 위한 효과적인 저감 대책 수립을 위해 중요한 일이라 사료된다.
본 연구에서는 국립환경과학원 CAPSS에 구축된 자료를 이용하여, 배출원별 PM2.5배출량 및 기여율 을 산정하였고, 대기환경기준 설정에 따른 대기환경 규제 정책을 세우는 기초 자료를 제공하고자 한다.
2. 배출목록 구축 및 산정방법
2. 1 배출원 분류 체계
배출목록은 배출원을 규명하고 배출원별 배출량을 산정하여 총 배출량을 목록화한 것으로 대기 중 PM2.5
저감 정책 수립 시 가장 기초적이고 핵심적인 자료 이다.
국립환경과학원은 대기오염물질 배출원별 기여도
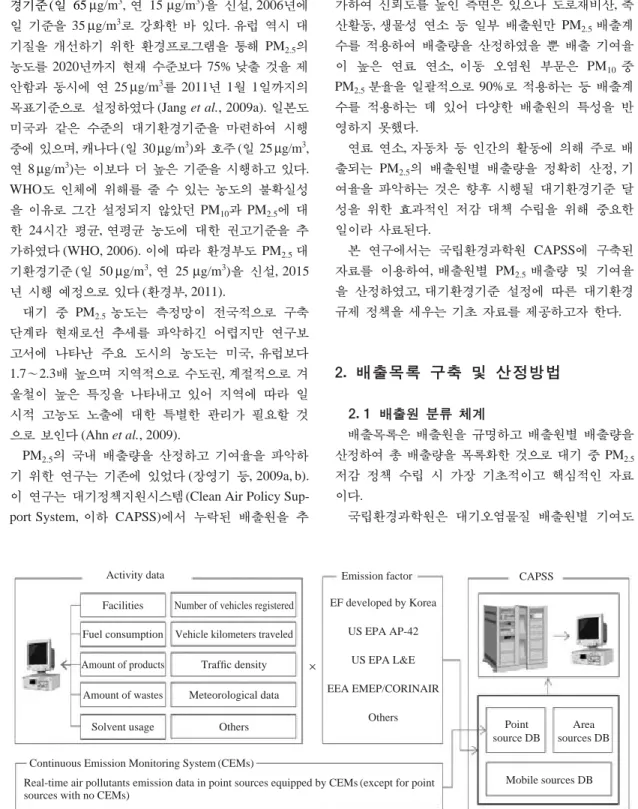
Fig. 1. Flow diagram outline for estimating air pollutants emission of CAPSS.
Facilities
Fuel consumption
Amount of products
Amount of wastes
Solvent usage
Emission factor CAPSS
Mobile sources DB Point
source DB
Area sources DB EF developed by Korea
US EPA AP-42
US EPA L&E
EEA EMEP/CORINAIR
Others Number of vehicles registered
Vehicle kilometers traveled
Traffic density
Meteorological data
Others Activity data
Continuous Emission Monitoring System (CEMs)
×
Real-time air pollutants emission data in point sources equipped by CEMs (except for point sources with no CEMs)
를 파악하고 대기정책에 따른 대기질 개선 효과를 파 악하기 위하여 CAPSS를 개발∙구축하였으며, 1999 년부터 TSP (PM10포함), NOx, SOx, VOC, CO, NH3 배출량을 매년 산정해 오고 있다 (그림 1). CAPSS는 국내 산업분류체계와 유럽의 CORINAIR 분류체계를 혼용한 배출원 분류체계를 구축하고 있으며 본 연구 에서는 CAPSS 분류체계에 따라 PM2.5배출량을 산 정하고자 한다(국립환경과학원, 2010a, b, c, e).
CAPSS 배출목록에 따르면 연료 연소, 생산 공정, 이동 오염원, 폐기물 처리, 산불 및 화재 부문으로 크 게 구분된다. 연료 연소 부문은 에너지산업 연소, 비 산업 연소 및 제조업 연소로, 생산 공정 부문은 석유 산업 공정, 제철제강 공정, 무기화학제품제조 공정 및 기타 공정으로, 이동 오염원은 자동차, 철도, 선박, 항 공, 농기계 및 건설장비 등으로 분류하였다. 그 외 생 활 및 사업장 폐기물 소각, 산불 및 일반 화재 발생 으로 인해 PM2.5가 배출되므로 이를 추가하였다. 그 러나 이번 연구에서는 CAPSS 내 비산먼지와 생물성 연소 배출목록은 미 구축되어 PM2.5배출량 산정에 포함시키지 못하였다.
2. 2 활동도 자료
2. 2. 1 점∙면 오염원
본 연구에서 점 오염원의 PM2.5배출량 산정을 위 해 그림 1과 같이 사업장별 월별 연료 사용량 및 제 품생산량, 폐기물 소각 처리량, 방지시설(Air Pollution Collection Devices, APCDs) 정보, 굴뚝 정보 등의 사 업장 자료가 구축된 배출업소 자료수집프로그램 (Source Data Collection, 이하 SODAC)을 활용하였으 며, 동시에 실시간 배출량 자료 입수가 가능한 굴뚝 원격감시시스템(이하 CleanSYS) 부착 사업장을 대 상으로 CAPSS와 연계하였다(Jang et al., 2009).
면 오염원의 PM2.5배출량 산정을 위해서는 점 오 염원에서 소비되는 활동도를 제외한 한국석유공사의 석유류 수급 자료(석유 및 LPG), 대한석탄협회 및 에너지통계연보의 석탄 소비량 자료, 도시가스공급사 의 LNG 공급량 자료, 광공업생산연보의 제품생산량 자료 등을 입수하여 CAPSS에 구축하였다. 그 외 폐 기물 소각 처리량은 환경관리공단 자료(일부 사업장 은 SODAC 자료 참고), 산불면적은 산림청 자료, 화 재건수는 소방방재청 국가화재정보시스템 자료 등을
참고하였다.
2. 2. 2 이동 오염원
본 연구의 도로 부문은 경유 차량만을 대상으로 하여 PM2.5배출량을 산정하였으며, 그림 1에서 보는 바와 같이 CAPSS는 자동차 등록대수와 주행거리 (Vehicle kilometers traveled, VKT)를 활동도로 이용 하였다. 국토해양부 및 한국자동차공업협회(KAMA) 의 자동차등록대수 통계자료, 교통안전공단의 시도별 차종별 VKT 통계자료, 국토해양부 및 한국도로공사의 도로구간별 교통량 자료와 기상청 기상자료 등을 이 용하였다. 또한, 경유 자동차의 저감장치에 따른 기여 율을 반영하고자 환경관리공단으로부터 수도권 DPF,
PDPF, DOC 부착대수 현황을 입수하여 각각 평균 DPF
83.6%, PDPF 56.0%, DOC 35.0%의 PM2.5저감효율을 적용하였다(Kang et al., 2007).
비도로 부문의 철도는 한국철도공사로부터 기관차 종별 연료소비량, 철도구간정보, 운행횟수 자료를, 선 박은 국토해양부 지방항만청에서 집계되는 외항선 및 연안선의 해상선박운송 자료를, 항공은 한국공항공사 와 인천공항공사의 공항별 월별 기종별 이착륙횟수 자료를 이용하였다. 농업기계는 농림수산식품부의 시 군구별 농업기계 보유현황과 농업공학연구소에서 조 사되는 농업기계 연간작업시간 자료, 건설장비는 국 토해양부의 건설장비 보유대수, 대한건설기계협회의 건설기계별 가동시간 자료를 입수하여 배출량 산정 에 사용하였다.
2. 3 배출량 산정 방법 2. 3. 1 점∙면 오염원
연료 연소 부문은 SODAC과 CleanSYS를 기반으로 배출계수와 연료사용량의 곱에 개별 방지시설에 대한 방지효율을 적용하여 점오염원의 배출량을 산정하였 고 점 오염원에서 사용되는 연료를 제외한 나머지 연 료는 면 오염원으로 분류하였다. 방지효율은 SODAC 자료를 이용하여 개별 연소시설의 방지효율 자료를 적용하였다. 연료 연소 부문의 PM2.5배출계수는 국 내에서 적용 가능한 배출원별 배출계수가 없어 배출 원별 TSP (or PM10) 배출계수에 대한 PM2.5의 분율 (U.S. EPA, 2008)을 적용하였다. PM2.5배출계수 선택 시 (1) 방지효율이 적용되지 않은(uncontrolled) 것, (2) quality가 높은 것, (3) 최근연도 순으로 고려하였다.
생산 공정의 배출량은 제품생산량이나 원료투입량 에 배출계수를 곱하여 산정하였다. SODAC에 입력된 업소별 제품생산량, 시설별 제품생산량, 시설별 연료 소비량 자료를 이용하여 점 오염원 배출량을 산정하 였고 그 외 활동도 자료는 면 오염원으로 분류하였다.
폐기물은 생활폐기물과 사업장 폐기물 발생량에 배출계수를 곱하여 산정하였으며 SODAC에 입력되
었거나 지방자치단체에서 운영되는 소각시설, 중간처 리 업체 소각시설은 점 오염원으로 그 외는 면 오염 원으로 산정하였다. 생산 공정과 폐기물 부문의 PM2.5
배출계수는 U.S. EPA Speciate 4.2 중 (1) 방지효율이 적용된(controlled) 것, (2) quality가 높은 것, (3) 최근 연도 순으로 고려하였다. 연료 연소 부문 CAPSS TSP 배출계수는 방지효율이 적용되지 않은(uncontrolled) Table 1. Source categories for the PM2.5emission in CAPSS.
Sources Sectors Sub-sectors SCC code
Fuel combustion Combustion in Public power plants 01010000
facilities energy industries District heating production plants 01020000
Petroleum refineries 01030000
Private power plants 01050000
Non-industrial combustion Commercial and institutional plants 02010000
Residential plants 02020000
Plants in agriculture, forestry and aquaculture 02030000
Combustion in Combustion plants 03010000
manufacturing industries Processes with or without contact 03020000
Others 03030000
Production progresses Petroleum industries - 04010000
Iron and steel industries Coke oven (door leakage and extinction) 04020100
Blast furnace charging 04020200
Pig iron tapping 04020300
Basic oxygen furnace plant 04020500
Electric furnace plant 04020600
Sinter plants (except combustion) 04020800
Inorganic chemicals Ammonium sulphate 04040400
industries Ammonium nitrate 04040500
Urea 04040800
Carbon black 04040900
Phosphate fertilizers 04041400
Others Glasses 04990300
Limes 04990400
Mobiles On-road vehicles Passenger cars 07010000
Light-duty vehicles 07030000
Buses 07040000
Heavy-duty vehicles 07050000
Special motor vehicles 07060000
Recreational vehicles 07070000
Non-road vehicles Railroads 08020000
Ships 08030000
Aircrafts 08040000
Agricultural 08050000
Construction machineries 08060000
Waste treatments Waste incineration Municipal waste incinerators 09010100
Industrial waste incinerators (except flaring) 09010200
Other sources Fires Forest fires 11020100
Other fires (except forest fires) 11020200
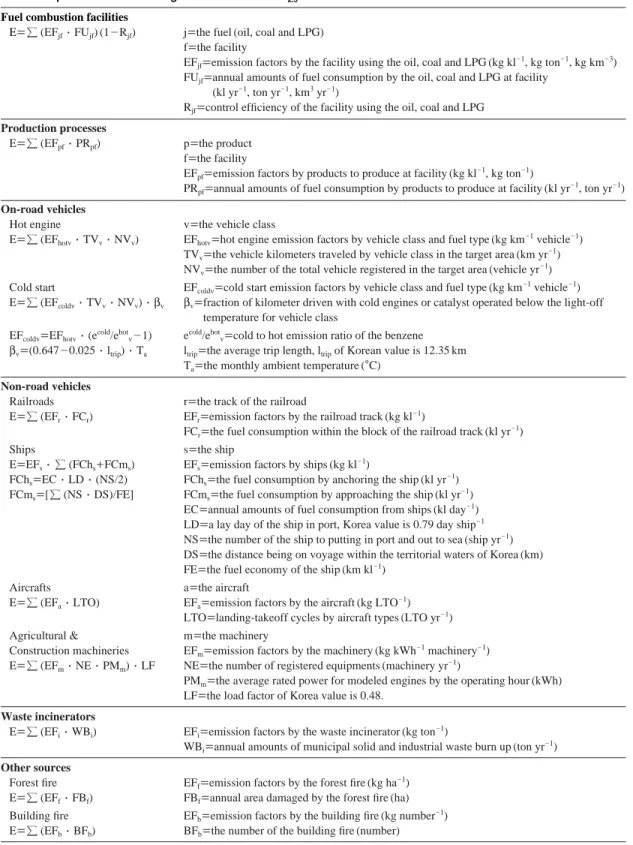
Table 2. Equations for calculating emissions of the PM2.5based on the emission sources.
Fuel combustion facilities
E==» (EFjf∙FUjf) (1-Rjf) j==the fuel (oil, coal and LPG) f==the facility
EFjf==emission factors by the facility using the oil, coal and LPG (kg kl-1, kg ton-1, kg km-3) FUjf==annual amounts of fuel consumption by the oil, coal and LPG at facility
(kl yr-1, ton yr-1, km3yr-1)
Rjf==control efficiency of the facility using the oil, coal and LPG Production processes
E==» (EFpf∙PRpf) p==the product f==the facility
EFpf==emission factors by products to produce at facility (kg kl-1, kg ton-1)
PRpf==annual amounts of fuel consumption by products to produce at facility (kl yr-1, ton yr-1) On-road vehicles
Hot engine v==the vehicle class
E==» (EFhotv∙TVv∙NVv) EFhotv==hot engine emission factors by vehicle class and fuel type (kg km-1vehicle-1) TVv==the vehicle kilometers traveled by vehicle class in the target area (km yr-1) NVv==the number of the total vehicle registered in the target area (vehicle yr-1) Cold start EFcoldv==cold start emission factors by vehicle class and fuel type (kg km-1vehicle-1) E==» (EFcoldv∙TVv∙NVv)∙βv βv==fraction of kilometer driven with cold engines or catalyst operated below the light-off
temperature for vehicle class
EFcoldv==EFhotv∙(ecold/ehotv-1) ecold/ehotv==cold to hot emission ratio of the benzene βv==(0.647-0.025∙ltrip)∙Ta ltrip==the average trip length, ltripof Korean value is 12.35 km
Ta==the monthly ambient temperature (�C) Non-road vehicles
Railroads r==the track of the railroad
E==» (EFr∙FCr) EFr==emission factors by the railroad track (kg kl-1)
FCr==the fuel consumption within the block of the railroad track (kl yr-1)
Ships s==the ship
E==EFs∙» (FChs++FCms) EFs==emission factors by ships (kg kl-1)
FChs==EC∙LD∙(NS/2) FChs==the fuel consumption by anchoring the ship (kl yr-1) FCms==[» (NS∙DS)/FE] FCms==the fuel consumption by approaching the ship (kl yr-1)
EC==annual amounts of fuel consumption from ships (kl day-1) LD==a lay day of the ship in port, Korea value is 0.79 day ship-1 NS==the number of the ship to putting in port and out to sea (ship yr-1) DS==the distance being on voyage within the territorial waters of Korea (km) FE==the fuel economy of the ship (km kl-1)
Aircrafts a==the aircraft
E==» (EFa∙LTO) EFa==emission factors by the aircraft (kg LTO-1) LTO==landing-takeoff cycles by aircraft types (LTO yr-1) Agricultural & m==the machinery
Construction machineries EFm==emission factors by the machinery (kg kWh-1machinery-1) E==» (EFm∙NE∙PMm)∙LF NE==the number of registered equipments (machinery yr-1)
PMm==the average rated power for modeled engines by the operating hour (kWh) LF==the load factor of Korea value is 0.48.
Waste incinerators
E==» (EFi∙WBi) EFi==emission factors by the waste incinerator (kg ton-1)
WBi==annual amounts of municipal solid and industrial waste burn up (ton yr-1) Other sources
Forest fire EFf==emission factors by the forest fire (kg ha-1) E==» (EFf∙FBf) FBf==annual area damaged by the forest fire (ha) Building fire EFb==emission factors by the building fire (kg number-1) E==» (EFb∙BFb) BFb==the number of the building fire (number)
것이고, 생산 공정과 폐기물 부문 배출계수는 방지효 율이 적용된(controlled) 것이기에 본 연구는 이를 반
영하여 PM2.5배출계수를 적용하였다. 산불 발생 시의 배출계수는 U.S. EPA AP-42, 건물화재시의 배출계수 Table 3. Activity data from 2008 CAPSS and emission factors of point and area sources from U.S. EPA Speciate.
SCC code Activity EF in this study No. of
Description Data TSP PM2.5/TSP (%) facility**
1010000 Anthracite coal 2,651,289 ton 200 kg/ton 32.69 3
1020000 Bituminous coal 61,671,169 ton 50 kg/ton 32.69 17
1030000 Oil (B-C for boiler) 4,018,576 kl 1.1S*++0.39 kg/kl 93.80 53
1050000 Oil (B-C for engine) 76,539 kl 1.668 kg/kl 58.42 3
Oil (for boiler) 26,501 kl 0.24 kg/kl 43.05 24
Oil (for engine) 1,017 kl 1.668 kg/kl 43.05 1
LNG 12,512,727 km3 0.036 kg/km3 100.00 30
2010000 Oil (B-A for boiler) 2,550 kl 0.84 kg/kl 84.12 3
2020000 Oil (B-B for boiler) 383 kl 1.2 kg/kl 84.12 1
2030000 Oil (B-C for boiler) 453,188 kl 1.1S*++0.39 kg/kl 84.12 254
Oil (diesel) 1,125 kl 0.24 kg/kl 84.12 26
Oil (for other equipment) 6,082,198 kl 1.668 kg/kl 84.12 46
LNG (for boiler) 42,616 km3 0.03 kg/km3 100.00 27
LNG (for gas turbine) 23 km3 0.036 kg/km3 100.00 1
LNG (engine, other equipment) 11,774,598 km3 0.18 kg/km3 100.00 3
LPG 3,139,746 kl 0.036 kg/kl 100.00 1
3010000 Anthracite coal 407,254 ton 200 kg/ton 32.69 29
3020000 Bituminous coal 6,099,994 ton 50 kg/ton 32.69 22
3030000 Oil (B-A for boiler) 79,042 kl 0.84 kg/kl 84.12 16
Oil (B-B for boiler) 63,882 kl 1.2 kg/kl 84.12 4
Oil (B-C, LSWR for boiler) 4,820,871 kl 1.1S*++0.39 kg/kl 84.12 668
Oil (light, kerosene) 784,076 kl 0.24 kg/kl 84.12 47
Oil (bunker, light, kerosene 2,181,981 kl 1.668 kg/kl 84.12 776
for other equipment)
LNG 3,008,828 km3 0.03 kg/km3 100.00 778
LPG 2,852,101 kl 0.036 kg/kl 100.00 146
4010000 Crude Oil 138,062,055 kl 0.006 kg/kl 22.65 8
4020100 Coke 12,736,104 ton 0.062 kg/ton 19.35 5
4020200 Metallic stain 31,585,532 ton 0.088 kg/ton 71.99 8
4020300 Metallic stain 31,585,532 ton 0.0367 kg/Mg 30.24 8
4020500 Molten steel 32,715,274 ton 0.001 kg/ton 84.91 4
4020600 Steel 23,235,000 ton 0.03 kg/Mg 53.13 26
4020800 Sintered ore 40,761,972 ton 0.037 kg/Mg 70.55 6
4040400 Ammonium sulfate 723,746 ton 0.02 kg/ton 72.70 5
4040500 Ammonium nitrate 4,796 ton 2.151 kg/ton 77.50 1
4040800 Urea 171,413 ton 0.28 kg/ton 25.97 4
4040900 Carbon black 487,506 ton 1.04 kg/ton 31.09 15
4041400 Phosphate fertilizers 95,818 ton 4.2 kg/ton 42.91 2
4990300 Glass 2,978,034 ton 0.1 kg/ton 69.74 80
4990400 Lime 1,390,000 ton 0.14 kg/ton 48.03 44
9010100 Municipal solid waste 3,548,538 ton 0.05 kg/ton 52.41 207
9010200 Industrial waste 2,137,994 ton 0.05 kg/ton 52.41 568
11020100 Forest fire 226.89 ha 172 kg/ha 85.0 -
11020200 Other fire 48,496 fire 9.6 kg/fire 91.4
*Sulfur content in oil. **The number of large industrial sources in Korea (2008).
는 U.S. California EPA의 ARB (Air Resource Board) 자료이며 분율은 California EPA의 ARB 자료를 적 용하였다.
2. 3. 2 이동 오염원
이동 오염원 중 도로부문은 엔진가열과 미가열로 나누어 산정되며 엔진가열은 차종별, 도로별 주행거 리에 배출계수의 곱으로, 미가열은 Ntziachristos and Samaras (2000)가 제안한 산정방법을 기초로 국내 기 상인자 등을 고려하여 산정하였다. 차종은 국내 자동 차 관리법 시행규칙 별표 1에 근거하여 분류하였고 배출계수는 U.S. EPA Speciate 4.2의 PM2.5분율 자료 를 적용하였다.
비도로 부문 중 철도는 구간별 연료소비량, 선박은 정박과 접안 시 연료소비량, 항공은 기종별 이착륙횟 수, 농기계와 건설장비는 보유대수, 평균정격출력, 평 균출력비율, 가동시간을 활동도로 각각의 배출계수 를 곱해 배출량을 산정하였다. 비도로 부문의 PM2.5
배출계수는 EEA (Europe Environment Agency)의 CORINAIR 자료(Emission Inventory Guidebook, 2006) 를 적용하였다.
배출목록에 따른 산정방법은 표 2에 정리했으며 그 외 산정방법은 국가대기오염물질 배출량 산정방 법 편람 (II) (국립환경과학원, 2010a)을 참고하였다.
본 연구에서 사용된 배출목록별 활동도, 배출계수 및 배출목록에 해당하는 1, 2, 3종 배출시설 수는 CAPSS 활동도 자료를 바탕으로 표 3과 4에 각각 정리하였다.
3. PM
2.5배출량 및 기여도 분석
3. 1 배출원별 배출량과 기여율
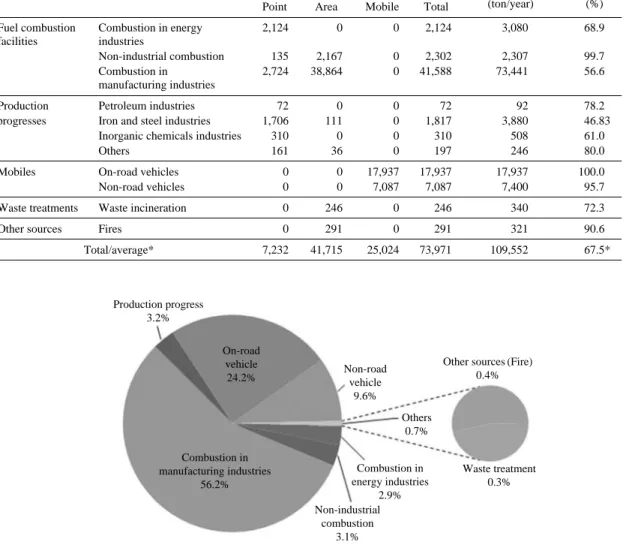
국내에서 발생한 PM2.5총 배출량은 2008년 기준 73,971톤/년으로 PM10총 배출량 109,552톤/년의 67.5
%를 차지하는 것으로 나타났다(표 5). 배출원 분류별 로 살펴보면 연료 연소 부문에서 46,014톤/년(62.2%), 이동 오염원에서 25,024톤/년(33.8%), 산업공정에서 2,396톤/년(3.2%), 폐기물처리에서 246톤/년(0.3 %), 기타 면 오염원(화재)에서 291톤/년(0.4%)으로 나타 나 연료 연소와 이동 오염원 부문 배출량이 대부분 (96.0%)을 차지하고 있는 것으로 나타났다(그림 2).
이를 이동 오염원 38.7%, 연료 연소 27.1%, 생산 공정 8.9%, 폐기물 6.0% 기여율의 영국 배출량 자료, 연료 연소 50.0%, 이동 오염원 32.9%, 생산공정 10.4%, 폐기물 0.04%인 독일 자료(Jang et al., 2009) 와 비교해 보면 배출원 분류 체계가 달라 직접적으 로 비교하기 어렵지만 국내 배출량 자료의 경우 연 료 연소와 이동 오염원에 대한 배출 의존도가 상대 적으로 커 앞으로 시행될 대기환경기준 관리를 위해 이들 배출원에 대한 관리가 중점적으로 이루어져야 할 것으로 보인다.
인위적 배출원의 미세입자는 중유 또는 LNG 연소 시설, 석탄 화력발전소 등 연료 연소 시설에서 연료 의 고온 연소 시 각 금속의 증기압에 따라 형성된 금속 증기의 핵형성∙응축∙응집을 거쳐 주로 유해 중금속을 포함하여 생성된다 (Linak and wcndt, Table 4. Activity data from 2008 CAPSS and emission factors of mobile sources from U.S. EPA Speciate or EEA
CORINAIR.
Activity EF in this study
SCC code Source category Description Data TSP (PM10) PM2.5/TSP (%)
7010000 Passenger cars 128,929,346,415 km∙vehicle 0.00012 g/km∙vehicle 100.00 7030000 Light-duty vehicle 8,150,354,699 km∙vehicle 0.09825 g/km∙vehicle 100.00 7040000 Buses
VKT 8,393,983,938 km∙vehicle 0.19717 g/km∙vehicle 100.00 7050000 Heavy-duty vehicle 63,668,132,626 km∙vehicle 0.189287 g/km∙vehicle 100.00 7060000 Special motor vehicle 613,283,054 km∙vehicle 0.22802 g/km∙vehicle 100.00 7070000 Recreation vehicle 59,430,019,333 km∙vehicle 0.06197 g/km∙vehicle 100.00
8020000 Railroads Oil 217,677 kl 1.14, 2.68, 4.16 kg/kl 94.00*
8030000 Ships Oil (bunker-c) 1,162 kl 0.6, 1.2, 2.4, 3.96, 6.78 kg/kl 100.00*
8040000 Aircrafts LTO 264,620 LTO 0~0.42156 kg/LTO 100.00*
08050000 Agricultural No. of 1,892,417 vehicle 0.18, 0.20, 0.35, 0.40, 0.45, 94.00*
& 08060000 & construction machineries 0.48, 0.75, 2.04 g/kWh
machineries
*EEA CORINAIR emission factors
1993). 특히, 로 내의 온도와 체류시간, 냉각속도, 연 료 내의 화학성분, 방지시설의 종류 및 유무, 연료의 종류 등에 의하여 입경분포의 범위는 다양해 질 수 있다(Jang et al., 2007; Lee et al., 2007).
본 연구에 나타난 에너지산업, 비산업, 제조업 연소 시설에서의 PM10중 PM2.5분율은 56.6~99.7%로 그 범위가 넓고 생산 공정부문은 46.8~80.0%로 연료 연소시설에 비해 낮게 형성되었는데 이는 향후 깊이 있는 연구를 통해 원인을 파악할 필요가 있는 것으 로 사료된다.
한편, 폐기물 소각 시 분율은 52.4%로, 방지시설의 형태, 연료의 성상 및 종류, 로 내의 온도, 냉각속도, 연료 내 화학성분 등 복합적 요인에 의해 폐기물 소 각 시 발생하는 미세입자의 형성 비율이 결정된 것 으로 보인다.
3. 2 점∙면 오염원 배출량
점 오염원에서 발생되는 배출량은 7,232톤/년으로 PM2.5총 배출량의 9.8%를 차지하고 있으며 연료 연 소 4,983톤/년(68.9%), 생산공정 2,249톤/년(31.1%) Table 5. PM2.5emissions by sources categories.
Sources Sectors PM2.5emissions (ton/year) PM10emissions PM2.5/PM10
Point Area Mobile Total (ton/year) (%)
Fuel combustion Combustion in energy 2,124 0 0 2,124 3,080 68.9
facilities industries
Non-industrial combustion 135 2,167 0 2,302 2,307 99.7
Combustion in 2,724 38,864 0 41,588 73,441 56.6
manufacturing industries
Production Petroleum industries 72 0 0 72 92 78.2
progresses Iron and steel industries 1,706 111 0 1,817 3,880 46.83
Inorganic chemicals industries 310 0 0 310 508 61.0
Others 161 36 0 197 246 80.0
Mobiles On-road vehicles 0 0 17,937 17,937 17,937 100.0
Non-road vehicles 0 0 7,087 7,087 7,400 95.7
Waste treatments Waste incineration 0 246 0 246 340 72.3
Other sources Fires 0 291 0 291 321 90.6
Total/average* 7,232 41,715 25,024 73,971 109,552 67.5*
Production progress 3.2%
Combustion in manufacturing industries
56.2%
On-road vehicle
24.2% Non-road
vehicle 9.6%
Others 0.7%
Other sources (Fire) 0.4%
Waste treatment 0.3%
Combustion in energy industries
2.9%
Non-industrial combustion
3.1%
Fig. 2. Distribution of the PM2.5emissions by source categories.
으로 두 부문에서 전량 배출되는 것으로 나타났다.
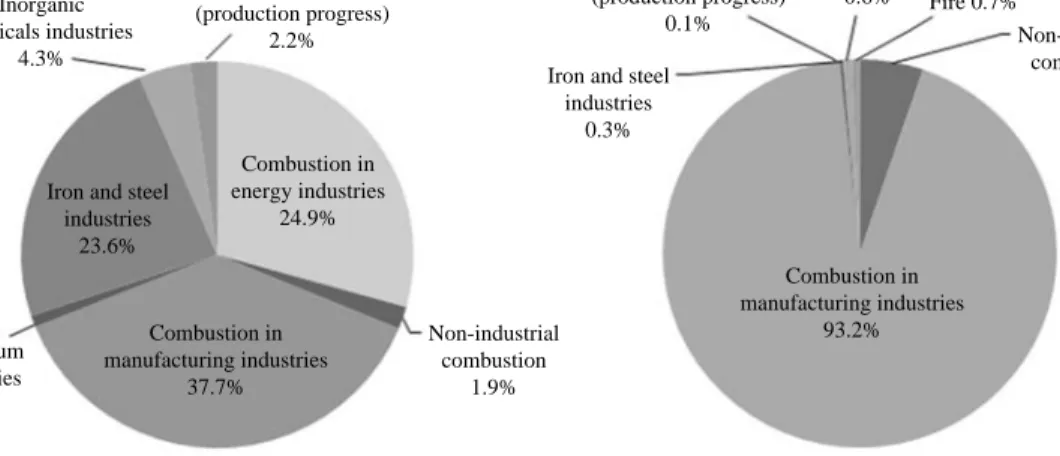
배출원 세분류를 살펴보면 제조업 연소(37.7%), 에 너지산업 연소(29.4%), 제철제강업(23.6%), 무기화학 제품 제조업(4.3%), 기타 제조업(2.2%), 비산업 연소 (1.9%), 석유제품산업 (1.0%) 순으로 높은 기여율을 보였다(그림 3).
면 오염원의 배출량은 41,715톤/년으로 총 배출량 의 56.4% 차지하고 있으며 제조업 연소 38,864톤/년 (93.2%), 비산업 연소 2,167톤/년(5.2%), 그 외 제철 제강업, 화재, 폐기물 처리, 기타 생산공정 등에서 각 각 1% 미만의 기여율을 보이고 있어 제조업 연소에 의한 배출 기여도가 절대적인 것으로 나타났다. 면
오염원의 배출량이 점 오염원에 비해 5배 이상 많은 것으로 나타났는데 이는 1, 2, 3종 사업장만을 점 오 염원으로 한정하고 나머지 사업장은 개별 사업장에 대한 정보를 입수하기 곤란한 점을 들어 면 오염원 으로 할당하는 CAPSS 배출량 할당 방식에 의한 것 으로 추후 4, 5종 배출업소에 대한 자료가 확보된다 면 점, 면 오염원에 대한 배출기여도는 지금과 크게 달라질 것으로 예상된다.
3. 3 이동 오염원 배출량
이동 오염원에서 발생하는 배출량 (그림 4)은 25,024톤/년으로 33.8%를 차지하는 것으로 나타났 Other vehicles
0.8%
Passenger cars 0.1%
Buses
9.2% Recreation vehicles 20.5%
Heavy-duty vehicles 64.9%
Light-duty vehicles 4.5%
Agricultural &
construction machineries
58.4%
Ships 29.6%
Railroads 10.9%
Aircrafts 1.1%
Fig. 4. Distribution of the PM2.5emissions by on-road (left) and non-road (right) sources.
Inorganic chemicals industries
4.3%
Others (production progress)
2.2%
Others (production progress)
0.1% Fire 0.7%
Waste incineration 0.6%
Iron and steel industries
23.6%
Iron and steel industries
0.3%
Combustion in manufacturing industries
37.7%
Combustion in manufacturing industries
93.2%
Combustion in energy industries
24.9%
Non-industrial combustion
1.9%
Non-industrial combustion
5.2%
Petroleum industries
1.0%
Fig. 3. Distribution of the PM2.5emissions by point (left) and area (right) sources.
다. 도로에서 17,937톤/년(71.7%), 비도로에서 7,087 톤/년 (28.3%)이며 도로에서는 화물차 (64.9%), RV (20.5%), 버스 (9.2%), 승합차(4.5%)순으로 높은 기여 율을 보였고 비도로에서는 농기계 및 건설장비가 58.4%, 선박 29.6%, 철도 10.9%, 항공 1.1%를 차지하 는 것으로 나타났다.
도로이동 오염원의 배출량이 등록대수와 평균 주 행거리의 곱인 총 주행거리(VKT)에 의존하므로 평 균 주행거리가 많은 화물차에서 배출량이 많은 것으 로 파악되며 농기계 및 건설기계의 경우 기계 등록 대수와 가동시간에 의해 배출량이 좌우되므로 다른 배출원에 비해 상대적으로 많은 양이 발생하는 것으 로 파악된다.
4. 결 론
본 연구에서는 2015년 대기환경기준 시행을 앞두 고 있는 대기오염물질인 PM2.5의 배출량을 파악하기 위해 배출목록을 구축하고 배출원별 배출량을 산정, 각각의 기여율을 살펴보았다. 배출목록은 CAPSS 배 출원 분류체계를 바탕으로 연료 연소, 생산공정, 이동 오염원, 폐기물 처리, 화재로 나누어 구축하였고 배출 원별 배출량을 산정하기 위해 필요한 활동도 자료는 유관기간으로부터 입수하여 CAPSS에 구축된 자료 를 활용하였다. 이에 따라 산정된 2008년 국내에서 발생한 PM2.5총 배출량은 73,971톤/년으로 연료 연소 46,014톤/년(62.2%), 이동 오염원 25,024톤/년(33.8%), 산업공정 2,396톤/년 (3.2%), 폐기물처리 246톤/년 (0.3%), 화재 291톤/년(0.4%)으로 연료 연소와 이동 오염원 부문에서 대부분(96.0%)을 차지하고 있으며 PM10중 PM2.5가 차지하는 비율은 67.5%로 나타났다.
점 오염원 배출량은 7,232톤/년(9.8%), 면 오염원 배출량은 41,715톤/년(56.4%), 이동 오염원 배출량은 25,024톤/년(33.8%)으로 나타났다. 점 오염원에서는 연료 연소 4,983톤/년(68.9%), 생산공정 2,249톤/년 (31.1%)에서 전량 배출되며 면 오염원에서는 제조업 연소 38,864톤/년 (93.2%), 비산업 연소 2,167톤/년 (5.2%)으로 제조업 연소에 의한 배출 기여도가 절대 적인 것으로 나타났다. 이동 오염원 부문에서는 도로 부문이 17,937톤/년(71.7%), 비도로부문이 7,087톤/
년(28.3%)을 차지하는 것으로 나타났다. 도로부문에
서는 총 주행거리가 가장 많은 화물차(64.9%)의 기 여도가 가장 높았으며, RV (20.5%), 버스(9.2%), 승합 차(4.5%)순으로 나타났고 비도로 부문에서는 농기 계 및 건설장비(58.4%), 선박(29.6%), 철도(10.9%), 항공(1.1%) 순으로 나타났다.
본 연구는 배출목록을 체계적으로 구축, 배출원별 로 PM2.5의 국내 배출량을 산정하였으며 이는 국가 대기오염물질 배출량 통계인 CAPSS의 배출목록 및 활동도를 기반으로 산정한 것이어서 더욱 의미가 크 다 하겠다. 이 결과는 향후 시행 예정인 PM2.5대기환 경기준을 달성하기 위한 저감정책을 수립하는 데 있 어 유용한 자료가 될 것으로 생각된다. 또한 기존 연 구에 따르면 이번 연구에서 포함시키지 못한 비산먼 지와 생물성 연소에 의한 PM2.5의 기여율도 상대적 으로 큰 비중을 차지하고 있는 만큼(Jang et al., 2009) 이에 대한 추가적 연구를 통해 총체적인 대기질 관 리에 도움이 되도록 할 예정이다.
참 고 문 헌
강광규, 추장민, 조강래, 이대엽, 남궁권, 박경애, 조승환, 이범 환, 박재광, 곽광호, 박홍진(2007) 운행경유차 배 출가스저감사업 개선방안 연구, 한국환경정책평 가연구원 연구보고서.
국립환경과학원(2010a) 국가 대기오염물질 배출량 산정편 람(II).
국립환경과학원(2010b) 굴뚝원격감시시스템(CleanSYS).
국립환경과학원(2010c) 대기정책지원시스템(Clean Air Policy Support System, CAPSS).
국립환경과학원(2010d) 대기환경연보 2009.
국립환경과학원 (2010e) 배출업소자료수집프로그램 (Source Data Collection, SODAC).
장영기, 구윤서, 임종한, 채여라(2009a) PM2.5대기환경기준 설정을 위한 연구, 국립환경과학원.
장영기, 구윤서, 최기주, 최상진, 박건진, 홍영실(2009b) PM2.5
배출특성 및 기여도 추정 연구, 국립환경과학원.
환경부(2010) 수도권 대기환경 기본계획 변경계획.
환경부(2011) 인체 위해성이 높은 초미세먼지 관리 본격화, 환경부 보도자료.
Ahn, J.Y., K.J. Moon, J.S. Kim, M.D. Lee, S.J. Lee, H.J. Kim, H.E. Jeon, J. Oh, J.S. Choi, S.M. Park, J.S. Park, and S.W. Lee (2009) Study on the Characteristic on Phys- ical and Chemical Properties of PM2.5(I), National Institute of Environmental Research.
California EPA Air Resource Board (2008) http://www.arb.ca.
gov/ei/ei.htm.
EEA (2006) EMEP/CORINAIR Technical Report, Emission Inventory guidebook, www.eea.europe.eu/publica tions/EMEPCORINAIR4.
Jang, H.N., Y.C. Seo, J.H. Lee, K.W. Hwang, J.I. Yoo, C.H.
Sok, and S.H. Kim (2007) Formation of fine parti- cles enriched by V and Ni from heavy oil combus- tion: Anthropogenic sources and drop-tube furnace experiments, AE, 41(5), 1053-1063.
Jang, K.W., J.H. Lee, S.W. Jung, K.H. Kang, and J.H. Hong (2009) A study on the comparison of emission factor method and CEMS (Continuous Emission Monitoring System), Journal of Korean Society for Atmospheric Environment, 25(5), 410-419. (in Korean with English abstract)
Lee, J.H., J.S. Cha, J.H. Hong, D.I. Jung, and J.Y. Kim (2008) Estimation of benzene emissions from mobile sources in Korea, Journal of Korean Society for Atmospheric Environment, 24(1), 72-82. (in Korean with English abstract)
Lee, S.H., K.S. Park, J.H. Lee, H.N. Jang, J.H. Kim, and Y.C.
Seo (2007) A study on the emission behavior of mercury generated from wast incinerators, Journal of Material Cycles and Waste Management, 24(8), 704-713. (in Korean with English abstract) Linak, W.P. and J.O.L. Wendt (1993), Toxic metal emissions
from incineration: Mechanisms and control, Prog.
Energy Combust. Sci., 19, 145-185.
Ntziachristos, L. and Z. Samaras (2000) COPERT III Computer program to calculate emissions from road transport, Technical Report 49, European Environment Agency, Copenhagen, Denmark.
U.S. EPA (1997) CFR Promulgated Test Methods, http://www.
epa.gov/ttn/oarpg/naaqsfin/pmhealth.html.
U.S. EPA (2007b) Technology Transfer Network, Clearing- house for inventories & emission factors, http://
www.epa.gov/ttnchief1/ap42.
U.S. EPA (2008) Technology Transfer Network, Clearing- house for inventories & emission factors, http://
www.epa.gov/ttnchief1/software/speciate.
World Health Organization (2006) WHO Air quality guide- lines for particle matter, ozone, nitrogen dioxide and sulfur dioxide, Global update 2005.