Factors Influencing Upper Airway Dimensions in Skeletal Class Ⅱ Children and Adolescents: A CBCT Study
Byounghwa Kim 1 , Jewoo Lee 2 , Jiyoung Ra 2
1 Department of Pediatric Dentistry, College of Dentistry, Wonkwang University
2 Department of Pediatric Dentistry and Dental Research Institute, College of Dentistry, Wonkwang University
The purpose of this study is to investigate factors influencing the upper airway dimensions in skeletal Class Ⅱ children and adolescents.
In total, 67 patients were selected. Airway volume and minimal cross-sectional area were three-dimensionally assessed.
Craniofacial morphology and skeletal maturity were assessed on generated two-dimensional cephalograms. The measurements were analyzed using Mann-Whitney test, one-way ANOVA, Pearson’s correlation, and multiple regression analysis.
Upper airway dimensions were significantly smaller in pre-peak stage group, and positively associated with age.
Anterior facial height and age were the most relevant factors for airway volume. Mandibular width and age were the most relevant factors for minimal cross-sectional area.
Upper airway dimensions were significantly associated with age, skeletal maturity and craniofacial morphology in all three planes.
Key words : Upper airway dimensions, Skeletal Class Ⅱ pattern, Cone-beam computed tomography Abstract
Corresponding author : Jiyoung Ra
Department of Pediatric Dentistry, College of Dentistry, Wonkwang University, 895 Muwang-ro, Iksan, Jeollabuk-do, 54538, Republic of Korea Tel: +82-63-850-6633 / Fax: +82-63-858-2957 / E-mail: [email protected]
Received June 3, 2020 / Revised August 11, 2020 / Accepted July 21, 2020
Ⅰ. Introduction
The effects of respiratory function on craniofacial growth have been studied for decades. More recently, the associa- tion between upper airway configurations, craniofacial de- velopment, and sleep-disordered breathing (SDB) has been studied[1,2]. Studies on the association between upper airway dimensions and craniofacial morphology have shown that skeletal Class III patients have a greater airway volume and
minimal cross-sectional area than skeletal Class I and Class II patients[3-6].
The association between upper airway space and SDB has been confirmed through various studies. Arens et al .[7] re- ported that in patients with SDB, the upper airway has a sig- nificantly smaller cross-sectional area and volume than that in healthy patients. Kim et al .[8] reported that patients with severe SDB had a smaller upper airway width.
As maxillofacial growth can be influenced by airway dimen-
sions, airway assessment is important in growing patients.
There are 2 methods of airway assessment: using lateral cephalograms and cone-beam computed tomography (CBCT) images. A two-dimensional (2D) assessment using skeletal and soft tissue landmarks on a lateral cephalogram lacks accu- racy with respect to the actual airway size or structure. Three- dimensionally (3D) reconstructed images from CBCT provide stereoscopic images of the airway and enable measurement of the cross-sectional area and volume of the airway space.
Few studies conducted in Korea have used CBCT to analyze the upper airway space in pediatric patients with skeletal Class II malocclusion. In addition, research on associations between the vertical and transverse craniofacial morphology and the upper airway dimension is limited.
This study aimed to investigate factors influencing the up- per airway dimensions in pediatric skeletal Class II patients by assessing the correlations with gender, age, skeletal maturity, and craniofacial dimensions.
Ⅱ. Materials and Methods
This retrospective study was approved by the institu- tional review board (IRB) of the Wonkwang University (WK- DIRB202003-02).
1. Subjects
This study retrospectively analyzed 232 patients who had undergone CBCT due to supernumerary teeth, impacted
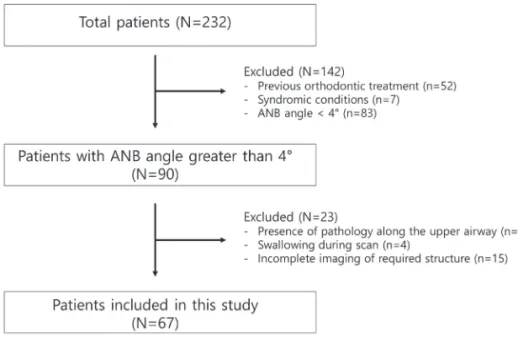
teeth, cystic lesion and orthodontic/surgical reasons at the Wonkwang University Dental Hospital from 2014 to 2019. The inclusion criteria were (1) patients between 8 and 15 years of age, (2) A point-nasion-B point (ANB) angle ≥ 4°, (3) biting in centric occlusion, and (4) CBCT scans with complete imag- ing of the cranial base, maxilla, mandible, the first 4 cervical vertebrae (C1 - C4), and the associated airway. The exclusion criteria were (1) previous orthodontic treatment and/or or- thognathic surgery, (2) A point-nasion-B point (ANB) angle <
4°, (3) known syndromic conditions, (4) presence of pathology detectable along the upper airway, and (5) swallowing during scan acquisition.
After application of the inclusion and exclusion criteria, 67 patients were included in the final sample (Fig. 1).
2. Methods
1) CBCT image acquisition
All images were taken by the same operator using the same CBCT device (Alphard-3030; ASAHI Roentgen IND, Kyoto, Ja- pan). The following specifications were used: tube voltage, 80 kVp; dose, 5.0 mA; scanning time, 17 seconds; voxel size, 0.39 mm as cranial mode. All patients were instructed to be seated upright and simultaneously fixed with the chin cup and ear rod to allow Frankfort horizontal to be positioned parallel to the floor. After the images were acquired, they were imported as digital imaging and communications in medicine (DICOM) files using the INFINITT PACS software program (INFINITT healthcare Co., Ltd, Seoul, Korea).
Fig. 1. Flow chart of patient selection.
2) Image preparation and airway assessment
3D images were reconstructed from the DICOM files using the OnDemand3D Application (Cybermed, Daejeon, Korea). All CBCT images were reoriented in all three planes according to the following guidelines[9]:
(1) Coronal plane : orbitale of both sides were on the same horizontal plane.
(2) Sagittal plane : Frankfort plane was horizontal.
(3) Axial plane : a line through the crista galli and the basion was vertical.
The upper airway volume and minimal cross-sectional area were measured according to the guidelines set forth by Anan-
darajah et al .[9] (Table 1, Fig. 2). The minimal cross-sectional area reflected the most constricted airway area within the de- fined margins.
3) Craniofacial morphology assessment
Craniofacial morphology was assessed on automatically constructed 2D lateral and posteroanterior cephalograms with no magnification. The images were imported into Vceph
TM6.0 (Osstem Implant, Seoul, Korea) for analysis. The following landmarks and measurements were used in this study:
(1) Landmarks (Fig. 3 and 4)
① Sella (S): The midpoint of sella turcica
② Nasion (N): The most anterior point on frontonasal suture
③ Orbitale (Or): The most inferior point on margin of orbit
④ Porion (Po): The most superior point of outline of external auditory meatus
⑤ Anterior nasal spine (ANS): The apex of the anterior nasal spine
⑥ Posterior nasal spine (PNS): The tip of the posterior nasal spine
⑦ A-point (A): The most posterior point on the anterior contour of the maxillary alveolar arch
⑧ B-point (B): The most posterior point on the anterior con- tour of the mandibular alveolar arch
⑨ Pogonion (Pg): The most anterior point on the mid-sagit- tal mandibular symphysis
⑩ Gonion (Go, lateral cephalogram): The most posterior in- ferior point on angle of mandible
⑪ Gonion (Go, posteroanterior cephalogram): The most lat- eral point on the convex margin on the angle of mandible
⑫ Maxillary notch (Mx): The intersection of the lateral con- tour of the maxillary alveolar process and the lower con- tour of the maxillo-zygomatic process of the maxilla Fig. 2. Margins for upper airway assessment[9].
ANS = anterior nasal spine, PNS = posterior nasal spine, Me = menton, ASC4 = antero-superior edge of the fourth cervical vertebrae
Table 1. Anatomical and technical limits of the upper airway[9]
Limit Anatomical Technical
Superior Hard and soft palate The line passing from the palatal plane (ANS to PNS) extending to the posterior wall of the pharynx Inferior Vallecula (plane of the hyoid bone; base of the epiglottis) Line passing from the antero-superior edge of C4 to
menton
Anterior Circumvallate papillae and the oropharyngeal isthmus Line passing from the soft palate to menton Posterior Respective pharyngeal walls Posterior wall of the pharynx
Laterally Respective pharyngeal walls Respective pharyngeal walls
ANS = anterior nasal spine, PNS = posterior nasal spine, C4 = the fourth cervical vertebrae
(2) Vertical craniofacial dimensions (Fig. 5)
① Anterior facial height (AFH): The distance between N and Me
② Posterior facial height (PFH): The distance between S and Go
③ AFH/PFH: The ratio of AFH to PFH
④ Frankfurt-mandibular plane angle: The angle formed by the Frankfurt horizontal plane (Or-Po) and the mandibular plane (Go-Me)
(3) Sagittal craniofacial dimensions (Fig. 6)
① ANB: The difference between sella-nasion-A point and sella-nasion-B point
② Facial convexity: The angle formed by N, A, and Pg
③ A to N-perpendicular: The liner distance from A to N per- pendicular
④ Pg to N-perpendicular: The liner distance from Pg to N perpendicular
④ Mandibular body length: The distance between Go and Me
⑤ Palatal length: The distance between ANS and PNS
(4) Transverse craniofacial dimensions (Fig. 7)
① Palatal width: The distance between Mx and Mx’
② Mandibular width: The distance between Go and Go’
4) Skeletal maturity assessment
Skeletal maturity was assessed on 2D lateral cephalograms using the Cervical Vertebral Maturation index according to Baccetti et al .[10] and categorized as corresponding to pre- peak, peak, and post-peak stages.
Fig. 3. Lateral cephalometric landmarks. Fig. 4. Posteroanterior cephalometric landmarks.
Fig. 5. Vertical craniofacial dimensions.
1 = AFH, 2 = PFH, 3 = FMA
5) Reliability
This study was conducted by one investigator, and after 4 weeks, 20 patients were randomly selected and remeasured.
When the intraclass correlation coefficient (ICC) value was ob- tained for the measured values of upper airway dimensions and craniofacial morphology, all of them were found to be 0.9 or higher.
6) Statistical analysis
The normality of the distribution was assessed using the Kolmogorov-Smirnov test. Differences in the upper airway di- mensions according to gender were analyzed using the Mann- Whitney test. Differences according to skeletal maturity were analyzed using one-way ANOVA followed by Bonferroni’s Post Hoc test. Pearson’s correlation test was performed to investi- gate the correlations between upper airway dimensions, age and craniofacial morphology. Partial correlation analysis was performed to eliminate the effects of age and skeletal matu- rity, and multiple regression analysis was performed to assess the most relevant variables for airway dimensions. All statistical analyses were conducted using Windows SPSS 25.0 (IBM, Ar- monk, NY, USA).
Ⅲ. Results
Out of 67 patients, 37 (55.22%) were male and 30 (44.78%) were female. The mean age of the study population was 12.25
± 2.11 years old. Based on skeletal maturity, 25.7% were in the pre-peak stage, 32.84% were in the peak stage, and 41.79%
were in the post-peak stage (Table 2). The mean values for the craniofacial morphology and upper airway dimensions are pre- sented in Table 3.
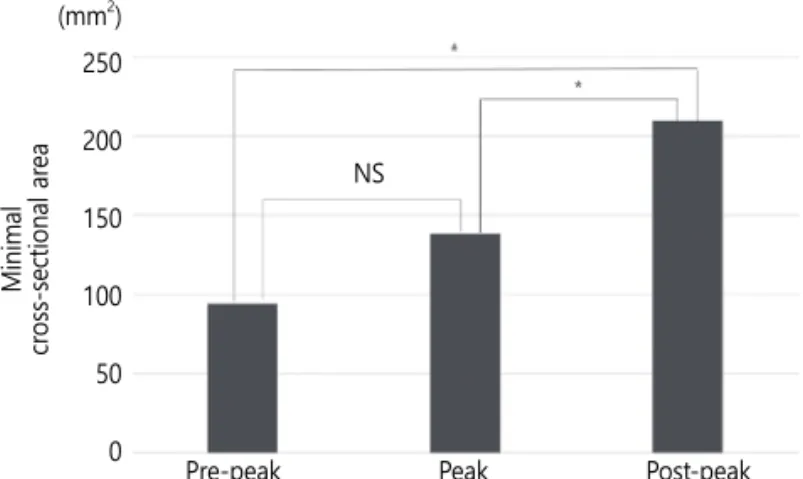
Gender was not significantly associated with airway volume or minimal cross-sectional area (Table 4). There was a statisti- cally significant difference in the upper airway dimensions according to skeletal maturity. Airway volume increased from pre-peak stage to post-peak stage and showed statistically significant differences between the groups (Fig. 8). The mini- mal cross-sectional area also increased from pre-peak stage to post-peak stage. No statistically significant differences between pre-peak and peak stages were identified (Fig. 9). Airway vol- ume and minimal cross-sectional area were positively corre- lated with age (p = 0.000).
The partial correlation analysis adjusting for age and skeletal maturity revealed significant associations between upper air- Fig. 6. Sagittal craniofacial dimensions.
1 = Facial convexity, 2 = A to N-perpendicular, 3 = Pg to N-perpendicular, 4 = Palatal length, 5 = Mandibular body length
Fig. 7. Transverse craniofacial dimensions.
1 = Palatal width, 2 = Mandibular width
way dimensions and vertical, sagittal, and transverse craniofacial morphology. Airway volume was positively associated with AFH, PFH, mandibular body length, maxillary and mandibular width (Table 5). The minimal cross-sectional area was positively associ- ated with AFH, mandibular body length, and mandibular width and negatively associated with ANB and facial convexity (Table 6).
Tables 7 and 8 show the results of multiple regression analy- sis on upper airway dimensions and variables with confirmed correlation. Upper airway volume showed the highest associa- tions with AFH and age (r
2= 0.502). The variables that showed the highest associations with the minimum cross-sectional area were the mandibular width and age (r
2= 0.544).
Table 2. Patients’ demographic factors Characteristic
Gender n (%)
Male 37 (55.22)
Female 30 (44.78)
Age Year
Mean ± SD 12.25 ± 2.11
Skeletal maturity n (%)
Pre-peak 17 (25.37)
Peak 22 (32.84)
Post-peak 28 (41.79)
SD = standard deviation
Table 3. The maximum, minimum, mean and standard deviation of measurements
Variables Minimum Maximum Mean SD
Upper airway dimensions
Airway volume (cc) 3.32 28.05 15.63 6.19
Minimal cross-sectional area (mm
2) 24.64 353.41 156.84 73.85
Craniofacial morphology Vertical dimension
AFH (mm) 103.60 134.53 114.95 7.39
PFH (mm) 62.30 90.62 74.73 6.54
AFH/PFH 1.28 1.90 1.55 0.12
FMA (°) 14.82 45.21 30.39 6.46
Sagittal dimension
ANB (°) 4.00 11.05 6.22 1.43
Facial convexity (°) 5.25 22.78 11.68 3.39
A to N perpendicular (mm) -10.40 6.69 -0.72 3.19
Pg to N perpendicular (mm) -9.99 22.65 8.34 6.05
Palatal length (mm) 40.95 54.98 47.96 3.42
Mandibular body length (mm) 70.59 90.52 80.77 5.43
Transverse dimension
Palatal width (mm) 79.17 101.48 90.17 5.24
Mandibular width (mm) 76.71 105.09 89.88 6.42
SD = standard deviation
Table 4. Upper airway dimensions according to gender Airway Volume (cc)
(Mean ± SD) p value Minimum Cross-sectional Area (mm
2)
(Mean ± SD) p value
Pre-peak Male 9.57 ± 4.29
0.257 93.50 ± 57.41
0.854
Female 7.48 ± 1.02 96.56 ± 10.55
Peak Male 16.55 ± 4.25
0.283 152.11 ± 61.46
0.250
Female 14.04 ± 2.90 124.19 ± 42.47
Post-peak Male 21.87 ± 3.60
0.137 224.15 ± 60.13
0.164
Female 19.61 ± 4.45 198.79 ± 63.13
p value from Mann-Whitney test
Table 5. Partial correlation between airway volume and craniofa- cial morphology
Airway Volume Correlation coefficient p value Vertical dimension
AFH 0.461 0.000
PFH 0.292 0.018
AFH/PFH -0.005 0.970
FMA -0.003 0.981
Sagittal dimension
ANB -0.213 0.081
Facial convexity -0.235 0.060
A to N perpendicular 0.040 0.751 Pg to N perpendicular 0.061 0.628
Palatal length 0.206 0.100
Mandibular body length 0.245 0.049 Transverse dimension
Palatal width 0.284 0.022
Mandibular width 0.437 0.000
Partial correlation test
Control variable : age, skeletal maturity
Table 6. Partial correlation between minimal cross-sectional area and craniofacial morphology
Minimal Cross-sectional Area Correlation coefficient p value Vertical dimension
AFH 0.364 0.003
PFH 0.134 0.287
AFH/PFH -0.110 0.383
FMA -0.043 0.735
Sagittal dimension
ANB -0.265 0.033
Facial convexity -0.399 0.001
A to N perpendicular 0.032 0.798 Pg to N perpendicular -0.025 0.846
Palatal length 0.167 0.183
Mandibular body length 0.316 0.010 Transverse dimension
Palatal width 0.178 0.157
Mandibular width 0.529 0.000
Partial correlation test
Control variables : age, skeletal maturity
Table 7. Multiple regression analysis of the airway volume with independent variables
Independent Variables
Airway Volume
B β t p value
(constant) 42.401
AFH 0.393 0.469 4.665 0.000
Age 1.050 0.358 3.566 0.001
Multiple regression analysis
B = Unstandardized coefficients, β = Standardized coefficients
Table 8. Multiple regression analysis of the minimal cross-section- al area with independent variables
Independent Variables
Minimal Cross-sectional Area
B β t p value
(constant) -513.281
Mandibular width 5.953 0.517 5.054 0.000
Age 11.022 0.315 3.081 0.003
Multiple regression analysis
B = Unstandardized coefficients, β = Standardized coefficient
Fig. 8. Airway volume in relation to skeletal maturity.
Bonferroni’s Post Hoc test (* : p < 0.05)
(cc) 25 20 15 10 5 0
Air way v olume
Pre-peak Peak Post-peak
Fig. 9. Minimal cross-sectional area in relation to skeletal maturity. Bonferroni’s Post Hoc test (* : p < 0.05, NS = not significant)
Minimal cr oss-sectional ar ea
Pre-peak Peak Post-peak (mm
2)
250 200 150 100 50 0
NS
Ⅳ. Discussion
Growth and function of the upper airway space are closely associated with maxillofacial growth[11]. The upper airway dimensions have been reported to be influenced by posture, gender, age, obesity, and body mass index[12-14]. Growth- related and anatomical factors can be easily assessed using general orthodontic diagnostic data. It is clinically relevant to investigate which of these factors are most highly associated with upper airway dimension.
The importance and reliability of ANB angle are still con- troversial[15]. However, it is a commonly used cephalometric parameter in clinical orthodontics[16]. The ANB angle and the angle of convexity in the pre-pubertal assessment showed a high prediction accuracy for post-pubertal jaw relation- ships[17]; in this study, the ANB angle was used as the scale reflective of the sagittal relationship of the maxilla and man- dible.
Anatomical structures vary with growth and development.
There exist differences in upper airway assessment between adults and children[18]. In studies where 3D analyses of upper airways were performed in children, there was either a lack of airway delineation according to anatomical boundaries in chil- dren[19,20], and/or easily mobile soft-tissue landmarks were used[5,21]. Anandarajah et al .[9] proposed new reliable and reproducible upper airway margins to be used on CBCT scans of children for the assessment of upper airway dimensions.
Most of the studies on upper airway dimensions reported no gender differences[3,4,6,22]. There was no statistically sig- nificant gender difference in the airway dimensions in this study. In contrast, Alves et al .[23] reported gender differences in the retropalatal and retrolingual regions in patients with Class III malocclusion. Chiang et al .[24] reported that boys not only had a longer and larger airway than girls but also experi- enced a faster increase in dimensions.
In this study, upper airway dimensions increased from 8 to 15 years of age and showed a positive correlation with age.
This finding is in agreement with the report by Schendel et al .[25], who reported that airway dimensions consistently in- creased until about 20 years of age. Chiang et al .[24] found that the upper airway dimensions increased during a rapid period of craniofacial growth in patients between the ages of 8 and 18 years.
Although the walls of the upper airway are constructed of soft tissue structures that influence the luminal size, the cra-
niofacial osseous structures determine the general size of the upper airways[18]. Skeletal maturity is closely associated with upper airway dimensions in children. It was found that upper airway dimensions were smallest in patients before pubertal growth, and there was statistically significant differences be- tween growth stages[22,26]. In this study, the upper airway dimensions also increased during growth. These dimensional airway changes in relation to skeletal maturity could reflect the growth-related changes of bony structures surrounding the upper airways. There may be differences in skeletal maturity among the pre-peak, peak, and post-peak groups; future stud- ies will be needed to address such issues.
Many studies have reported the association between sagittal craniofacial dimensions and the upper airway space, with the upper airway space showing a negative correlation with the sagittal intermaxillary relationship[3-6,22]. Just as in previous studies, this study found that upper airway volume and the minimum cross-sectional area were negatively correlated with ANB and facial convexity. However, only the minimum cross- sectional area showed a statistically significant correlation. This may be because this study was conducted in skeletal Class Ⅱ patients, which makes the range of ANB and facial convex- ity were not significantly dissimilar. Mandibular body length showed a statistically significant correlation with upper airway volume, which was also confirmed in previous studies[3,27].
In relation to vertical craniofacial dimensions, correlations have been found between upper airway dimensions and anterior facial height. This is consistent with the findings of previous studies[3,27]. This indicates that patients with vertical growth patterns with a large anterior facial height are likely to have an expanded airway. However, there were several stud- ies that reported diverse relationships between upper airway dimensions and vertical growth patterns[28,29]. This difference may be due to the fact that there was variability within the study population, and the variables used to assess vertical cra- niofacial morphology patterns were different from those used in previous studies.
This study identified the association between transverse
craniofacial morphology and upper airway dimensions. Maxil-
lary width was found to be positively correlated with upper
airway volume. Mandibular width was found to be positively
correlated with upper airway volume and the minimum cross-
sectional area. Anandarajah et al .[22] reported that mandibular
width was significantly correlated with upper airway volume
and the minimum cross-sectional area, and that growing pa-
tients with a large sagittal intermaxillary relationship and nar- row mandibular width are particularly at risk of having narrow upper airway dimensions. In contrast, Di Carlo et al .[30] found no association between upper airway dimensions and cranio- facial morphology in all three planes. This discrepancy may be explained by the fact that the patients were scanned in the supine position and the population sample of this study were older than those in other studies.
This study conducted a multiple regression analysis using factors associated with upper airway dimensions. The airway volume was found to have the strongest association with AFH and age. The minimum cross-sectional area was found to have the strongest association with mandibular width and age.
The limitations of this study were that sample size was small and other functional factors influencing the upper airway space were not considered. More comprehensive investigations and large-scale studies should be carried out in the future to overcome the limitations of the present study. Nonetheless, this study conducted a multifactorial analysis of the upper air- way dimensions and verified that upper airway dimensions in skeletal Class Ⅱ children and adolescents were associated with age, skeletal maturity, and craniofacial morphology in all three planes.
Ⅴ. Conclusion
This study was conducted to investigate factors influencing the upper airway dimensions in skeletal Class Ⅱ children and adolescents using CBCT images. Upper airway space did not show gender differences, but showed significant associations with age, skeletal maturity, and craniofacial morphology in all three planes. In skeletal Class Ⅱ children and adolescents, the risk of a reduced upper airway space is higher in those who are younger and have smaller anterior facial height and man- dibular width.
Authors’ Information
Byounghwa Kim https://orcid.org/0000-0002-5606-4869 Jewoo Lee https://orcid.org/0000-0001-9640-4752 Jiyoung Ra https://orcid.org/0000-0002-2569-3259
References
1. Guijarro Martinez R, Swennen GR : Cone-beam computer-
ized tomography imaging and analysis of the upper airway:
a systematic review of the literature. Int J Oral Maxillofac Surg , 40:1227-1237, 2011.
2. Flores Mir C, Korayem M, Major PW, et al . : Craniofacial morphological characteristics in children with obstructive sleep apnea syndrome: a systematic review and meta- analysis. J Am Dent Assoc , 144:269-277, 2013.
3. Kim YJ, Hong JS, Hwang YI, Park YH : Three-dimensional analysis of pharyngeal airway in preadolescent children with different anteroposterior skeletal patterns. Am J Or- thod Dentofacial Orthop , 137:1-11, 2010.
4. Oh KM, Hong JS, Park YH, et al . : Three-dimensional analy- sis of pharyngeal airway form in children with anteroposte- rior facial patterns. Angle Orthod , 81:1075-1082, 2011.
5. Alves M, Franzotti ES, Ruellas AC, et al . : Evaluation of pha- ryngeal airway space amongst different skeletal patterns.
Int J Oral Maxillofac Surg , 41:814-819, 2012.
6. Zheng ZH, Yamaguchi T, Maki K, et al . : Three-dimensional evaluation of upper airway in patients with different an- teroposterior skeletal patterns. Orthod Craniofac Res , 17:38- 48, 2014.
7. Arens R, McDonough JM, Pack AI, et al . : Upper airway size analysis by magnetic resonance imaging of children with obstructive sleep apnea syndrome. Am J Respir Crit Care Med , 167:65-70, 2003.
8. Kim DY, Lee DW, Kim JG, Yang YM : Relationship between Upper Airway and Sleep-Disordered Breathing in Children with Mouth Breathing. J Korean Acad Pediatr Dent , 46:38- 47, 2019.
9. Anandarajah S, Abdalla Y, Dudhia R, Sonnesen L : Proposal of new upper airway margins in children assessed by CBCT.
Dentomaxillofac Radiol , 44:20140438, 2015.
10. Baccetti T, Franchi L, McNamara JA : The cervical vertebral maturation (CVM) method for the assessment of optimal treatment timing in dentofacial orthopedics. Semin Orthod , 11:119-129, 2005.
11. Donner MW, Bosma JF, Robertson DL : Anatomy and physiology of the pharynx. Gastrointest Radiol , 10:196-212, 1985.
12. Block AJ, Faulkner JA, Thach B, et al . : Clinical conference in pulmonary disease. Factors influencing upper airway clo- sure. Chest , 86:114-122, 1984.
13. Ronen O, Malhotra A, Pillar G : Influence of gender and
age on upper-airway length during development. Pediat-
rics , 120:1028-1034, 2007.
14. Mayer P, Pepin J, Deschaux C, et al . : Relationship between body mass index, age and upper airway measurements in snorers and sleep apnea patients. Eur Respir J , 9:1801-1809, 1996.
15. Hussels W, Nanda RS : Analysis of factors affecting angle ANB. Am J Orthod , 85:411-423, 1984.
16. Del Santo M : Influence of occlusal plane inclination on ANB and Wits assessments of anteroposterior jaw relation- ships. Am J Orthod Dentofacial Orthop , 129:641-648, 2006.
17. Ishikawa H, Nakamura S, Iwasaki H, Kitazawa S : Seven pa- rameters describing anteroposterior jaw relationships: post- pubertal prediction accuracy and interchangeability. Am J Orthod Dentofacial Orthop , 117:714-720, 2000.
18. Tourne LP : Growth of the pharynx and its physiologic im- plications. Am J Orthod Dentofacial Orthop , 99:129-139, 1991.
19. El H, Palomo JM : An airway study of different maxillary and mandibular sagittal positions. Eur J Orthod , 35:262- 270, 2013.
20. El H, Palomo JM : Three-dimensional evaluation of upper airway following rapid maxillary expansion: a CBCT study.
Angle Orthod , 84:265-273, 2014.
21. Alves M, Baratieri C, Ruellas AC, et al . : Three-dimensional assessment of pharyngeal airway in nasal- and mouth- breathing children. Int J Pediatr Otorhinolaryngol , 75:1195- 1199, 2011.
22. Anandarajah S, Dudhia R, Sandham A, Sonnesen L : Risk factors for small pharyngeal airway dimensions in pre- orthodontic children: A three-dimensional study. Angle Or- thod , 87:138-146, 2017.
23. Alves PV, Zhao L, Bolognese AM, et al . : Three-dimensional cephalometric study of upper airway space in skeletal class II and III healthy patients. J Craniofac Surg , 19:1497-1507, 2008.
24. Chiang CC, Jeffres MN, Miller A, Hatcher DC : Three- dimensional airway evaluation in 387 subjects from one university orthodontic clinic using cone beam computed tomography. Angle Orthod , 82:985-992, 2012.
25. Schendel SA, Jacobson R, Khalessi S : Airway growth and development: a computerized 3-dimensional analysis. J Oral Maxillofac Surg , 70:2174-2183, 2012.
26. Cheon MK, Yang SM, Choi NK, et al . : Pharyngeal Airway Dimensions in Skeletal Class II Young Adolescents: Cepha- lometric Study. J Korean Acad Pediatr Dent , 45:98-108, 2018.
27. Lee YS, Kim JC : A cephalometric study on the airway size according to the types of the malocclusion. Korean J Or- thod , 25:19-29, 1995.
28. Kim YI, Kim SS, Son WS, Park SB : Pharyngeal airway analy- sis of different craniofacial morphology using cone-beam computed tomography (CBCT). Korean J Orthod , 39:136- 145, 2009.
29. de Freitas MR, Alcazar NMPV, Henriques JFC, et al . : Upper and lower pharyngeal airways in subjects with Class I and Class II malocclusions and different growth patterns. Am J Orthod Dentofac , 130:742-745, 2006.
30. Di Carlo G, Polimeni A, Melsen B, Cattaneo PM : The rela-
tionship between upper airways and craniofacial morphol-
ogy studied in 3D: A CBCT study. Orthod Craniofac Res ,
18:1-11, 2015.
국문초록
골격성 Ⅱ급 소아∙청소년의 상기도 공간에 영향을 미치는 요인 : CBCT 연구
김병화
1ㆍ이제우
2ㆍ라지영
21
원광대학교 치과대학 소아치과학교실
2