© 2018 The Korean Ophthalmological Society
This is an Open Access article distributed under the terms of the Creative Commons Attribution Non-Commercial License (http://creativecommons.org/licenses /by-nc/3.0/) which permits unrestricted non-commercial use, distribution, and reproduction in any medium, provided the original work is properly cited.
Original Article
Comparative Efficacy of the New Optical Biometer on Intraocular Lens Power Calculation (AL-Scan versus IOLMaster)
Ahnul Ha1, Won Ryang Wee1,2, Mee Kum Kim1,2
1Department of Ophthalmology, Seoul National University College of Medicine, Seoul, Korea
2Laboratory of Ocular Regenerative Medicine and Immunology, Seoul Artificial Eye Center, Seoul National University Hospital Biomedical Research Institute, Seoul, Korea
Purpose: To evaluate the agreement in axial length (AL), keratometry, and anterior chamber depth measurements between AL-Scan and IOLMaster biometers and to compare the efficacy of the AL-Scan on intraocular lens (IOL) power calculations and refractive outcomes with those obtained by the IOLMaster.
Methods: Medical records of 48 eyes from 48 patients who underwent uneventful phacoemulsification and IOL insertion were retrospectively reviewed. One of the two types of monofocal aspheric IOLs were implanted (Tecnis ZCB00 [n = 34] or CT Asphina 509M [n = 14]). Two different partial coherence interferometers measured and compared AL, keratometry (2.4 mm), anterior chamber depth, and IOL power calculations with SRK/T, Hoffer Q, Holladay2, and Haigis formulas. The difference between expected and actual final refractive error was compared as refractive mean error (ME), refractive mean absolute error (MAE), and median absolute error (MedAE).
Results: AL measured by the AL-Scan was shorter than that measured by the IOLMaster (p = 0.029). The IOL power of Tecnis did not differ between the four formulas; however, the Asphina measurement calculated using Hoffer Q for the AL-Scan was lower (0.28 diopters, p = 0.015) than that calculated by the IOLMaster. There were no statistically significant differences between the calculations by MAE and MedAE for the four formulas in either IOL. In SRK/T, ME in Tecnis-inserted eyes measured by AL-Scan showed a tendency toward myopia (p = 0.032).
Conclusions: Measurement by AL-Scan provides reliable biometry data and power calculations compared to the IOLMaster; however, refractive outcomes of Tecnis-inserted eyes by AL-Scan calculated using SRK/T can show a slight myopic tendency.
Key Words: AL-Scan, Intraocular power calculation, IOLMaster, Optical biometer
As modern techniques in cataract surgery develop to con- trol refractive outcomes with ever increasing accuracy, cata-
ract surgery is now regarded as a form of refractive surgery [1]. Therefore, accurate measurements of ocular parameters and optimal formula selection are important for achieving better refractive results. The crucial ocular parameters for power calculation include axial length (AL), corneal kera- tometry (K) values, and anterior chamber depth (ACD) [2].
Since the introduction of the first optical biometer (IOL- Master; Carl Zeiss Meditec, Jena, Germany) in 1999, the
Received: May 22, 2017 Accepted: September 11, 2017
Corresponding Author: Mee Kum Kim, MD, PhD. Department of Oph- thalmology, Seoul National University College of Medicine, #103 Dae- hak-ro, Jongno-gu, Seoul 03080, Korea. Tel: 82-2-2072-2665, Fax: 82-2- 741-3187, E-mail: [email protected]
IOLMaster is still considered the gold standard for AL mea- surement because of its accuracy and reproducibility [3].
The IOLMaster uses partial coherence interferometry (PCI), with a 780-nm laser diode infrared light for measuring AL [4]. Dual-beam PCI is applied to measure the length from the anterior surface of the cornea to the retinal pigment epi- thelium [5]. The K readings are calculated by analyzing the anterior corneal curvature at six reference points in a 2.5-mm-diameter optical zone. ACD is measured through lateral slit illumination [4].
In 2012, a novel optical biometer, AL-Scan (Nidek Co, Aichi, Japan), was introduced for clinical practice. AL-Scan uses an 830-nm infrared laser diode for AL measurement with a PCI [1]. K readings are measured using a double-ring keratometer, at two diameters (2.4 and 3.3 mm). The ACD is calculated using a rotating Scheimpflug camera. Compared to the IOLMaster, AL-Scan facilitates use by three-dimen- sional auto-tracking and auto-shot measurements [6].
It is essential to validate the accuracy of a newly adopted device by comparing it to the most commonly used instru- ment in clinical practice. There are few studies reporting the reliability of ocular measurement or IOL power prediction by AL-Scan compared to the IOLMaster [6,7]. To the best our knowledge, no data is available on assessment of IOL power calculations using four different formulas in two bi- ometers. The aim of the present study was to compare ocu- lar measurements by the AL-Scan biometer with those of the IOLMaster and to assess the accuracy of IOL power cal- culations by SRK/T, Hoffer Q, Holladay2, and Haigis for- mulas in patients who underwent phacoemulsification and implantation of one of two different types of intraocular lenses: Tecnis ZCB00 (AMO, Santa Ana, CA, USA) or CT Asphina 509M (Carl Zeiss Meditec).
Materials and Methods
Patients and methods
The study protocol adhered to the tenets of the Declara- tion of Helsinki. This study was approved by the institu- tional review board of Seoul National University Hospital (1601-003-729) and the informed consent was waived. All patients referred to department of ophthalmology, Seoul National University Hospital, Korea, for cataract surgery between September 2014 and January 2015 were considered
for inclusion in the present study. Detailed demographic data and the results of ophthalmologic examinations were retrospectively reviewed.
Only those subjects whose ALs were between 21 and 27 mm and who underwent uneventful cataract surgery were included. Subjects with any previous ophthalmic surgery or active ocular pathology, including zonular weakness or macula lesions, were excluded. Subjects with unobtainable ocular biometric values because of severe posterior capsu- lar opacity were also excluded. The order of the instru- ments used for measurement was randomly determined for each patient. All examinations were carried out by a single experienced operator. Unreliable data, such as a signal-to- noise ratio less than 2.1 for either device, were excluded from the analysis [8].
A single experienced surgeon (MKK) performed all sur- geries with a 2.7-mm-long, steep axis incision technique, and the IOL was implanted in the bag. One of the two types of monofocal aspheric IOLs was implanted. We chose the Tecnis ZCB00 IOL because it is one of the most com- monly used one-piece IOLs with hydrophobic acrylic. CT Asphina 509M is a hydrophilic acrylic IOL treated with a hydrophobic coat with square edges. Thus, different mate- rial properties as well as the refractive index can affect the penetration of infrared light in each optical biometer.
Therefore, we investigated the comparative efficacy of two biometers in each IOL. The expected refractive result was emmetropia or as close to emmetropia as possible, based on increments of IOL power. To compare postoperative pre- dictability, the difference between expected refractive error and actual refractive error was compared between AL- Scan and IOLMaster groups. Refractive mean error (ME) was calculated as postoperative spherical equivalent minus predicted postoperative spherical equivalent, and refractive mean absolute error (MAE) and median absolute error (MedME) were defined as the average and median absolute value of the numeric error, respectively. These values were used to compare postoperative predictability. To evaluate agreement between formulas, the standard deviation and variance of ME values were used. The final refractions were performed four weeks after the cataract surgery.
Formula constants
In the IOLMaster device, predictions made using the SRK/T, Hoffer Q, Holladay2, and Haigis formulas were
retrospectively optimized by adjusting a0, a1, and a2; per- sonalized anterior chamber depth (pACD); surgeon factor (SF); and A constants. In the AL-Scan biometer, the con- stants were applied as follows in accordance with the man- ufacturer’s recommendations: Tecnis – a0 = -1.177, a1 = 0.191, a2 = 0.248, pACD = 5.79, SF = 2.02, and A constant = 119.3; Asphina – a0 = 0.680, a1 = 0.400, a2 = 0.100, pACD
= 4.90, SF = 1.12, and A constant = 117.9.
Statistical analysis
Statistical analyses were performed using PASW Statis- tics ver. 18.0 (SPSS Inc., Chicago, IL, USA). Paired t-tests were used to establish whether there was a significant sys- tematic bias between the two devices. Bland-Altman plots were used to determine agreement between the two biome- ters [9]. The Wilcoxon signed-rank test was used to evalu- ate the differences in MAE, MedAE, and variance by the formulas for the two devices. Statistical significance was defined as a p-value <0.05 (two-tailed).
Results
Forty-eight eyes of 48 patients (37 women, 11 men) were included in this study. The mean age of the patients was 69.04 ± 10.98 years (range, 43 to 87 years). Tecnis ZCB00 and CT Asphina 509M implants were placed in 34 and 14 eyes, respectively.
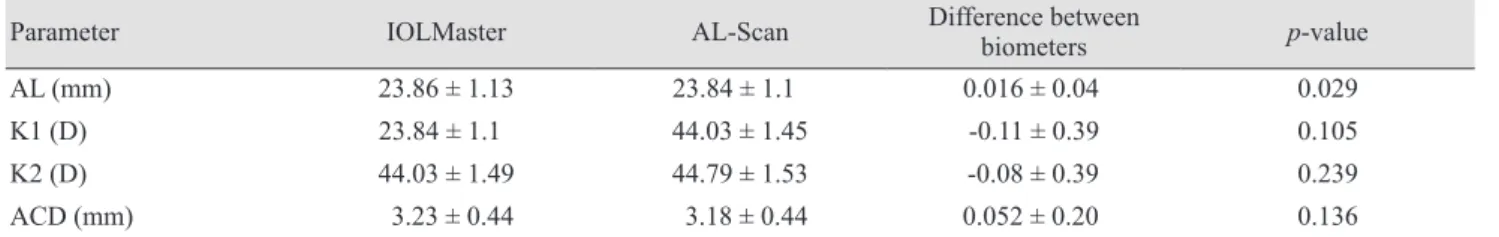
The mean difference in AL measurements between the two devices was 0.016 ± 0.04 mm, which was statistically significant (p = 0.029, paired t-test). The AL-Scan and IOLMaster provided a comparable mean K value of 2.4 mm. The mean difference was 0.11 ± 0.39 diopters (D) (K1) and 0.08 ± 0.39 D (K2), respectively. This value was not statistically significant (p = 0.105 and p = 0.239, paired t-test). The two biometers provided equal ACD measures, with a difference of 0.052 ± 0.20 mm (p = 0.136, paired t-test) (Table 1).
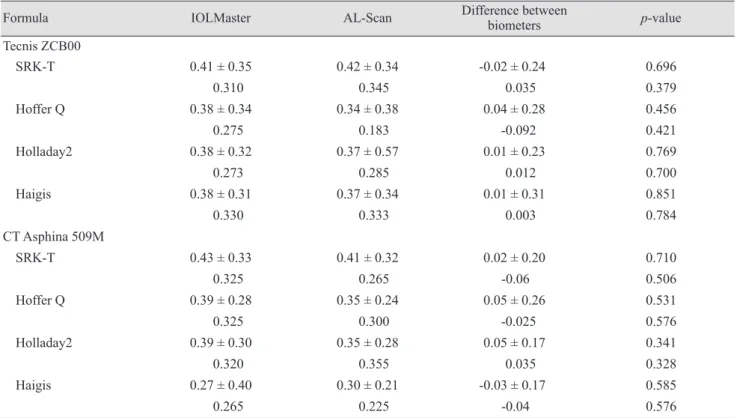
For the Tecnis IOL, the AL-Scan and IOLMaster provid- ed comparable mean IOL power calculations for the four formulas. For the CT Asphina 509M, mean IOL power cal- culations by the SRK/T, Holladay2, and Haigis formulas Table 1. Comparison of biometric measurements between the two biometers (48 patients)
Parameter IOLMaster AL-Scan Difference between
biometers p-value
AL (mm) 23.86 ± 1.13 23.84 ± 1.1 0.016 ± 0.04 0.029
K1 (D) 23.84 ± 1.1 44.03 ± 1.45 -0.11 ± 0.39 0.105
K2 (D) 44.03 ± 1.49 44.79 ± 1.53 -0.08 ± 0.39 0.239
ACD (mm) 3.23 ± 0.44 3.18 ± 0.44 0.052 ± 0.20 0.136
Values are presented as mean ± standard deviation.
AL = axial length; K = keratometry; D = diopters; ACD = anterior chamber depth.
Table 2. Comparison of intraocular lens power between the two biometers
Formula IOLMaster AL-Scan Difference between
biometers p-value
Tecnis ZCB00
SRK-T 19.61 ± 3.02 19.71 ± 3.06 -0.09 ± 0.40 0.190
Hoffer Q 19.40 ± 3.19 19.41 ± 3.26 -0.01 ± 0.51 0.885
Holladay2 19.48 ± 3.06 19.57 ± 0.53 -0.09 ± 0.46 0.280
Haigis 19.52 ± 2.93 19.53 ± 2.99 -0.003 ± 0.53 0.974
CT Asphina 509M
SRK-T 17.75 ± 3.83 17.65 ± 3.69 0.10 ± 0.46 0.250
Hoffer Q 17.45 ± 4.03 17.17 ± 3.86 0.28 ± 0.59 0.015
Holladay2 17.61 ± 3.95 17.49 ± 3.86 0.12 ± 0.51 0.220
Haigis 17.51 ± 3.82 17.34 ± 3.68 0.16 ± 0.54 0.220
Values are presented as mean ± standard deviation.
were comparable between the two devices; however, when using the Hoffer Q formula, mean IOL power calculated by AL-Scan was lower than that calculated by IOLMaster.
The difference between the calculations by the two devices was 0.28 ± 0.59 D (p = 0.015, paired t-test) (Table 2).
For the eyes implanted with a Tecnis ZCB00 IOL (34 eyes), there were no statistically significant differences for
objective MAE and MedAE between the devices with the four formulas. Also, in eyes implanted with a CT Asphina 509M (14 eyes), the two devices showed comparable MAE and MedAE results for all four formulas (Wilcoxon signed rank test) (Table 3).
The ME values for Tecnis ZCB00-implanted eyes calcu- lated using Hoffer Q, Holladay2, and Haigis formulas by Table 3. Comparison of refractive mean absolute error and median absolute error between the two biometers
Formula IOLMaster AL-Scan Difference between
biometers p-value
Tecnis ZCB00
SRK-T 0.41 ± 0.35 0.42 ± 0.34 -0.02 ± 0.24 0.696
0.310 0.345 0.035 0.379
Hoffer Q 0.38 ± 0.34 0.34 ± 0.38 0.04 ± 0.28 0.456
0.275 0.183 -0.092 0.421
Holladay2 0.38 ± 0.32 0.37 ± 0.57 0.01 ± 0.23 0.769
0.273 0.285 0.012 0.700
Haigis 0.38 ± 0.31 0.37 ± 0.34 0.01 ± 0.31 0.851
0.330 0.333 0.003 0.784
CT Asphina 509M
SRK-T 0.43 ± 0.33 0.41 ± 0.32 0.02 ± 0.20 0.710
0.325 0.265 -0.06 0.506
Hoffer Q 0.39 ± 0.28 0.35 ± 0.24 0.05 ± 0.26 0.531
0.325 0.300 -0.025 0.576
Holladay2 0.39 ± 0.30 0.35 ± 0.28 0.05 ± 0.17 0.341
0.320 0.355 0.035 0.328
Haigis 0.27 ± 0.40 0.30 ± 0.21 -0.03 ± 0.17 0.585
0.265 0.225 -0.04 0.576
Values are presented as mean ± standard deviation or median.
Table 4. Comparison of mean refractive error between the two biometers
Formula IOLMaster AL-Scan Difference between
biometers p-value
Tecnis ZCB00
SRK-T -0.11 ± 0.53 -0.21 ± 0.51 0.10 ± 0.26 0.032
Hoffer Q -0.04 ± 0.51 -0.07 ± 0.51 0.03 ± 0.31 0.647
Holladay2 -0.09 ± 0.49 -0.17 ± 0.48 0.08 ± 0.28 0.103
Haigis -0.10 ± 0.49 -0.12 ± 0.50 0.02 ± 0.33 0.635
CT Asphina 509M
SRK-T -0.31 ± 0.45 -0.36 ± 0.38 0.04 ± 0.24 0.428
Hoffer Q -0.21 ± 0.44 -0.20 ± 0.38 0.01 ± 0.28 0.862
Holladay2 -0.29 ± 0.40 -0.31 ± 0.09 0.02 ± 0.19 0.761
Haigis -0.24 ± 0.29 -0.24 ± 0.08 0.02 ± 0.23 0.971
Values are presented as mean ± standard deviation.
the two devices were not statistically different. When us- ing the SRK/T formula, the ME of Tecnis ZCB00-im- planted eyes by AL-Scan tended to be myopic (p = 0.032,
paired t-test). The ME measurements of CT Asphina 509M-implanted eyes were comparable among the four formulas (Table 4).
Table 5. Comparison of distribution of mean refractive error
Formula IOLMaster AL-Scan Difference between
biometers p-value
Tecnis ZCB00
Standard deviation 0.13 ± 0.06 0.15 ± 0.06 -0.0227 ± 0.06 0.026
Variance 0.020 ± 0.02 0.026 ± 0.02 -0.006 ± 0.02 0.044
CT Asphina 509M
Standard deviation 0.12 ± 0.07 0.15 ± 0.07 -0.02 ± 0.04 0.046*
Variance 0.020 ± 0.02 0.022 ± 0.03 -0.002 ± 0.02 0.345*
*Wilcoxon signed rank test.
Fig. 1. Bland-Altman plots of biometric measurements from the AL-Scan and IOLMaster. (A) Mean axial length (AL), (B) mean ker- atometry 1 (K1), (C) mean K2, and (D) mean anterior chamber depth (ACD) with both biometers. D = diopters.
Difference between biometers (mm)
Mean AL with both biometers (mm) 0.10
0.05
0.00
-0.05
-0.10
21.0 22.0 23.0 24.0 25.0 26.0 27.0
-1.96SD -0.063 +1.96SD 0.096
Difference between biometers (D)
Mean K1 with both biometers (D) 0.80
0.30
-0.20
-0.70
-1.20
40.0 42.0 44.0 46.0
-1.96SD -0.792 +1.96SD 0.629
Difference between biometers (D)
Mean K2 with both biometers (D) 1.00
0.50
0.00
-0.50
-1.00
48.0
42.0 44.0 46.0
-1.96SD -0.774 +1.96SD 0.636
Difference between biometers (mm)
Mean ACD with both biometers (mm) 0.80
0.60 0.40 0.20 0.00 -0.20 -0.40
2.0 2.5 3.0 3.5 4.0 4.5
-1.96SD -0.282 +1.96SD 0.385
A
C D
B
In Tecnis ZCB00-implanted eyes, the variance of ME calculations by the four formulas was higher for the AL- Scan than for the IOLMaster. The difference between de- vices was 0.023 ± 0.06 for standard deviation and 0.006 ± 0.02 for variance (p = 0.026 and p = 0.044, paired t-test). In CT Asphina 509M-implanted eyes, the two devices showed similar variance in ME calculations by the four formulas;
however, the standard deviation for measurements by the four formulas using AL-Scan was greater (p = 0.046, Wil- coxon signed rank test) than that for measurements by the IOLMaster (Table 5). Fig. 1 shows the Bland-Altman plots and 95% limits of agreement between the two devices.
Overall, the values of ocular parameters with the two de- vices showed high agreement and narrow 95% limits of agreement.
Discussion
An accurate IOL power calculation is crucial for achiev- ing satisfactory outcomes after cataract surgery. At present, optical biometry with the IOLMaster is considered the gold standard for AL measurements due to its good reproduc- ibility and accuracy. The AL-Scan is a recently introduced optical biometer, and there were a few published studies that evaluated the both AL-Scan and IOLMaster. Huang et al. [6] and Kola et al. [10] demonstrated that ocular parame- ter measurements with the AL-Scan revealed excellent reli- ability and reproducibility. There were no statistically sig- nificant differences, and they showed narrow 95% limits of agreement for AL, ACD, and most K values between the two instruments. IOL power calculations using the SRK/T, Hoffer Q, Holladay2, and Haigis formulas revealed no sig- nificant differences between the AL-Scan and IOLMaster.
Kaswin et al. [7] also reported excellent correlations be- tween the two devices for AL and ACD measurements and K readings. The IOL power calculations using the SRK/T and Haigis formulas were highly comparable between the devices. The MAE measures for 50 eyes implanted with ei- ther of the two hydrophobic, single-piece, monofocal, aspheric IOLs, the Acrysof SN60WF (Alcon Laboratories, Fort Worth, TX, USA) and the Tecnis ZCB00 (Abbott Medical Optics, Santa Ana, CA, USA), were statistically equivalent.
In the present study, the mean difference in AL measure- ments between the two devices was statistically significant
(0.016 ± 0.04 mm, p = 0.029). In a previous study by Huang et al. [6], patients with severe advanced cataract were ex- cluded based on the Lens Opacities Classification System III [11]. In contrast, we included patients irrespective of cataract grade, excluding only cases of dense posterior cap- sular opacity resulting in measurement failure with either one of the optical biometers. PCI measures axial eye lengths parallel to the vision axis as the patient fixates on the measurement beam or a coaxial fixation beam [5].
Thus, it is possible that outliers due to fixation problems in eyes with dense cataract led to the significant mean differ- ence in AL between the two devices [12]. Even with correct alignment and accurate fixation, the measurement can be affected by the refractive index of the lens, which also var- ies with cataract grade. Severe nuclear cataract slightly in- creases the refractive index [13]. The IOLMaster and AL- Scan use different wavelengths of infrared light (780 and 830 nm, respectively), and longer wavelengths are able to penetrate tissue more deeply. Therefore, in addition to lens opacity, penetration depth can influence the measurement of AL [12,14]. The use of a longer wavelength resulted in a shorter measured optical distance [15]. Drexler et al. [5]
demonstrated that AL measurement precision using PCI did not correlate with AL, but with cataract grade.
There was no positive or negative trend with either de- vice, indicating that neither the IOLMaster nor the AL- Scan tends to overestimate or underestimate measurements in relation to the other device. In an average eye, a 0.10 mm error in AL is equivalent to an error of about 0.27 D in the spectacle plane [2]. Therefore, an average difference of 0.016 ± 0.04 mm was statistically significant, but it was too small to exert a significant effect on the final refractive outcome.
We assessed the accuracy of IOL power calculations us- ing the SRK/T, Hoffer Q, Holladay2, and Haigis formulas in two different types of intraocular lenses: Tecnis ZCB00 and CT Asphina 509M. Even though AL measurements differed between the two devices, mean IOL power calcu- lations using the SRK/T, Hoffer Q, Holladay2, and Haigis formulas were comparable for the Tecnis IOL. However, with the CT Asphina 509M IOL, the mean IOL power cal- culated by the AL-Scan using the Hoffer Q formula was lower than that calculated by the IOLMaster (0.28 ± 0.59, p
= 0.015). Steep keratometric values can contribute to lower IOL power with the AL-Scan (mean average of K, 43.98 in IOLMaster vs. 44.41 in AL-Scan). In addition, the IOL
power to achieve emmetropia is determined by the AL, K value, types of formulas that applied. Each formula esti- mates the effective lens position (ELP) in its own way. The SRK/T and Hoffer Q are two-variable formulas that rely on AL and central corneal power to predict the ELP. In the SRK/T formula, ACD is calculated using the Fedorov cor- neal height equation. On the other hand, the Hoffer Q for- mula applies a self-developed tangent curve to obtain the ACD. Additionally, the Haigis formula considers AL, K value, and also ACD when predicting ELP. The Holladay2 formula uses a white-to-white diameter in addition to the AL, K value, and ACD. As such, discrepancies in IOL power can be caused by the method used to predict ACD.
Additionally, discrepancy in the IOL power calculations can be due to systematic errors in biometry, surgical tech- nique, and the formulas [16]. The individual errors that arise between these multiple factors can cause a significant difference in power calculations for the CT Asphina 509M IOL, using the Hoffer Q formula.
MAEs and MedAEs for the two devices calculated using the four formulas were statistically equivalent. Although there was no statistical significance, the ME for Tecnis ZCB00 IOL tended to be lower with the AL-Scan. When using the SRK/T formula, the difference was 0.10 ± 0.26, which was statistically significant (p = 0.032). This differ- ence could be caused by steep keratometric values (mean average of K, 43.98 in the IOLMaster vs. 44.41 in the AL- Scan). Considering that the SRK/T and Hoffer Q formulas are two-variable formulas, they appeared to be more af- fected by changes in keratometric values than the Haigis and Holladay2 formulas.
Less between-formula concurrence was observed in the AL-Scan. This suggests that the MEs estimated by the AL- Scan showed greater deviation and variance between the formulas compared with those by the IOLMaster. If the keratometric values or axial lengths were outside normal ranges, “between-formula concurrence” would be signifi- cantly reduced regardless of the type of biometer. Our study investigated the refractive outcomes using normal ranges of keratometric values and axial lengths to validate the accuracy of the measurement in each biometer. In other words, MEs with four different formulas (SRK/T, Hoffer Q, Holladay, and Haigis) were in significantly better agree- ment in the IOLMaster with normal ranges of keratometric values and axial lengths. This suggests that measurements in the IOLMaster can be more reliable than in the AL-Scan
when subjects have normal keratometric values and axial lengths.
The primary goal of the current study was not to com- pare differences between the two IOLs, but rather to com- pare the results of the two biometers (IOLMaster vs. AL- Scan) in each IOL type. We wanted to determine whether the difference between the two biometry devices would be affected by the type of IOL. IOL power formulas use cer- tain constants that are specific to each formula [17]. These constants adjust IOL predictions for systematic errors aris- ing from the clinical environment. Thus, in order to im- prove accuracy, individual customization of these constants by analyzing larger postoperative data is important [17,18].
Individual customization of “A constant” of the lens or re- fractive index can affect the clinical outcome depending on the type of IOL. In the present study, the measurement of the IOLMaster was previously optimized for both IOLs.
However, the constants used for the AL-Scan were pre-op- timized values, as we had not accumulated enough data for its optimization. Therefore, the current study was limited by the inability to directly compare outcomes between the two types of different IOLs. Further research with opti- mized constant values for the AL-Scan is warranted to ob- tain a more accurate comparison between the two biome- ters.
In conclusion, compared to the IOLMaster, the AL-Scan optical biometer provides highly accurate biometry data and IOL power calculations in patients with cataract. How- ever, refractive outcomes obtained using the AL-Scan showed a tendency toward myopia and had less between- formula concurrence. These results suggest that the AL- Scan can be used in routine clinical practice for accurate biometry measurements, and further individual customiza- tion of constants would lead to better refractive outcomes.
Conflict of Interest
No potential conflict of interest relevant to this article was reported.
References
1. Fontes BM, Fontes BM, Castro E. Intraocular lens power calculation by measuring axial length with partial optical
coherence and ultrasonic biometry. Arq Bras Oftalmol 2011;74:166-70.
2. Olsen T. Calculation of intraocular lens power: a review.
Acta Ophthalmol Scand 2007;85:472-85.
3. Shammas HJ, Chan S. Precision of biometry, keratometry, and refractive measurements with a partial coherence in- terferometry-keratometry device. J Cataract Refract Surg 2010;36:1474-8.
4. Santodomingo-Rubido J, Mallen EA, Gilmartin B, Wolffsohn JS. A new non-contact optical device for ocular biometry. Br J Ophthalmol 2002;86:458-62.
5. Drexler W, Findl O, Menapace R, et al. Partial coherence interferometry: a novel approach to biometry in cataract surgery. Am J Ophthalmol 1998;126:524-34.
6. Huang J, Savini G, Li J, et al. Evaluation of a new optical biometry device for measurements of ocular components and its comparison with IOLMaster. Br J Ophthalmol 2014;98:1277-81.
7. Kaswin G, Rousseau A, Mgarrech M, et al. Biometry and intraocular lens power calculation results with a new opti- cal biometry device: comparison with the gold standard. J Cataract Refract Surg 2014;40:593-600.
8. Olsen T, Thorwest M. Calibration of axial length measure- ments with the Zeiss IOLMaster. J Cataract Refract Surg 2005;31:1345-50.
9. Bland JM, Altman DG. Statistical methods for assessing agreement between two methods of clinical measurement.
Lancet 1986;1:307-10.
10. Kola M, Duran H, Turk A, et al. Evaluation of the repeat- ability and the reproducibility of AL-Scan measurements obtained by residents. J Ophthalmol 2014;2014:739652.
11. Freeman G, Pesudovs K. The impact of cataract severity on measurement acquisition with the IOLMaster. Acta Oph- thalmol Scand 2005;83:439-42.
12. Eleftheriadis H. IOLMaster biometry: refractive results of 100 consecutive cases. Br J Ophthalmol 2003;87:960-3.
13. Prinz A, Neumayer T, Buehl W, et al. Influence of severity of nuclear cataract on optical biometry. J Cataract Refract Surg 2006;32:1161-5.
14. Faria-Ribeiro M, Lopes-Ferreira D, Lopez-Gil N, et al. Er- rors associated with IOLMaster biometry as a function of internal ocular dimensions. J Optom 2014;7:75-8.
15. Drexler W, Hitzenberger CK, Baumgartner A, et al. Inves- tigation of dispersion effects in ocular media by multiple wavelength partial coherence interferometry. Exp Eye Res 1998;66:25-33.
16. Olsen T. Sources of error in intraocular lens power calcula- tion. J Cataract Refract Surg 1992;18:125-9.
17. Holladay JT, Prager TC, Chandler TY, et al. A three-part system for refining intraocular lens power calculations. J Cataract Refract Surg 1988;14:17-24.
18. Sheard R. Optimising biometry for best outcomes in cata- ract surgery. Eye (Lond) 2014;28:118-25.