Portion sizes of foods frequently consumed by the Korean elderly: Data from KNHANES IV-2
Sook-Bae Kim
1, Soon-Kyung Kim
2, Se-Na Kim
3, So-Young Kim
3, Young-Sook Cho
3and Mi-Hyun Kim
4§1
Department of Food Science and Human Nutrition, Research Institute of Human Ecology, Chonbuk National University, Deokjin-dong, Deokjin-gu, Jeonbuk 561-756, Korea
2
Department of Food Sciences and Nutrition, Soonchunhyang University, Asan 336-745, Korea
3
Department of Agrofood Resources, NAAS, RDA, Gyeonggi 441-853, Korea
4
Department of Food and Nutrition, Kangwon National University, San 253 Gyo-dong, Samcheok, Gangwon 245-711, Korea
Abstract
The purpose of this study was to define a one-portion size of food frequently consumed by the Koreans aged 65 years or over. From the original 8,631 people who took part in the Forth Korea National Health and Nutrition Examination Survey(KNHANES IV-2) 2008, we analyzed the data on 1,458 persons (16.9%) aged 65 and over, and selected food items consumed based on the intake frequency of 30 or more by all participant.
A total of 158 varieties of food items were selected. The portion size of food items was set on the basis of the median amount (50 percentile) in a single intake by a single person. In the cereals category, 13 items were selected, of which the most frequently consumed item was well-polished rice with portion size of 75 g. Among legumes, 7 items were selected, of which the most frequent item was dried black soybean with a portion size of 6 g. Among the 16 groups, the most varied food group (49 items) was vegetables, and among these the most frequently occurring item was garlic (5 g), while among the fruit group, only 11 items were selected, as their intake frequency was low. Fish and shellfish were more frequently consumed by the elderly than meats. The most frequently consumed meat was pork loin, with a portion size of 30 g. In fish and shellfish, the most frequently consumed item was dried and boiled large anchovy with a portion size of 2 g. Portion sizes for food items consumed regularly by the elderly may be conveniently and effectively used in dietary planning and in nutritional education programs, and in assessing the diet intake status of the elderly.
Key Words: Portion size, Korean elderly, foods frequently consumed
Introduction
9)As the elderly population increases, public awareness about health and nutrition in the elderly is gradually increasing as well.
Older people are generally more likely to have chronic diseases such as hypertension, diabetes, osteoporosis, and so on, many of which require continuous diet therapy for both prevention and treatment. Because of this, the interest in the nutritional values of food items and the desire to understand related information rise, particularly as related to the elderly population.
An effective way to obtain credible information about the nutritional values of food items is by using a food composition table. In Korea, food composition tables have been published and updated since 1970 by the Rural Development Administration (RDA), and their most recent food composition table is in its 7
thedition [1]. This table can supply credible data about the various nutritional values of over 2,505 food items, but using this resource may not be easy for the general population: as the
nutrient contents in food items are expressed per 100 g of an edible portion of each food item, it is necessary to convert the contents per 100 g into those per the actual intake quantity [2].
However, in the United States (US) and Japan, there have been food composition tables created based on the portion sizes of an individual’s single intake which can be easily used by the general population [3,4]. Recently, the KRDA has also begun to develop consumer-friendly food composition tables, and as a result of these efforts, they have published consumer friendly food composition tables for adults [5,6], children aged 6-11 [7]
and those aged 65 or over [8]. The portion size in these tables refers to the amount of food that an individual decides to take at any one time. Energy and nutrient requirements, as well as physical status, vary according to gender, age and so on, with age being the most important factor. Portion sizes are also changing over time. It has been reported in the US that the rise in obesity over the last 30 years has been in proportion to increases in portion size [9]. Particularly, the increase in the portion sizes
This study was financially supported by the National Academy of Agricultural Science of Rural Development Administration.
§Corresponding Author: Mi-Hyun Kim, Tel. 82-33-570-6883, Fax. 82-33-570-6883, Email. [email protected] Received: September 27, 2011, Revised: October 31, 2011, Accepted: October 31, 2011
ⓒ2011 The Korean Nutrition Society and the Korean Society of Community Nutrition
This is an Open Access article distributed under the terms of the Creative Commons Attribution Non-Commercial License (http://creativecommons.org/licenses/by-nc/3.0/) which permits unrestricted non-commercial use, distribution, and reproduction in any medium, provided the original work is properly cited.
of high energy density foods as provided by restaurants, has contributed to the rise in obesity [10,11]. Therefore, portion size should be set separately for different life stages and be updated continuously.
This research was carried out in order to establish the portion sizes of frequently consumed food items, so as to develop a food composition table for the elderly using the Forth Korea National Health and Nutrition Examination Survey (KNHANES IV-2) 2008. Therefore, the purpose of this study was (1) to find which food items are typically consumed by Koreans aged 65 or over;
(2) to establish the portion sizes of these food items so as to develop a consumer-friendly food composition table for the Korean elderly, and finally, (3) to address these findings in dietary planning and nutritional education for the elderly, and in assessing the diet intake status of the elderly.
Subjects and Methods
Subjects
We used data from 1,458 persons (16.9%) aged 65 or over, taken from the original 8,631 people who participated in the KNHANES IV-2, a nationwide dietary intake survey.
Selecting regularly consumed food items
We selected food items with an intake frequency of 30 or more among all the consumed food items dealt with by the survey. Frequently consumed food items were classified into 16 categories, based on the food groups in the Korean food composition table [1].
Analyzing portion size of food items and dishes of regular use Estimation of portion sizes was carried out based on portion size analysis data and methods used to calculate reference values for nutrition labeling from the US [12,13]. The portion size of food items was set on the basis of the median (50th percentile) portion size of an individual’s single intake. The median value was used rather than the mean value as a measurement of central position because the original data from KNHANES IV was not of normal distribution; diverse and extreme values cannot be eliminated and average of values measured in the units of 5 and 10 may even be subject to validity issues. Thus portion sizes were based on the median and were rounded off to units of 5 and 10 g considering the mean value and mode. For items with quantities of less than 10 g, the portion size was set in units of 1 g. For items in liquid form, portion size was set using mL.
For seasonal food items, portion size was set based on the quantities used when the item is in season. For food items that include bones, skin of shell, the portion size was set based on the edible part.
Results
A total of 160 different regularly used food items were selected.
The portion size of each item in the cereals, potatoes and starches is shown in Table 1. The portion sizes for cereals ranged from a minimum of 3 g for sorghum to the maximum of 125 g for Garaetteok (rice cake). The most frequently consumed item among the cereals was well-polished rice, which had a portion size of 75 g. The portion sizes of both potato and sweet potato were 120 g.
Legumes, nuts and seeds is shown in Table 2. The most frequently consumed legumes was dried black soybean, with a portion size of 9 g. Tofu was the next most commonly used items, and its portion size was 50 g. Among the nuts and seeds, roasted white sesame was the most consumed, with a portion size of 1 g.
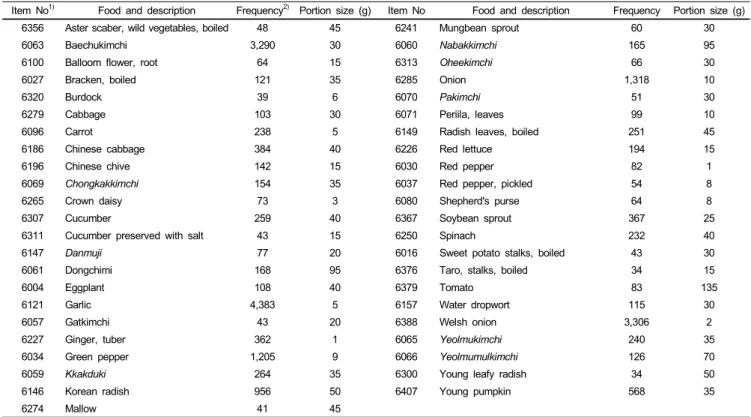
Table 3 shows the portion sizes of vegetables. This group had the largest number of items among 16 food groups. The most frequently used item in this category was garlic, with a portion size of 5 g. The portion size for welsh onion, the second most frequently used vegetable, was 2 g. Baechukimchi was the third most frequently used vegetable and its portion size was 30 g.
The portion sizes for mushrooms ranged from 5 g for oak mushrooms to 15 g for oyster mushrooms (Table 4). For raw fruits, portion sizes ranged from 105 g for bananas to 255 g for pears. Among the seaweeds, the most frequently consumed item was dried sea mustard, with a portion size of 5 g.
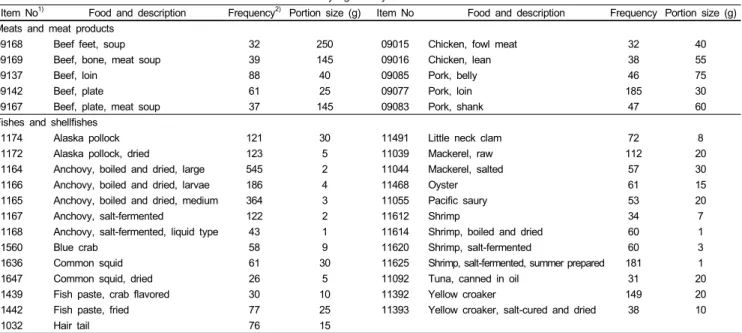
As shown in Table 5, the Korean elderly were more likely to eat fish and shellfish than meats. Among the meats, 10 varieties were included in this study; whereas 25 fish and shellfish were included the most frequently consumed food list. The most frequently consumed meat was pork loin and its portion size was 30 g. Among the fish and shellfish, boiled and dried large anchovy was the most frequently used item, with a portion size of 2 g.
The portion sizes for milk and eggs were 200 g and 50 g, respectively (Table 6). The portion size for oils was 5 g and the most frequently used variant was sesame oil. Among the sugars, the most frequently used item was white sugar, with a portion size of 1 g (Table 7).
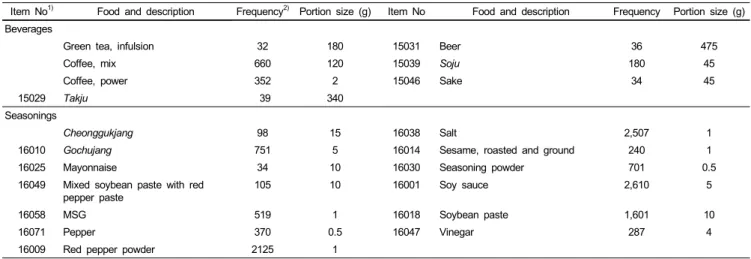
In the beverage category, the most frequently used
non-alcoholic item was coffee mix with a portion size of 120
ml, and the most frequently used alcoholic item was Soju with
a portion size of 45 ml (Table 8). Among the seasonings, the
most frequently used items were soy sauce, salt, red pepper
powder, in that order. The portion sizes for these were 5 g, 1
g and 1 g, respectively.
Item No1) Food and description Frequency2) Portion size (g) Item No Food and description Frequency Portion size (g) Cereals and cereal products
1143 Barley 1,441 10 1255 Glutinous corn 190 34
1069 Biscuits, soft 27 10 1029 Noodle, dry form 56 130
1165 Brown rice 361 7 1004 Prosimillet 94 4
1025 Flour for pan-frying 36 4 1243 Sirutteok (Rice cakes,) 39 75
1211 Garaetteok (rice cake) 87 125 1154 Sorghum 171 3
1195 Gluteinous rice 529 25 1019 Wheat flour 218 45
1271 Gluteinous sorghum 292 4 1173 Well polished rice 4501 75
Potatoes and starches
2001 Potato 348 120 2016 Sweet potato 104 120
2030 Potato starch 32 4 2039 Sweet potato starch vermicelli 70 10
1)National Rural Resources Development institute (2007). Food Composition Table 7the revision, Rural Development Administration, Suwon. Republic of Korea
2)Intake frequency by participants
Table 1. Portion sizes of cereals, potatoes and starches for Korean elderly aged 65 years and over
Item No1) Food and description Frequency2) Portion size (g) Item No Food and description Frequency Portion size (g) Legumes
4011 Black soybeans, dried 1,460 9 4023 Soybean milk 60 190
4002 Kidney beans, dried 46 6 4017 Soybean curd 618 50
4033 Peas 62 5 4024 Soybean powder 40 4
4044 Small red beans, dried 91 7
Nuts and seeds
5028 Chestnuts 65 9 5011 Perilla seeds 135 2
5014 Peanuts 34 7 5061 White sesame, roasted 1,745 1
1)National Rural Resources Development institute (2007). Food Composition Table 7the revision, Rural Development Administration, Suwon. Republic of Korea
2)Intake frequency by participants
Table 2. Portion sizes of legumes, nuts and seeds for Korean elderly aged 65 years and over
Item No1) Food and description Frequency2) Portion size (g) Item No Food and description Frequency Portion size (g)
6356 Aster scaber, wild vegetables, boiled 48 45 6241 Mungbean sprout 60 30
6063 Baechukimchi 3,290 30 6060 Nabakkimchi 165 95
6100 Balloom flower, root 64 15 6313 Oheekimchi 66 30
6027 Bracken, boiled 121 35 6285 Onion 1,318 10
6320 Burdock 39 6 6070 Pakimchi 51 30
6279 Cabbage 103 30 6071 Periila, leaves 99 10
6096 Carrot 238 5 6149 Radish leaves, boiled 251 45
6186 Chinese cabbage 384 40 6226 Red lettuce 194 15
6196 Chinese chive 142 15 6030 Red pepper 82 1
6069 Chongkakkimchi 154 35 6037 Red pepper, pickled 54 8
6265 Crown daisy 73 3 6080 Shepherd's purse 64 8
6307 Cucumber 259 40 6367 Soybean sprout 367 25
6311 Cucumber preserved with salt 43 15 6250 Spinach 232 40
6147 Danmuji 77 20 6016 Sweet potato stalks, boiled 43 30
6061 Dongchimi 168 95 6376 Taro, stalks, boiled 34 15
6004 Eggplant 108 40 6379 Tomato 83 135
6121 Garlic 4,383 5 6157 Water dropwort 115 30
6057 Gatkimchi 43 20 6388 Welsh onion 3,306 2
6227 Ginger, tuber 362 1 6065 Yeolmukimchi 240 35
6034 Green pepper 1,205 9 6066 Yeolmumulkimchi 126 70
6059 Kkakduki 264 35 6300 Young leafy radish 34 50
6146 Korean radish 956 50 6407 Young pumpkin 568 35
6274 Mallow 41 45
1)National Rural Resources Development institute (2007). Food Composition Table 7the revision, Rural Development Administration, Suwon. Republic of Korea
2)Intake frequency by participants
Table 3. Portion sizes of vegetables for Korean elderly aged 65 years and over
Item No1) Food and description Frequency2) Portion size (g) Item No Food and description Frequency Portion size (g) Mushrooms
7044 Oak mushroom 57 5 7018 Pine mushroom 42 6
7003 Oyster mushroom 76 15 7038 Winter mushroom 44 7
Fruits
8090 Apple 200 115 8137 Oriental melon 59 130
8063 Banana 32 105 8077 Peach 34 195
8011 Citrus fruits 138 120 8065 Pear 87 255
8158 Grape 59 105 8001 Persimmon 151 175
8050 Japanese apricot, concentrated juice 48 12 8110 Watermelon 76 165
8033 Jujube, dried 32 3
Seaweeds
12005 Laver, dried 124 2 12035 Sea mustard, dried 235 5
12033 Sea mustard 96 20 12018 Sea tangle, dried 50 1
1)National Rural Resources Development institute (2007). Food Composition Table 7the revision, Rural Development Administration, Suwon. Republic of Korea
2)Intake frequency by participants
Table 4. Portion sizes of mushrooms, fruits and seaweeds for Korean elderly aged 65 years and over
Item No1) Food and description Frequency2) Portion size (g) Item No Food and description Frequency Portion size (g) Meats and meat products
09168 Beef feet, soup 32 250 09015 Chicken, fowl meat 32 40
09169 Beef, bone, meat soup 39 145 09016 Chicken, lean 38 55
09137 Beef, loin 88 40 09085 Pork, belly 46 75
09142 Beef, plate 61 25 09077 Pork, loin 185 30
09167 Beef, plate, meat soup 37 145 09083 Pork, shank 47 60
Fishes and shellfishes
11174 Alaska pollock 121 30 11491 Little neck clam 72 8
11172 Alaska pollock, dried 123 5 11039 Mackerel, raw 112 20
11164 Anchovy, boiled and dried, large 545 2 11044 Mackerel, salted 57 30
11166 Anchovy, boiled and dried, larvae 186 4 11468 Oyster 61 15
11165 Anchovy, boiled and dried, medium 364 3 11055 Pacific saury 53 20
11167 Anchovy, salt-fermented 122 2 11612 Shrimp 34 7
11168 Anchovy, salt-fermented, liquid type 43 1 11614 Shrimp, boiled and dried 60 1
11560 Blue crab 58 9 11620 Shrimp, salt-fermented 60 3
11636 Common squid 61 30 11625 Shrimp, salt-fermented, summer prepared 181 1
11647 Common squid, dried 26 5 11092 Tuna, canned in oil 31 20
11439 Fish paste, crab flavored 30 10 11392 Yellow croaker 149 20
11442 Fish paste, fried 77 25 11393 Yellow croaker, salt-cured and dried 38 10
11032 Hair tail 76 15
1)National Rural Resources Development institute (2007). Food Composition Table 7the revision, Rural Development Administration, Suwon. Republic of Korea
2)Intake frequency by participants
Table 5. Portion sizes of meats and fish and shellfish for Korean elderly aged 65 years and over
Item No1) Food and description Frequency2) Portion size (g) Item No Food and description Frequency Portion size (g) Milk and milk products
13010 Cow's milk 199 200 13028 Yoghurt, liquid 89 65
Eggs
10005 Hen's egg 358 50
1)National Rural Resources Development institute (2007). Food Composition Table 7the revision, Rural Development Administration, Suwon. Republic of Korea
2)Intake frequency by participants
Table 6. Portion sizes of eggs, milk and milk products for Korean elderly aged 65 years and over
Item No1) Food and description Frequency2) Portion size (g) Item No Food and description Frequency Portion size (g) Oils and fats
14024 Coffee creamer 238 6 14023 Sesame oil 1,877 4
14018 Olive oil 107 4 14028 Soybean oil 767 4
14003 Perilla seed oil 373 4
Sugars
3019 Candy 40 9 3024 White sugar 1,263 1
3014 Starch syrup 527 2
1)National Rural Resources Development institute (2007). Food Composition Table 7the revision, Rural Development Administration, Suwon. Republic of Korea
2)Intake frequency by participants
Table 7. Portion sizes of sugars, oils and fats for Korean elderly aged 65 years and over
Item No1) Food and description Frequency2) Portion size (g) Item No Food and description Frequency Portion size (g) Beverages
Green tea, infulsion 32 180 15031 Beer 36 475
Coffee, mix 660 120 15039 Soju 180 45
Coffee, power 352 2 15046 Sake 34 45
15029 Takju 39 340
Seasonings
Cheonggukjang 98 15 16038 Salt 2,507 1
16010 Gochujang 751 5 16014 Sesame, roasted and ground 240 1
16025 Mayonnaise 34 10 16030 Seasoning powder 701 0.5
16049 Mixed soybean paste with red
pepper paste 105 10 16001 Soy sauce 2,610 5
16058 MSG 519 1 16018 Soybean paste 1,601 10
16071 Pepper 370 0.5 16047 Vinegar 287 4
16009 Red pepper powder 2125 1
1)National Rural Resources Development institute (2007). Food Composition Table 7the revision, Rural Development Administration, Suwon. Republic of Korea
2)Intake frequency by participants
Table 8. Portion sizes of beverages and seasonings for Korean elderly aged 65 years and over
Discussion
In order to assist people in meeting their daily nutrient requirements, dietary intake can be interpreted by either serving size or portion size. The serving size of a food refers to the recommended amount of food to be taken according to public guidelines on dietary intake, such as those found in the Food Pyramid. However, portion size refers to the amount of food an individual consumer eats at any one time [14]. This may be smaller or larger than the serving size. Accordingly, the portion size represents the actual intake amount of foods; therefore, expressing nutritional information per portion size may be more useful than expressing it per 100 g, particularly for consumers who need information about nutritional intake and menu planning.
As mentioned in the introduction section of this work, the portion sizes of frequently consumed foods for Korean adults [2] and children aged 6-11 [15] have been established through previous studies using KNHANES data. According to these studies, children's portion sizes for every food group were different to those for adults. The portion sizes of foods were thus different relative to age group, and a difference was also shown in the most frequently consumed food items. Therefore, portion sizes should be established for each different age group.
In this study, we selected 158 varieties of food items based on their usage frequency in Koreans of 65 and over, and established the portion sizes of these items. This study is very significant because it sets portion sizes for the Korean elderly for the first time on the basis of nationwide data about food intake quantities. These included foods comprise 13 varieties of cereals and cereal products, 4 of potatoes and starches, 3 of sugars and sugar products, 7 of legumes, 4 of nuts and seeds, 45 of vegetables, 4 of mushrooms, 11 of fruits, 10 of meats and meat products, 1 of eggs, 25 of fish and shellfish and related products, 4 of seaweeds, 3 of milk and milk products, 5 of oils and fats, 7 of beverages (alcoholic and non-alcoholic), and 13 of
seasonings.
Among these items, the most frequently consumed food was well-polished rice, with a portion size of 75 g. Rice is the most representative traditional Korean staple dish, which can be proposed as the reason for which rice was the food item most frequently consumed by the Korean elderly. When we compared rice portion sizes for the elderly with those for adults (80 g) using previously reported data [2], the portion size for elderly was 5 g lower than that for adults. The Korean Nutrition Society has set the serving size white rice as 90 g (16).
Among the potatoes and starches category, the portion sizes of both potato and sweet potato were 120 g, which were 85%
and 71% higher, respectively, than those for adults. The Korean Nutrition Society has set the serving size for potato and sweet potato as being 130 g and 90 g [16], respectively. The vegetable category contained the most varied food items among the 16 food groups. With the exceptions of garlic and welsh onion, which are commonly used as basic spices in Korean cooking, the most frequently consumed vegetable was Baechukimchi, and its portion size was 30 g, which is 10 g lower than that for adults. The Korean Nutrition Society has set the serving size for Baechukimchi at 40 g [16].
Items in the food groups which contain sources of protein, i.e. legumes, meats, fish and shellfish and eggs, had smaller portion sizes and less variety in the elderly group data than in that for adults. This suggests that the Korean elderly have a predominantly plant-based diet and a higher risk of protein deficiency. Insufficient protein intake in the Korean elderly has, in fact, been reported by previous studies [17,18].
Among the meats and meat product items, just 10 were
included as frequently consumed by the Korean elderly, and three
of these were soups made from beef bone or meat. However,
25 types of fish and shellfish were included. The Korean elderly
thus appear more likely to eat fish and shellfish than meats and
meat products. According to the several studies, fish consumption
has positive effects on the prevention of chronic diseases, particularly cardiovascular diseases and cancer [19-21]. Virtanen et al. [22] assessed lifestyle and other risk factors every two years and diet every four years in US male health professionals aged 40-75 during an 18 year period. They reported that modest fish consumption (1 serving/week and 2-4 servings/ week) was associated with a lower risk of total cardiovascular disease, consistent with mortality benefits. However, concern has been raised about the fact that consumption of some fish can lead to an increased risk of organochlorine or mercury contaminants in diet [23,24]. Therefore, further studies are needed to establish the recommended serving sizes and intake frequency of fish for the elderly.
Milk and milk products are good calcium source, but just two items (cow’s milk and liquid yoghurt) were found to be frequently consumed foods. Given the insufficient calcium intake and high prevalence of osteoporosis in the Korean elderly [25], efforts are urgently needed to increase milk and milk product consumption in this group and to find further calcium sources.
To assess the portion sizes of regularly consumed food items actual-size photographs and nutritional values of food items per portion size have been added to this study’s findings, thus enhan- cing the usefulness of the data. With this pictorial information, a food composition table for the elderly was published in 2010 [8]. Older people are more likely to suffer from chronic diseases, which may require on-going diet therapy for prevention and treatment. To counter this, these data and the results of this study can be conveniently and effectively used by the elderly them- selves or their dietary planners when making food selections for a nutritionally balanced diet. In addition, these data can be used for setting single intake quantities in nutrition labeling of processed food items and the appropriate quantities for a single meal outside the home, e.g. in restaurants and nursing facilities.
These established portion sizes can also be used in national nutritional education guidelines.
References
1. National Rural Resources Development Institute. Food Composition Table, 7th ed. Suwon: Rural Development Administration; 2007.
2. Choi MK, Hyun WJ, Lee SY, Park HJ, Kim SN, Song KH. One portion size of foods frequently consumed by Korean adults. Nutr Res Pract 2010;4:82-8.
3. Young LR, Nestle MS. Portion sizes in dietary assessment: issues and policy implications. Nutr Rev 1995;53:149-58.
4. Young LR, Nestle M. Variation in perceptions of a 'medium' food portion: implications for dietary guidance. J Am Diet Assoc 1998;98:458-9.
5. Rural Development Administration. Food Composition Table for Convenient Use by General Consumers. Suwon: Rural Development Administration; 2002.
6. Rural Development Administration. Food Composition Table for Convenient Use by General Consumers. Suwon: Rural Development Administration; 2009.
7. Rural Development Administration. Food Composition Table for Children. Suwon: Rural Development Administration; 2009.
8. Rural Development Administration. Food Composition Table for Elderly. Suwon: Rural Development Administration; 2010.
9. Nielsen SJ, Popkin BM. Patterns and trends in food portion sizes, 1977-1998. JAMA 2003;289:450-3.
10. Diliberti N, Bordi PL, Conklin MT, Roe LS, Rolls BJ. Increased portion size leads to increased energy intake in a restaurant meal.
Obes Res 2004;12:562-8.
11. Kral TV, Rolls BJ. Energy density and portion size: their independent and combined effects on energy intake. Physiol Behav 2004;82:131-8.
12. Pao EM, Fleming KH, Guenther PM, Mickle SJ. Foods commonly eaten by individuals: amount per day and per eating occasion. USDA HNIS Home Economics Research Report No.
44. 1982. Available from: http://www.regulations.gov/search/
Regs/contentStreamer?objectId=09000064800c3ce9&disposition=
attachment&contentType=pdf.
13. Department of Health and Human Services, Food and Drug Administration. Code of Federal Regulation. [Updated 2011 April 1]. USA: Food and Drug Administration; 1993.
14. Ueland O, Cardello AV, Merrill EP, Lesher LL. Effect of portion size information on food intake. J Am Diet Assoc 2009;109:
124-7.
15. Choi MK, Lee HS, Kim SB, Kim SN, Kim SY, Kim MH.
Establishment of one portion size of foods frequently consumed by Korean children aged 6-11 using 2005 Korea National Health and Nutrition Examination Survey and its comparison with adults. Korean J Community Nutr 2010;15:625-35.
16. The Korean Nutrition Society. Dietary Reference Intakes for Koreans. Seoul: The Korean Nutrition Society; 2010.
17. Kim MH, Lee JC, Bae YJ. The evaluation study on eating behavior and dietary quality of elderly people residing in Samcheok according to age group. Korean J Community Nutr 2009;14:495-508.
18. Park MY, Chun BY, Joo SJ, Jeong GB, Huh CH, Kim GR, Park PS. A comparison of food and nutrition intake status of aged females in a rural life community by the stage model of dietary behavior change. Korean J Community Nutr 2008;13:34-45.
19. Mozaffarian D, Longstreth WT Jr, Lemaitre RN, Manolio TA, Kuller LH, Burke GL, Siscovick DS. Fish consumption and stroke risk in elderly individuals: the cardiovascular health study.
Arch Intern Med 2005;165:200-6.
20. Leitzmann MF, Stampfer MJ, Michaud DS, Augustsson K, Colditz GC, Willett WC, Giovannucci EL. Dietary intake of n-3 and n-6 fatty acids and the risk of prostate cancer. Am J Clin Nutr 2004;80:204-16.
21. Chavarro JE, Stampfer MJ, Li H, Campos H, Kurth T, Ma J.
A prospective study of polyunsaturated fatty acid levels in blood and prostate cancer risk. Cancer Epidemiol Biomarkers Prev 2007;16:1364-70.
22. Virtanen JK, Mozaffarian D, Chiuve SE, Rimm EB. Fish consumption and risk of major chronic disease in men. Am J Clin Nutr 2008;88:1618-25.
23. Huang X, Hites RA, Foran JA, Hamilton C, Knuth BA, Schwager SJ, Carpenter DO. Consumption advisories for salmon based on risk of cancer and noncancer health effects. Environ Res 2006;
101:263-74.
24. Virtanen JK, Voutilainen S, Rissanen TH, Mursu J, Tuomainen TP, Korhonen MJ, Valkonen VP, Seppänen K, Laukkanen JA,
Salonen JT. Mercury, fish oils, and risk of acute coronary events and cardiovascular disease, coronary heart disease, and all-cause mortality in men in eastern Finland. Arterioscler Thromb Vasc Biol 2005;25:228-33.
25. Ministry of Health, Welfare and Family Affairs, Korea Centers
for Disease Control and Prevention. 2009 National Health Statistics:
The 4th Korea National Health and Nutrition Examination Survey, the third year (2009). Cheongwon: Korea Centers for Disease Control and Prevention; 2010.