INTRODUCTION
Cerebral palsy (CP) is a childhood-onset neurodevelopmental disorder that causes severe disabilities, as well as several medi- cal problems other than movement and postural abnormali- ties throughout the lifetime.1,2 According to previous studies
conducted in other countries, including Sweden, United States, United Kingdom, and Republic of Ireland, socioeconomic sta- tus (SES) has an effect on CP occurrence.1,3-5 Results, however, are controversial when considering confounders, such as pre- maturity (gestational age less than 37 weeks) and low birth weight (LBW) (birth weight of less than 2500 grams).1,6,7 Prema- turity and LBW are known as the strongest risk factors of CP and are also associated with SES.8,9
According to data published by the Statistics Korea, the num- ber of births in Korea has gradually decreased from 490543 in 2003 to 438700 in 2015, and has maintained a lowest-low fertili- ty status, with a total fertility rate at or below 1.30 over the last 10 years. In 2015, the total fertility rate was 1.24, and was the lowest recorded in Organization for Economic Cooperation and Development countries. Based on a report released by the Kore- an Women’s Development Institute, preterm birth rates in Ko- Received: March 30, 2018 Revised: May 16, 2018
Accepted: May 17, 2018
Corresponding author: Jiyong Kim, MD, Department of Physical Medicine and Rehabilitation, Inje University Ilsanpaik Hospital, 170 Juhwa-ro, Ilsanseo-gu, Goyang 10380, Korea.
Tel: 82-31-910-7885, Fax: 82-31-910-7786, E-mail: [email protected]
•The authors have no financial conflicts of interest.
© Copyright: Yonsei University College of Medicine 2018
This is an Open Access article distributed under the terms of the Creative Com- mons Attribution Non-Commercial License (https://creativecommons.org/licenses/
by-nc/4.0) which permits unrestricted non-commercial use, distribution, and repro- duction in any medium, provided the original work is properly cited.
Incidence of Cerebral Palsy in Korea and the Effect of Socioeconomic Status:
A Population-Based Nationwide Study
Seong Woo Kim1, Ha Ra Jeon1, Ji Cheol Shin2, Taemi Youk3, and Jiyong Kim4,5
1Department of Physical Medicine and Rehabilitation, National Health Insurance Service Ilsan Hospital, Goyang;
2Department of Rehabilitation Medicine and Research Institute of Rehabilitation Medicine, Yonsei University College of Medicine, Seoul;
3Department of Statistics, Korea University, Seoul;
4Department of Physical Medicine and Rehabilitation, Inje University Ilsanpaik Hospital, Goyang;
5Yonsei University College of Medicine, Seoul, Korea.
Purpose: Cerebral palsy (CP) is a neurodevelopmental disorder that causes serious disability. Prematurity and low birth weight (LBW) are known to be the strongest risk factors of CP. While socioeconomic status (SES) has been found to influence the occur- rence of CP, prematurity, and LBW, no studies have investigated this effect in Korea. The aim of this study was to evaluate the inci- dence of CP, prematurity, and LBW in Korea, as well as the effect of SES thereon.
Materials and Methods: Data were obtained from the National Health Information Database from 2007 to 2013; persons with a history of CP, prematurity, and LBW were investigated by year. SES was defined in accordance with income quintiles, birth re- gions, and coverage classification.
Results: The incidence of CP decreased over the last five years, despite increased rates of prematurity and LBW. CP incidence was significantly lower in affluent groups than in the most deprived group, although this difference disappeared after controlling for confounders. The incidence of CP was significantly higher in medical aid beneficiaries, even after controlling for confounders.
Conclusion: CP incidence in Korea has decreased over the last five years, despite an increase in high-risk deliveries. Income level had no effect in CP incidence. These results may aid CP management and prevention policies.
Key Words: Cerebral palsy, premature birth, low birth weight, incidence, socioeconomic factors
pISSN: 0513-5796 · eISSN: 1976-2437 Yonsei Med J 2018 Aug;59(6):781-786
https://doi.org/10.3349/ymj.2018.59.6.781
rea increased by about 1.8 times, from 3.2% in 1997 to 5.6% in 2009,10 and the Korea Institute for Health and Social Affairs re- ported that LBW rate in Korea increased by about two times, from 2.6% in 1993 to 5.3% in 2012. According to this report, the increase in LBW rate resulted from an increasing number of older pregnancies, along with later marriages and multiple ges- tations associated with the development of assisted reproduc- tive technology.11 Considering the low fertility rate and incre- ment of high-risk pregnancies, it is surprising that no studies have yet reported the incidence of CP in relation thereto in Ko- rea. Furthermore, none have investigated whether SES affects the occurrence of CP and CP risk factors, such as prematurity and LBW. A precise evaluation of the effect of SES on CP inci- dence is crucial to help establish welfare policies to prevent CP.
Korea operates a National Health Insurance system, which is compulsory and required by Korean law. The National Health Insurance Service (NHIS) is the only public medical insurance institution operated by the Ministry of Health and Welfare in Korea. The NHIS provides universal coverage to all Korean na- tionals, except for the lower-income group, which is supported by the Medical Aid program. The insured are classified into two groups: employee insured and self-employed insured. The Na- tional Health Information Database (NHID) is a public data- base on health care utilization, health screening, sociodemo- graphic variables, and mortality for the whole population of South Korea, and was formed by the NHIS.12 Using data from the NHID, we investigated the incidences of and recent trends in the occurrence of CP, prematurity, and LBW. We also ana- lyzed the effect of SES on those incidences.
MATERIALS AND METHODS
This study was conducted using data from the NHID for 7 years, from January 1, 2007 to December 31, 2013. We analyzed data related to persons diagnosed with CP at least twice after 24 months of age within this period. Accordingly, data related to CP were analyzed for 5 years, from children born in 2007 to 2011. The disease codes from the International Classification of Disease, 10th edition, related to CP can be found in Supple- mentary Table 1 (only online). Prematurity and LBW were de- fined as persons who had corresponding diagnostic codes at least once within a 24-month period after birth.
For the evaluation of SES, data on income quintile, birth re- gion, and coverage classification (employee insured, self-em- ployed insured, or medical aid beneficiaries) were collected on the basis of birth information. Income quintiles of each in- sured person represent the economic status of persons, and were based on the amount of health insurance payments and then divided into 20 quintiles. Of those, a higher income quin- tile indicates a higher income. For statistical analysis, the in- come quintile was divided into five groups; the first group in- cluded medical aid recipients and the 0−20% income quintile;
second, 21−40%; third, 41−60%; fourth, 61−80%; and fifth, 81−
100%. Birth regions and coverage classification were consid- ered to represent social status.
Ethics approval was obtained following project approval by the National Health Insurance Service Ilsan Hospital (NHIMC 2015-02-015). The need for written consent was formally waived by the ethics committee.
Statistical analysis
SAS ver. 9.4 (SAS Institute Inc., Cary, NC, USA) was used for all statistical analyses. Between-group differences (i.e., differences in CP and incidence of prematurity and LBW), in terms of sex, coverage classification, and income group were assessed using chi-square tests, and multiple regression analysis was used to determine the effect of various factors on the occurrence of CP. The level of statistical significance was set at p<0.05.
RESULTS
Overall cerebral palsy incidence
Regarding the overall CP incidence from 2007 to 2011, 0.41%
of total neonates were diagnosed with CP in 2007, whereas only 0.25% were diagnosed with CP in 2011, showing that the incidence decreased remarkably over 5 years (Fig. 1). This de- creasing trend was similar in male and female children, al- though the 5-year CP incidence was 1.3 times higher in male than in female children (p<0.05).
Over the 5-year period, 2.14% of neonates were diagnosed with prematurity in 2007, and that number increased to 2.80%
in 2011. In regards to LBW, 1.40% of neonates were diagnosed with LBW in 2007 and 2.09% in 2011, showing an increase of around 1.5 times (Fig. 1). When analyzing the history of pre- maturity or LBW in persons with CP, it was found that the per- centage of persons with a history of prematurity had increased over the 5-year period, from 29.8% in 2007 to 37.7% in 2011.
Incidence (%)
2007 2008 2009 2010 2011
3.0 2.5 2.0 1.5 1.0 0.5 0.0
−
−
−
−
−
−
−
CP Prematurity
LBW
Fig. 1. Incidence of CP, prematurity, and LBW by year. CP, cerebral palsy;
LBW, low birth weight.
Similarly, the percentage of subjects with a history of LBW in- creased from 22.4% in 2007 to 31.7% in 2011.
Incidences of cerebral palsy, prematurity, and low birth weight according to social status
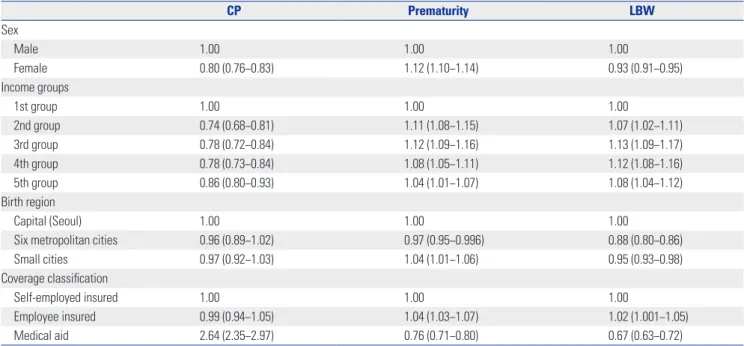
The incidence of CP was significantly higher for medical aid beneficiaries than for both the employee insured and self- employed categories, between which there was no significant difference. A significantly higher CP incidence in medical aid beneficiaries was found both before and after controlling for confounders, such as sex, income group, prematurity, and LBW [before: odds ratio (OR) 2.64, 95% confidence interval (CI) 2.35–2.97; after: OR 2.41, 95% CI 2.09–2.77]. When evaluating the difference in the incidences of prematurity and LBW accord- ing to the coverage classification, the incidences of prematuri- ty and LBW were significantly lower in medical aid beneficia- ries (OR 0.76, 95% CI 0.71–0.80 and OR 0.67, 95% CI 0.63–0.72, respectively) (Table 1).
When comparing the incidence of CP according to birth re- gions, the risk of CP in Seoul, the capital of South Korea, was not significantly different from that in six metropolitan cities and small cities (OR 0.96, 95% CI 0.89–1.02 and OR 0.97, 95%
CI 0.92–1.03, respectively). Furthermore, the 5-year incidence
had decreased evenly in all regions.
Incidences of cerebral palsy, prematurity, and low birth weight according to economic status
Overall numbers of neonates, CP, prematurity, and LBW ac- cording to the five income groups over the 5-year period are presented in Table 2. First, birth rate was lower in the lowest income group. Second, there were significant differences in CP incidence between the income groups (p<0.05). Regression analysis indicated that the CP incidence was significantly high- er in the first income group (medical aid and the 0–20% income quintile group) than in all other groups (OR 0.74, 95% CI 0.68–
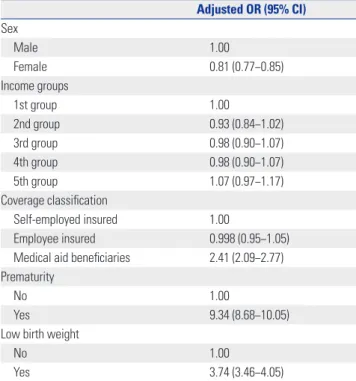
0.81, OR 0.78, 95% CI 0.72–0.84; OR 0.78, 95% CI 0.73–0.84; and OR 0.86, 95% CI 0.80–0.93, respectively, according to the in- come group order) (Table 1). However, after controlling for con- founders, including sex, coverage classification, prematurity, and LBW, this difference became non-significant (Table 3). The CP incidence decreased over time in all the groups (Fig. 2).
Third, there were significant differences in prematurity and LBW among the income groups. The incidence of both was lower in the first income group (medical aid the 0–20% income quin- tile group), compared to all other income groups (Table 1).
Fourth, further analyses were conducted to evaluate the rela- Table 1. Unadjusted Odds Ratios for Associations between Risk Factors and CP, Prematurity, and LBW
CP Prematurity LBW
Sex
Male 1.00 1.00 1.00
Female 0.80 (0.76−0.83) 1.12 (1.10−1.14) 0.93 (0.91−0.95)
Income groups
1st group 1.00 1.00 1.00
2nd group 0.74 (0.68−0.81) 1.11 (1.08−1.15) 1.07 (1.02−1.11)
3rd group 0.78 (0.72−0.84) 1.12 (1.09−1.16) 1.13 (1.09−1.17)
4th group 0.78 (0.73−0.84) 1.08 (1.05−1.11) 1.12 (1.08−1.16)
5th group 0.86 (0.80−0.93) 1.04 (1.01−1.07) 1.08 (1.04−1.12)
Birth region
Capital (Seoul) 1.00 1.00 1.00
Six metropolitan cities 0.96 (0.89−1.02) 0.97 (0.95−0.996) 0.88 (0.80−0.86)
Small cities 0.97 (0.92−1.03) 1.04 (1.01−1.06) 0.95 (0.93−0.98)
Coverage classification
Self-employed insured 1.00 1.00 1.00
Employee insured 0.99 (0.94−1.05) 1.04 (1.03−1.07) 1.02 (1.001−1.05)
Medical aid 2.64 (2.35−2.97) 0.76 (0.71−0.80) 0.67 (0.63−0.72)
CP, cerebral palsy; LBW, low birth weight.
Data are odds ratio (95% confidence interval).
Table 2. Overall Numbers of Children according to Income Groups
Income groups Newborn babies Cerebral palsy Prematurity Low birth weight
1st group 248454 1053 6912 4696
2nd group 278082 873 6976 4936
3rd group 531953 1756 13226 8958
4th group 710317 2363 18315 12047
5th group 423155 1544 11331 7410
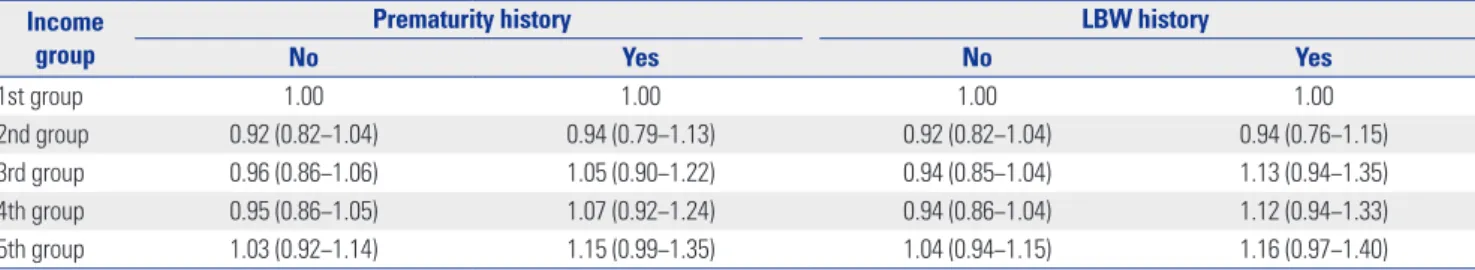
tionship between CP incidence and economic status accord- ing to the presence of history of prematurity or LBW. After controlling for confounders, the incidence of CP did not show a difference among the income groups, based on whether or not there was a history of prematurity. Similarly, there was no difference in CP incidence among the income groups, based on whether or not there was history of LBW (Table 4).
DISCUSSION
Cerebral palsy is a neurodevelopmental disorder that causes
Table 3. Results of Multivariable Logistic Regression Analysis for Asso- ciations between Multiple Factors and Cerebral Palsy
Adjusted OR (95% CI) Sex
Male 1.00
Female 0.81 (0.77−0.85)
Income groups
1st group 1.00
2nd group 0.93 (0.84−1.02)
3rd group 0.98 (0.90−1.07)
4th group 0.98 (0.90−1.07)
5th group 1.07 (0.97−1.17)
Coverage classification
Self-employed insured 1.00
Employee insured 0.998 (0.95−1.05)
Medical aid beneficiaries 2.41 (2.09−2.77) Prematurity
No 1.00
Yes 9.34 (8.68−10.05)
Low birth weight
No 1.00
Yes 3.74 (3.46−4.05)
OR, odds ratio, CI, confidence interval.
Incidence (%)
1st group 2nd group 3rd group 4th group 5th group
0.6 0.5 0.4 0.3 0.2 0.1 0.0
−
−
−
−
−
−
−
Fig. 2. Incidence of cerebral palsy according to income group by year.
2007 2008 2009 2010 2011 serious disability, the strongest risk factors of which are known to be prematurity and LBW. While SES has been found to in- fluence the occurrence of CP, prematurity, and LBW, no stud- ies have investigated this effect in Korea. Hence, we conducted a large-scale study including the nationwide population, based on data from the NHID. The incidence of CP has decreased over the last five years, despite an increase in high-risk deliveries.
CP incidence was significantly lower in the affluent groups than the most deprived group, although this difference disap- peared after controlling for confounders. However, the inci- dence of CP was significantly higher in medical aid beneficia- ries, even after controlling for confounders, such as sex, income group, coverage classification, prematurity, and LBW.
Our previous study conducted in 2014 using data from the NHID revealed that prematurity had increased by about 1.4 times in the last four years, from 7461 in 2007 to 10519 in 2010, and that LBW had increased by 1.3 times, from 6677 in 2007 to 8580 in 2010 (data not yet published). Over the last 10 years, the birth rate in Korea has reduced and a lowest-low fertility status has been maintained; however, the percentage of high- risk childbirth is increasing. Prematurity and LBW are well known to be the strongest risk factors of CP. Oskoui, et al.13 re- ported that the incidence of CP had increased along with short intra-uterine periods and/or LBWs. Clark, et al.14 showed that the changing pattern of CP incidence differs in accordance with the intra-uterine period and birth weight. As suggested by the present results, the reducing pattern of CP incidence despite the increment of percentage with a history of prematurity or LBW among the persons diagnosed with CP reflects the high quali- ty of medical services in South Korea, including improved quality of neonatal intensive care.
In this study, CP incidence was lower in the affluent group than in the most deprived group before controlling for the confounders, although the difference was not significant after controlling for the confounders, regardless of whether or not there was history of prematurity or LBW. However, CP incidence was significantly higher in medical aid beneficiaries both be-
fore and after controlling for the confounders. There have been several studies concerning the relationship between SES and CP incidence, and the results vary. Durkin, et al.1 reported that spastic CP prevalence was reduced in the affluent group (when SES groups were divided based on the maternal education level), even after correction for the perinatal risk factors such as race, intra-uterine period, and birth weight. Sundrum, et al.6 re- ported that CP prevalence was high in the most deprived group, although the difference was partially attributable to the differ- ence in the incidences of prematurity and LBW according to SES. Wu, et al.7 revealed that CP prevalence was higher in black children than in white children, although there were no differ- ences in CP incidence between the races after correction of con- founders, such as prematurity and LBW. Dolk, et al.15 and Dowd- ing, et al.5 reported that CP prevalence differed in accordance with SES in normal birth weight infants, although the differ- ence was not significant in LBW infants.
The incidence of the strongest risk factors of CP (prematuri- ty and LBW) was high in the affluent groups before controlling for confounders. This trend seemed to be related with in- creased infertility due to numerous causes, including older pregnancies. Our previous study conducted in 2016 using data from the NHID revealed that the average ages at birth of the mothers were 30.2±3.8 years in 2005, 30.3±3.9 years in 2006, 30.5±3.9 years in 2007, 30.8±4.0 years in 2008, and 30.9±4.0 years in 2009, and it was found that the average maternal age gradually increased (data not yet published). In the case of as- sisted reproductive technology, the risk of multiple gestations has increased, and the risks of prematurity and LBW have in- creased in multiple gestations.16-18 Infertility is thought to be high in relatively affluent groups, in alignment with the higher edu- cation of women, increasing economic activity rate of women, and postponed marriage and childbearing age, sequentially.16 Furthermore, accessibility to assisted reproductive technology is poor for relatively deprived groups, including medical aid beneficiaries, because this treatment is costly.
This study has a few limitations. First, this study was con- ducted based on data from the NHID, and thus, it may have less accuracy than a population-based registration. Neverthe- less, this study is thought to be meaningful, as it reflected the nationwide population of South Korea. Second, information on
SES was limited to birth regions, coverage classification, and income quintile; other information that might have represent- ed SES, such as education level of parents, occupation, and number of family members, was not available. Third, the analy- sis of the use of assistive reproductive technology was not con- ducted in this study. Further study related to this would be needed.
To conclude, the present study revealed that, over the last 5 years, CP incidence has reduced in South Korea, despite an increase in high-risk deliveries. Prematurity and LBW were confirmed as the strongest risk factors of CP. There was no dif- ference in CP incidence according to income group after con- trolling for confounders, although CP incidence was high in medical aid beneficiaries. According to these results, support to reduce prematurity and LBW is required at all income lev- els, and a more effective strategy is needed to prevent CP in medical aid beneficiaries, who appear to be highly susceptible to this condition. These results may be useful for the develop- ment of CP management strategies and prevention policies.
ACKNOWLEDGEMENTS
This study was supported by the National Health Insurance Il- san Hospital grant (NHIS-2016-1-113). This study used NHIS- NSC data (NHIS-2016-1-113) collected by the National Health Insurance Service. The authors alone are responsible for the content and writing of the manuscript.
ORCID
Seong Woo Kim https://orcid.org/0000-0002-1548-8147 Jiyong Kim https://orcid.org/0000-0003-4693-8400
REFERENCES
1. Durkin MS, Maenner MJ, Benedict RE, Van Naarden Braun K, Christensen D, Kirby RS, et al. The role of socio-economic status and perinatal factors in racial disparities in the risk of cerebral palsy. Dev Med Child Neurol 2015;57:835-43.
2. Moon SJ, Choi Y, Chung CY, Sung KH, Cho BC, Chung MK, et al.
Normative values of physical examinations commonly used for cerebral palsy. Yonsei Med J 2017;58:1170-6.
Table 4. Multivariable Logistic Regression Analysis: Relationship between Cerebral Palsy Incidence and Economic Status according to the Presence of History of Prematurity or LBW
Income group
Prematurity history LBW history
No Yes No Yes
1st group 1.00 1.00 1.00 1.00
2nd group 0.92 (0.82−1.04) 0.94 (0.79−1.13) 0.92 (0.82−1.04) 0.94 (0.76−1.15)
3rd group 0.96 (0.86−1.06) 1.05 (0.90−1.22) 0.94 (0.85−1.04) 1.13 (0.94−1.35)
4th group 0.95 (0.86−1.05) 1.07 (0.92−1.24) 0.94 (0.86−1.04) 1.12 (0.94−1.33)
5th group 1.03 (0.92−1.14) 1.15 (0.99−1.35) 1.04 (0.94−1.15) 1.16 (0.97−1.40)
LBW, low birth weight.
Data are odds ratio (95% confidence interval).
3. Hjern A, Thorngren-Jerneck K. Perinatal complications and so- cio-economic differences in cerebral palsy in Sweden - a national cohort study. BMC Pediatr 2008;8:49.
4. Dolk H, Pattenden S, Bonellie S, Colver A, King A, Kurinczuk JJ, et al. Socio-economic inequalities in cerebral palsy prevalence in the United Kingdom: a register-based study. Paediatr Perinat Epi- demiol 2010;24:149-55.
5. Dowding VM, Barry C. Cerebral palsy: social class differences in prevalence in relation to birthweight and severity of disability. J Epidemiol Community Health 1990;44:191-5.
6. Sundrum R, Logan S, Wallace A, Spencer N. Cerebral palsy and socioeconomic status: a retrospective cohort study. Arch Dis Child 2005;90:15-8.
7. Wu YW, Xing G, Fuentes-Afflick E, Danielson B, Smith LH, Gilbert WM. Racial, ethnic, and socioeconomic disparities in the preva- lence of cerebral palsy. Pediatrics 2011;127:e674-81.
8. Gissler M, Meriläinen J, Vuori E, Hemminki E. Register based mon- itoring shows decreasing socioeconomic differences in Finnish perinatal health. J Epidemiol Community Health 2003;57:433-9.
9. Spencer N, Bambang S, Logan S, Gill L. Socioeconomic status and birth weight: comparison of an area-based measure with the Regis- trar General’s social class. J Epidemiol Community Health 1999;53:495-8.
10. Kim DS, Kim YT, Kim TH. Pregnancy outcome and policy support plan for older pregnant women. Seoul: Korean Women’s Devel- opment Institute; 2011.
11. Kim H. Recent trends in maternal and child health indicators and its policy implication. Health Welfare Policy Forum 2013:206:49- 59.
12. Christensen DL, Baio J, Van Naarden Braun K, Bilder D, Charles J, Constantino JN, et al. Prevalence and characteristics of autism spectrum disorder among children aged 8 years--autism and de- velopmental disabilities monitoring network, 11 Sites, United States, 2012. MMWR Surveill Summ 2016;65:1-23.
13. Oskoui M, Coutinho F, Dykeman J, Jetté N, Pringsheim T. An up- date on the prevalence of cerebral palsy: a systematic review and meta-analysis. Dev Med Child Neurol 2013;55:509-19.
14. Clark SL, Hankins GD. Temporal and demographic trends in cere- bral palsy--fact and fiction. Am J Obstet Gynecol 2003;188:628-33.
15. Dolk H, Pattenden S, Johnson A. Cerebral palsy, low birthweight and socio-economic deprivation: inequalities in a major cause of childhood disability. Paediatr Perinat Epidemiol 2001;15:359-63.
16. Oh Y, Park S. Economic analysis of low fertility. Korean J Econom- ics 2008;15:91-102.
17. Health Quality Ontario. In vitro fertilization and multiple preg- nancies: an evidence-based analysis. Ont Health Technol Assess Ser 2006;6:1-63.
18. Platt MJ, Cans C, Johnson A, Surman G, Topp M, Torrioli MG, et al. Trends in cerebral palsy among infants of very low birthweight (<1500 g) or born prematurely (<32 weeks) in 16 European cen- tres: a database study. Lancet 2007;369:43-50.