Original Article
Low Correlation Between Vancomycin Area Under the Curve Over 24 Hours to the MIC (AUC/MIC ratio) and the Trough
Concentration at Steady State in Methicillin-Resistant Staphylococcus Aureus Pneumonia
You Min Sohna*, Hyo Jung Parka*, Jee Eun Chungb, Kyungmin Huhc, Kyeongman Jeond, Yong Seok Leea and Myung Sook Mina†
Department of Pharmaceutical Services, Samsung Medical Center, 81 Irwon-ro, Gangnam-gu, Seoul, 06351, Republic of Koreaa
College of Pharmacy, Hanyang University,
55 Hanyangdaehak-ro, Sangnok-gu, Ansan, Gyeonggi-do, 15588, Republic of Koreab
Division of Infectious Diseases, Department of Medicine, Samsung Medical Center, Sungkyunkwan University School of Medicine, 81 Irwon-ro, Gangnam-gu, Seoul, 06351, Republic of Koreac
Department of Critical Care Medicine, Samsung Medical Center, Sungkyunkwan University School of Medicine, 81 Irwon-ro, Gangnam-gu, Seoul, 06351, Republic of Koread
*You Min Sohn and Hyo Jung Park contributed equally to this study and are considered cofirst authors.
투고일자 2020.8.19; 심사완료일자 2020.9.15; 게재확정일자 2020.10.21
†교신저자 Myung Sook Min Tel:82-2-3410-3370 E-mail:[email protected]
Background : Vancomycin is a mainstay of treatment of serious methicillin-resistant Staphy- lococcus aureus (MRSA) infections. The recently published guideline on vancomycin monitoring recommends that a vancomycin loading dose can be considered and an individualized target AUC/MIC ratio of 400-600 and should be advocated to achieve clinical efficacy while improving safety in patients with the suspected or definitive MRSA infections.
Methods : To evaluate the correlation between the vancomycin trough concentration and the area under the curve over 24 hours to the MIC (AUC/MIC) ratio according to the guideline recent- ly published. A retrospective cohort study was conducted on adult patients treated for MRSA proven pneumonia with the vancomycin. We enrolled patients administered with the vancomy-
Vancomycin is a mainstay of treatment of serious methicillin-resistant Staphylococ- cus aureus (MRSA) infections. Since the first guideline in 2009 for the therapeutic drug monitoring on vancomycin for adult patients with severe MRSA infection, the optimal trough concentration with 15 to 20 mg/L had been considered as the surrogate marker for the most accurate and practical method to monitor efficacy and toxicity.1) Because it could be very difficult to obtain multiple vancomycin concentrations to cal- culate the AUC and AUC/MIC ratio in the clinical situation, trough concentration mon- itoring was used as a surrogate marker for AUC.
Recently published guideline on vancomy- cin monitoring recommends that a vancomy- cin loading dose of 20 to 35 mg/kg can be considered and that an individualized target
AUC/MIC ratio of 400 to 600 should be advo- cated to achieve clinical efficacy while im- proving patient safety in patients with sus- pected or definitive serious MRSA infections.2) However, in Samsung Medical Center (SMC), the vancomycin’s dosage regimen with load- ing dose still has been adjusted by using the through concentration of 15 to 20 mg/L to treat MRSA pneumonia.
The objective of this study was to evaluate retrospectively the correlation between van- comycin trough concentration and the AUC/
MIC ratio in MRSA pneumonia.
Methods
Study design and population
A retrospective cohort study was conduct- ed at SMC, a 1989-bed university affiliated cin loading dose before the maintenance dose and the monitored vancomycin trough concentra- tions at the steady state in medical intensive care units April 2017-March 2020. We calculated the vancomycin AUC/MIC ratio based on the trough concentration measured for each patient using the Bayesian software. The difference between the microbiological cure, all-cause mor- tality, and nephrotoxicity for each group was studied.
Results : There was low correlation between the vancomycin AUC/MIC and trough concentra- tion in MRSA pneumonia. A total of 35 patients were included. Thirty-one patients (88.6%) were above the AUC/MIC ratio 400, while 19 patients (54.3%) were in the trough range above 15 mcg/
ml. Although there was a weak correlation between the vancomycin trough concentration and the AUC/MIC ratio (r=0.427, p=0.010), the vancomycin through concentrations at the steady state within the therapeutic ranges did not mean the vancomycin AUC/MIC ratio within the therapeutic ranges (p=0.580). No significant difference was observed in the microbiological cure, all-cause mortality, and incidence of acute kidney injury in each group.
Conclusion : The trough level-guided monitoring of the vancomycin should be replaced by the AUC/MIC ratio-guided monitoring in the clinical practice in Korea.
[Key words] Vancomycin, Trough concentration, AUC/MIC ratio, MRSA pneumonia
tertiary referral hospital in Seoul, South Korea. The records of adult patients treated for MRSA proven pneumonia with vancomy- cin in medical intensive care unit. The study period was from April 2017 to March 2020.
Patients who received vancomycin for less than 72 h and patients without a vancomycin trough concentration were excluded from the analysis. Patient’s demographics char- acteristics, laboratory data and underlying diseases were collected from electronic med- ical records. This study was approved by the hospital’s Institutional Review Board (IRB No. 2020-04-217).
SMC IV vancomycin protocol
Vancomycin loading dose (LD) regimen was developed in April 2017 in SMC to attain therapeutic vancomycin concentration rap- idly and optimize AUC/MIC ratio.3) Initial vancomycin dose of 25 mg/kg of actual body weight was recommend in our hospital’s guideline as a loading dose. And then fol- lowed by 15~20 mg/kg every 12 hours for the maintenance doses. Vancomycin trough concentration (Ctrough) was obtained just before the fourth dose at steady-state con- ditions. Vancomycin concentrations were analyzed using a kinetic interaction of mi- croparticles in a solution (cobas c702 mod- ule, Roche Diagnostics GmbH, Germany).
The therapeutic drug monitoring of Ctrough was conducted by clinical pharmacist during the ICU multidisciplinary team rounding.
Target Ctrough was 15~20 mg/L.
Estimation of vancomycin AUC/MIC ratio
From the previous vancomycin concentra- tions, dosing interval, doses, patient sex,
age, weight, serum creatinine level, and MIC, we retrospectively estimated vanco- mycin AUC/MIC ratio for each patient using Antibiotic KineticsTM software (RxKinetics, School of Pharmacy and Health Profession, Creighton University, USA).4)
Outcome measures
We evaluated the correlation of vancomy- cin AUC/MIC ratio value versus Ctrough.
The patients with AUC/MIC ratio were di- vided into three groups of less than 400, be- tween 400 and 600, and over 600. Based on trough concentrations for the same patients, they were divided into less than 15 mg/L, between 15 and 20 mg/L, and over 20 mg/L.
The difference among these groups was studied in microbiological cure, all-cause mortality and the incidence of acute kidney injury.
Statistical analysis
Descriptive data were summarized by me- dian with IQR and percentages. Categorical variables were analyzed using Chi-square test. Comparisons between the three groups were performed using either Kruskal-Wallis test or ANOVA. The correlation analysis was performed to identify the correlation be- tween continuous variables after normality test. All statistical analyses were performed using SPSS statistics software version 25 (SPSS Inc., Chicago, IL, USA).
Results
Demographic patient characteristics
A total of 128 presumed MRSA pneumonia
Median, IQR
patients was screened, and 35 culture prov- en MRSA pneumonia patients were enrolled in the study. Demographics for the enrolled patients that received vancomycin are de- scribed in Table 1. Of those patients the me- dian age was 63 (22~84) years, mean weight 59 (32~98) kg, and 23 patients were male.
Twenty-two patients (62.9 %) were the MIC 1 mg/mL of vancomycin, 8 patients (22.8%) were MIC ≤ 0.5 mg/L, and 5 patients (14.3%) were MIC of 2 mg/L. All patients received their vancomycin per SMC protocol.
Correlation of vancomycin AUC/MIC ratio and trough concentration
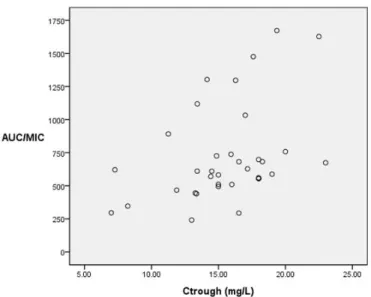
There was a positive correlation between the vancomycin AUC/MIC ratio and Ctrough (Fig. 1). As the result of correlation analysis by non-parametric test, Spearman’s rho was 0.427 (p < 0.010).
Twelve patients (34.3%) were in target AUC/MIC ratio (AUC/MIC ratio 400 to 600), 19 patients (54.3%) were above target AUC/
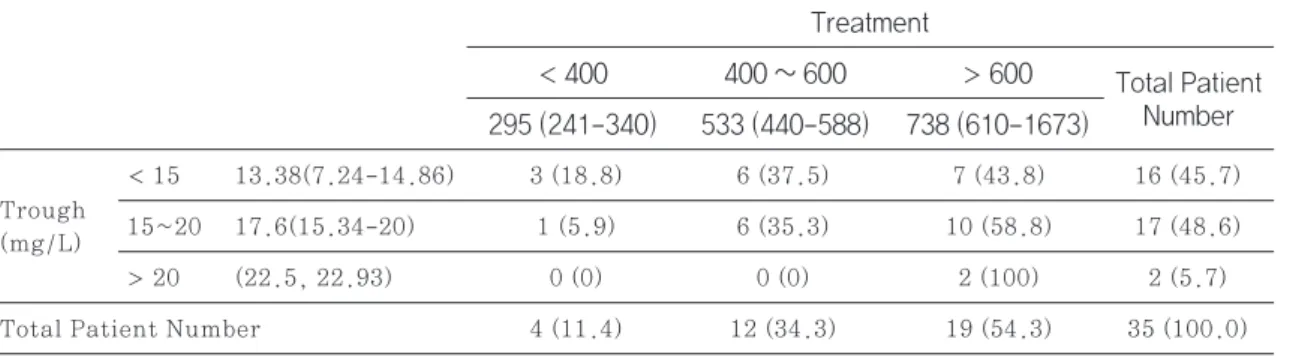
MIC ratio (AUC/MIC ratio > 600) and 4 pa- tients (11.4%) were below the AUC/MIC ratio (AUC/MIC ratio < 400). Seventeen patients (48.6%) were in the target trough level (15~20 mg/L), 2 patients (5.7%) were above trough level (trough > 20 mg/L) and 16 pa- tients (45.7%) were below trough level (trough < 15 mg/L) (Table 2). It was 35.3 % of target AUC/MIC ratio in the target trough level group (Fig. 2). Thirty-one patients (88.6%) were shown above AUC/MIC 400.
Clinical outcomes
There were no significant differences in microbiological cure (p > 0.999), all-cause mortality within 90 days (p=0.126), and ne-
Age, years 63 (22-84)
Male 23 (66)
Weight 59 (32-98)
BMI*, kg/m2 22.0 (13.0-35.1)
CRP†, mg/dL 12.1 (0.9–34.1)
Serum lactate, mmol/dL 1.5 (1.1–2.0) Blood urea nitrogen, mg/dL 22 (9.3-46.8) Serum creatinine, mg/dL 0.76 (0.27-2.72) Estimated GFR‡, L/min/1.73 m2 98.9 (18.5-170.4) Comorbidities
Diabetes 9 (25.7)
Cardiovascular disease 4 (11.4) Cerebrovascular disease 1 (2.9) Chronic lung disease 8 (22.9) Chronic kidney disease 1 (2.9)
Dialysis 0 (0.0)
Chronic liver disease 4 (11.4)
Solid cancer 7 (20)
Hematological malignancy 3 (8.6) Solid organ transplant 2 (5.9) Autoimmune disease 3 (8.6) Immunosuppressant use 6 (17.1) Vancomycin MIC§
≤ 0.5 8 (22.8)
1 22 (62.9)
2 5 (14.3)
Concomitant medication with nephrotoxicity
Colistin 13 (37.1)
Piperacillin/tazobactam 11 (31.4) Table 1 Demographic data
Characteristics (n= 35)
Values are median with IQR or no (%).
MRSA, methicillin-resistant Staphylococcus aureus; *BMI:
body mass index; †CRP, C-reactive protein; ‡GFR, glomerular filtration rate; §MIC, minimum inhibitory concentration
Fig. 1 Scatter gram of vancomycin trough level versus AUC/MIC ratio (Spearman’s rho, r=0.427, p=0.010)
Fig. 2 Discrepancy between vancomycin target AUC/MIC ratio and trough concentration (p = 0.580)
AUIC: AUC/MIC ratio, area under the curve over 24 hours to MIC; Ctrough: trough concentration at steady state. The gray area means an optimal therapeutic range.
phrotoxicity (p > 0.999) in target Ctrough groups (15~20 mcg/ml). There was also no significant differences in microbiological cure (p > 0.999), all-cause mortality within 90 days (p=0.259), and nephrotoxicity (p=
0.799) in target AUC/MIC ratio groups (400
~600) (Table 3).
Discussion
This is the first study in Korea to show the correlation between vancomycin trough con- centration at steady-state and AUC/MIC in critically ill patients with microbiologically confirmed MRSA pneumonia.
Most current data have demonstrated that trough concentrations may not be optimal
surrogate marker for AUC values. Trough- only monitoring, with a target of 15 to 20 mg/L, is no longer recommended based on efficacy and nephrotoxicity data in patients with serious infections due to MRSA.5),6)
Vancomycin is a large-weighted and hy- drophilic molecule that penetrated the lung parenchyma poorly even that is inflamed.
The past clinical guidelines on vancomycin monitoring recommended high trough levels within 15 to 20 mg/L to achieve successful treatment for MRSA infection. However, re- cent studies have been showing that using the optimal AUC/MIC ratio calculated with MIC to MRSA and AUC of vancomycin rather than through concentration to adjust the vancomycin dosage regimen increases the Trough
(mg/L)
Total Patient Number
< 15 13.38(7.24-14.86) 3 (18.8) 6 (37.5) 7 (43.8) 16 (45.7) 15~20 17.6(15.34-20) 1 (5.9) 6 (35.3) 10 (58.8) 17 (48.6)
> 20 (22.5, 22.93) 0 (0) 0 (0) 2 (100) 2 (5.7)
4 (11.4) 12 (34.3) 19 (54.3) 35 (100.0) Table 2 Discrepancy between vancomycin AUC/MIC ratio and trough concentration (p=0.580)§
Treatment
< 400 295 (241-340)
400 ~ 600 533 (440-588)
> 600 Total Patient Number 738 (610-1673)
§Fisher’s exact test
Values are medina with IQR or n (%).
Microbiological cure 13 (76.5%) > 0.999 10 (83.3 %) > 0.999
All-cause mortality 7 (41.2 %) 0.126 4 (33.3 %) 0.259
Nephrotoxicity 7 (41.2%) > 0.999 6 (50%) 0.799
Table 3 Clinical outcomes in Ctrough groups and AUC/MIC ratio groups
Clinical outcome Target trough (15 – 20 mcg/mL)
n (%)
Target AUC/MIC (400 – 600)
n (%) p-value
p-value
n, patient number
clinical outcomes and decreases vancomycin induced toxicity.3)-7)
We demonstrated that the vancomycin through concentrations within the thera- peutic ranges did not mean that the vanco- mycin AUC/MIC ratio within the therapeutic ranges though there was a positive correla- tion between AUC/MIC ratio values and trough levels at steady state. Only thir- ty-five percent of the trough concentrations within therapeutic range was optimal AUC/
MIC ratio with 400 to 600. This discordance between optimal AUC/MIC ratio and trough ranges showed the trough value, a single exposure point before administration is not the surrogate pharmacokinetic factor that integrated quantity of cumulative vancomy- cin exposure.
Especially, among sixteen patients below trough level (trough < 15 mg/L), thirteen patients (81.3%) were shown above AUC/
MIC 400. According to 2009 guideline on vancomycin trough monitoring, even though AUC/MIC ratio was above 400, the doses of vancomycin could be increased to maintain the trough concentration of 15 to 20 mg/L. It might be that the vancomycin dose was un- necessarily overdosed.
Neely and colleagues8) simulated that ther- apeutic AUC of ≥ 400 mg·h/liter for an or- ganism for which the vancomycin MIC is 1 mg/L approximately 60% are expected to have a trough concentration below the sug- gested minimum target of 15 mg/L for seri- ous infections, which could result in need- lessly increased doses and a risk of toxicity.
Like our study results, they indicated that adjustment of vancomycin doses on the basis of trough concentrations without a Bayesian tool resulted in poor achievement of maxi- mally safe drug exposures in plasma and
that many adults could have an adequate vancomycin AUC with a trough concentra- tion of <15 mg/L. While it has been difficult to calculate AUC in the clinical setting in the past, recently Bayesian software programs can be used to generate accurate and relia- ble estimates of the daily AUC values with peak and trough PK sampling. The AUC/
MIC ratio-guided monitoring of vancomycin should be considered instead of trough lev- el-guided monitoring to provide appropriate and safe dosage.
In vancomycin pharmacokinetic and phar- macodynamics aspects, its activities are time-dependent and slow bactericidal ef- fect. In vancomycin, pharmacodynamic pa- rameter associated with clinical effective- ness is therapeutic AUC/MIC ratio.9),10) AUC/
MIC ratio-guided vancomycin dosing is needed to replace trough-only monitoring in practice to improve clinical outcome.11),12)
In critically ill patients with MRSA pneu- monia, the clinical outcome is known to be affected by many factors such as comorbidi- ties, severity of infection and organ dys- functions. It might be very encouraging if we confirmed the appropriate vancomycin AUC/MIC ratio could be increased the clini- cal cure in critically ill patients with MRSA pneumonia.
However, in our study the therapeutic range of the through concentration as well as AUC/MIC ratio had no relation with clini- cal outcomes or nephrotoxicity. Unfortu- nately, this study might lack power to dis- criminate relationship between AUC/MIC ratio and clinical outcomes that could be caused by the small sample size of thir- ty-five patients enrolled.
Although the vancomycin AUC/MIC ratio of 400 to 600 was recommended to be optimal in
serious infection to achieve clinical efficacy and improve patient safety,13),14) our study demonstrated that nephrotoxicity was not related to AUC/MIC ratio even more than 600. Considering poor penetration of vanco- mycin to lung parenchyma, even in pneumo- nia, higher target AUC/MIC ratio might be optimal. Prospective studies with large pa- tients are warranted to confirm the optimal AUC/MIC ratio therapeutic range in MRSA pneumonia.
As with any major practice of change in therapeutic drug monitoring, education is essential to the implementation of AUC/MIC ratio-based dosing under the initiative of a clinical pharmacist. Clinical pharmacist should provide the background and ration- ale for AUC/MIC ratio based vancomycin dosing.
Clinical pharmacist can provide our study as a good evidence for adjusting the vanco- mycin’s dosage to AUC/MIC ratio rather than the minimum concentration and change the old-fashioned practice of vancomycin trough-only monitoring.
There are several limitations in our study.
First, the sample size was quite small. Es- pecially, there were only four patients under 400 of vancomycin AUC/MIC ratio. Second, this was a retrospective study and there were difficulties in evaluating the effects or side effects of vancomycin. Third, pharma- cokinetic parameters were estimated on the Bayesian method by the software using one vancomycin trough concentration measured at fourth dose after administration of van- comycin. Not all Ctrough samples might be within the first 24 to 48 hours. It’s very im- portant to achieve early therapeutic AUC/
MIC ratio within the first 24 to 48 hours to improve clinical outcome.15) A follow-up
study of AUC/MIC ratio calculated based on the concentration of vancomycin within the first 24 to 48 hours is needed.
In conclusion, we confirmed a low correla- tion between vancomycin trough concentra- tion and AUC/MIC ratio and discordance be- tween optimal AUC/MIC ratio and trough ranges. Trough level-guided monitoring of vancomycin should be replaced by AUC/MIC ratio-guided monitoring.
References
1) Rybak M, Lomaestro B, Rotschafer JC et al. Therapeutic monitoring of vancomy- cin in adult patients: a consensus review of the American Society of Health-Sys- tem Pharmacists, the Infectious Diseas- es Society of America, and the Society of Infectious Diseases Pharmacists. Ad- vanced Drug Delivery Reviews. 2009;
66(1):82-98.
2) Rybak MJ, Le J, Lodise TP et al. Thera- peutic monitoring of vancomycin for se- rious methicillin-resistant Staphylococ- cus aureus infections: A revised con- sensus guideline and review by the American Society of Health-System Ph- armacists, the Infectious Diseases Soci- ety of America, the Pediatric Infectious Diseases Society, and the Society of In- fectious Diseases Pharmacists. Ameri- can Journal of Health-System Pharma- cy. 2020;77(11):835-64.
3) Reardon J, Lau TT, Ensom MH. Vanco- mycin loading doses: a systematic re- view. Annals of Pharmacotherapy. 2015;
49(5):557-65.
4) Fuchs A, Csajka C, Thoma Y et al.
Benchmarking therapeutic drug moni- toring software: a review of available
computer tools. Clinical Pharmacokinet- ics. 2013;52(1):9-22.
5) Pai MP, Neely M, Rodvold KA et al. In- novative approaches to optimizing the delivery of vancomycin in individual pa- tients. Advanced Drug Delivery Re- views. 2014;77:50-7.
6) Mohr JF, Murray BE. Point: Vancomycin is not obsolete for the treatment of in- fection caused by methicillin-resistant Staphylococcus aureus. Clinical Infec- tious Diseases. 2007;44(12):1536-42.
7) Patel N, Pai MP, Rodvold KA et al. Van- comycin: we can’t get there from here.
Clinical Infectious Diseases. 2011;52(8):
969-74.
8) Neely MN, Youn G, Jones B et al. Are vancomycin trough concentrations ade- quate for optimal dosing? Antimicrobial Agents and Chemotherapy. 2014;58(1):
309-16.
9) Rybak MJ. The pharmacokinetic and pharmacodynamic properties of vanco- mycin. Clinical Infectious Diseases.
2006;42(Suppl 1):S35-9.
10) Brown J, Brown K, Forrest A. Vanco- mycin AUC24/MIC ratio in patients with complicated bacteremia and infec- tive endocarditis due to methicillin-re- sistant Staphylococcus aureus and its association with attributable mortality during hospitalization. Antimicrobial Agents and Chemotherapy. 2012;56(2):
634-8.
11) Jung Y, Song KH, Cho J et al. Area un- der the concentration-time curve to minimum inhibitory concentration ra- tio as a predictor of vancomycin treat- ment outcome in methicillin-resistant Staphylococcus aureus bacteraemia.
International Journal of Antimicrobial
Agents. 2014;43(2):179-83.
12) Gawronski KM, Goff DA, Brown J et al.
A stewardship program’s retrospective evaluation of vancomycin AUC24/MIC and time to microbiological clearance in patients with methicillin-resistant Sta- phylococcus aureus bacteremia and os- teomyelitis. Clinical Therapeutics. 2013;
35(6):772-9.
13) Mogle BT, Steele JM, Seabury RW et al.
Implementation of a two-point phar- macokinetic AUC-based vancomycin therapeutic drug monitoring approach in patients with methicillin-resistant Staphylococcus aureus bacteraemia.
International Journal of Antimicrobial Agents. 2018;52(6):805-10.
14) Finch NA, Zasowski EJ, Murray KP et al. A Quasi-Experiment To Study the Impact of Vancomycin Area under the Concentration-Time Curve-Guided Do- sing on Vancomycin-Associated Ne- phrotoxicity. Antimicrobial Agents and Chemotherapy. 2017;61(12).
15) Casapao AM, Lodise TP, Davis SL et al.
Association between vancomycin day 1 exposure profile and outcomes among patients with methicillin-resistant Staphylococcus aureus infective endo- carditis. Antimicrobial Agents and Che- motherapy. 2015;59(6):2978-85.