R E S E A R C H A R T I C L E Open Access
Risk Factors of Stroke in Western and Asian
Countries: A Systematic Review and Meta-analysis of Prospective Cohort Studies
Xuetao Chen 1,2 † , Liang Zhou 1 † , Yanqi Zhang 1 , Dali Yi 1 , Ling Liu 1 , Wen Rao 3 , Yazhou Wu 1 , Dihui Ma 1 , Xiaoyu Liu 1 , Xiao-Hua Andrew Zhou 4 , Hui Lin 5 , Dixiang Cheng 6 and Dong Yi 1*
Abstract
Background: There has been an increasing trend in the incidence of stroke worldwide in recent years, and the number of studies focusing on the risk factors for stroke has also increased every year. To comprehensively evaluate the risk factors of stroke identified in prospective Western and Asian cohort studies.
Methods: Population-based cohort studies on stroke were searched in databases (PubMed, EMBASE, Web of Science, Google Scholar, etc.), and the library of the Third Military Medical University was manually searched for relevant information. A meta-analysis of Western and Asian studies on risk factors was performed. The pooled hazard ratios (HRs) with 95% confidence intervals (CIs) were calculated to assess the final group of cohort studies.
Results: After screening, 22 prospective cohort studies were included in the analyses of this investigation. Two factors, smoking and alcohol consumption, showed statistically significant differences between Western and Asian populations, and the results were as follows (W/A): 2.05 (95% CI, 1.68 ~ 2.49)/1.27 (95% CI, 1.04 ~ 1.55) and 0.89 (95% CI, 0.76 ~ 1.04)/1.28 (95% CI, 1.07 ~ 1.53). The factor BMI = 18.5-21.9 kg/m 2 showed statistically significant differences only in Western populations, 0.96 (95% CI, 0.93 ~ 0.99); the factor SBP = 120-139 mm Hg showed statistically significant differences only in Asian populations, 2.29 (95% CI, 1.04 ~ 5.09).
Conclusions: The prevalences of risk factors affect the stroke morbidity in Western and Asian populations, which may be biased by race. The meta-analysis of population-based studies suggests that different preventive measures should be adopted for Western and Asian population groups that are at high risk for stroke.
Keywords: Stroke, Risk factors, Prospective study, Epidemiology, Systematic review, Public health
Background
Stroke is not only the second leading cause of death worldwide but also one of the main causes of adult- acquired disabilities [1,2]. In certain countries, the incidence of stroke has increased over time. For example, the incidence of stroke in the city of Frederiksberg in Denmark increased from 618/100,000 during the period from 1972–1974 to 1,190 per 100,000 during the period from 1989 –1990 [3], and the incidence of stroke among males in Gothenburg, Sweden increased by 35% per year from 1985 to 1990 [4]. In recent years, the
incidence of stroke has gradually increased among younger populations. In a region of Western Norway, the incidence of ischemic stroke among young adults was 11.4/100,000 between 1988 and 1997, with women accounting for the majority of patients who experienced a stroke before reaching 30 years of age and males accounting for the majority of patients who experienced a stroke after 30 years of age [5]. In India, the prevalence of stroke is 1.54, with a death rate of 0.6 per 1,000 population; the age-adjusted stroke mortality is believed to be 60% higher in South-East Asia than in European populations [6]. The same situation exists in Iran; a systematic review reported that the stroke prevalence for various ages in Iran ranges from 23 to 103 per 100,000 populations [7].
* Correspondence: [email protected]
†
Equal contributors
1
Department of Health Statistics, College of Preventive Medicine, Third Military Medical University, PO Box 400038, Chongqing, China Full list of author information is available at the end of the article
© 2014 Chen et al.; licensee BioMed Central Ltd. This is an Open Access article distributed under the terms of the Creative Commons Attribution License (http://creativecommons.org/licenses/by/4.0), which permits unrestricted use, distribution, and reproduction in any medium, provided the original work is properly credited. The Creative Commons Public Domain Dedication waiver (http://creativecommons.org/publicdomain/zero/1.0/) applies to the data made available in this article, unless otherwise stated.
Chen et al. BMC Public Health 2014, 14:776
http://www.biomedcentral.com/1471-2458/14/776
There have been numerous recent research reports regarding the risk factors for stroke, which include not only unhealthy lifestyle habits such as smoking and drinking but also hypertension, diabetes, and a family history of diseases, among other traits [8-18]. However, different sets of risk factors and risk intensities have been identified by various studies, and no comprehensive systematic review has compiled and summarized the findings of these studies. In this investigation, based on a large number of prospective cohort studies from around the world, a systematic review and a meta-analysis were conducted to summarize the risk factors for stroke in Western and Asian populations.
Methods
Our investigation was conducted as suggested by the Meta-analysis of Observational Studies in Epidemiology (MOOSE) group [19]. A detailed query strategy and inclusion and exclusion criteria were developed, and the relevant literature was screened for inclusion using these standards. Two research groups were established. The first research group was responsible for searching for and reviewing relevant studies and extracting the original data from these investigations. The second group evaluated the quality of the included studies. Finally, pooled statistics describing various effects were calculated.
Systematic literature search
The following electronic literature databases were searched: PubMed, EMBASE (the Excerpta Medica Database), Web of Science, Google Scholar, the Chinese Biomedical Literature Database (CBM), the integrated Chinese Medical Citation Index/Chinese Medical Current Contents (CMCI/CMCC) database, and the Cochrane Central Register of Controlled Trials (CENTRAL) database of the Cochrane Library. The following search terms were utilized: ((((((((stroke) OR ischemic) OR hemorrhagic) OR observational study) OR cohort study) AND risk factors) OR incidence) OR mortality) AND prospective study. In addition, the library of the Third Military Medical University was manually searched for relevant information. The period specified in these searches ranged from the creation date of each database to May 2013.
Inclusion and exclusion criteria
Studies were included if they met the following criteria:
① The included studies were prospective, population-based cohort studies; ② The included studies involved research participants who were volunteers from a community or hospital, with no limitations placed on sex, age, or type of stroke, although the participants were required to be free from any complicating infectious or traumatic conditions;
③ The included studies were required to provide HRs for
the risk factors; ④ The observation endpoint of the included studies was the onset of stroke; ⑤ The included studies were required to base the determination of disease on internationally adopted professional diagnostic criteria [20,21]; ⑥ Comparability of the cohorts was required on the basis of the design or analysis; ⑦ The included studies were required to provide a full contingency table and/or ad- justed HR/RR (relative risk) values.
The exclusion criteria included the following: ① Studies examining populations that might be affected by interac- tions between genes and the environment, such as the Asian-American population, were excluded; ② Case control studies and other retrospective studies were excluded from consideration; ③ Duplicate publications, animal experiments, reviews, and systematic reviews were excluded from consideration.
Selection and data extraction
The retrieved literature was carefully reviewed, and various information was extracted for each examined study, including the study’s first author, publication year, sample size, study type, population characteristics, study endpoint, and HR/RR values and 95% confidence intervals (CIs) (or a contingency table). The data were independently extracted in a blinded manner by two researchers (LZ and XC) from the first research group. A third researcher (LL) from this research group was consulted to resolve discrepancies in the extracted data, and a consensus was reached through discussion.
Quality assessment and statistical analyses
The included observational studies were subjected to a comprehensive quality assessment using the Newcastle- Ottawa Scale as a guide [22]. This quality evaluation was performed in a blinded manner by two researchers (YW and YZ) from the second research team, who assigned quality scores to the included studies. The studies that were given different quality scores by the two researchers were referred to a third researcher (DY) from this research team for evaluation, and a final quality score was obtained.
Q tests were conducted to determine the heterogeneity of the included studies. If I 2 ≥ 50% and P < 0.1, a random-effects model was used to combine the studies;
by contrast, if I 2 ≤ 50% and P > 0.1, a fixed-effects model was used to combine the studies. The adjusted HR was used to measure the effect sizes for the pooled prospective cohort studies, and 95% CIs were determined for the pooled studies. Egger’s regression test was used to verify the absence of publication bias, and by model transformation between the fixed effects model and random effects model for the sensitivity analysis. The fundamental approach utilized in this non-parametric method involves first trimming (removing) small sample studies that cause
Chen et al. BMC Public Health 2014, 14:776 Page 2 of 13
http://www.biomedcentral.com/1471-2458/14/776
funnel plot asymmetries. The trimmed symmetric re- mainder is then used to estimate the center value of the funnel plot, and the removed studies and their corre- sponding estimated missing values are then entered into the plot on both sides of this center value [23], enabling an assessment of the stability of the entire systematic review. All of the statistical analyses were conducted using the Stata 11.0 software package.
Results Included studies
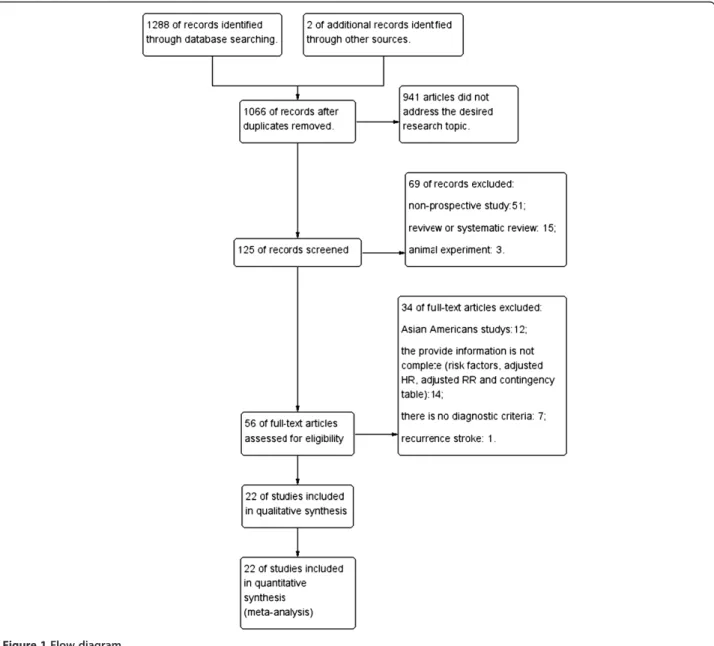
The database search resulted in the identification of 1,288 articles; in addition, 2 conference-related publications were identified from other sources. In total, 224 of these articles were duplicates that had been identified in multiple electronic databases, and 941 articles did not
address the desired research topic; thus, 125 studies were included in the initial screening (including 123 articles and two conference-related publications). The initial screening of the abstracts of these studies resulted in the exclusion of 51 non-prospective cohort studies, 15 reviews or systematic reviews, and 2 animal studies. The full-text versions of the remaining 56 articles were then assessed, and 34 articles that did not meet the inclusion criteria were excluded from consideration. Ultimately, 22 prospective cohort studies were included in this systematic review and meta-analysis (Figure 1 and Table 1).
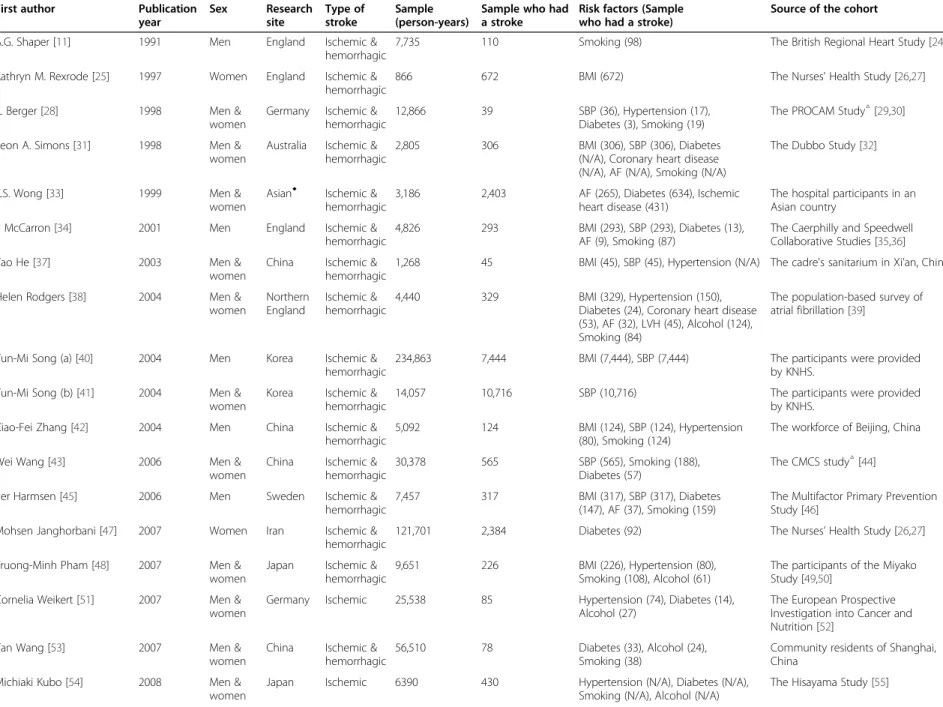
Study characteristics
This study examined data reported by researchers from Western (North America, Europe, and Oceania) and Asian (East Asia, South Asia, and Southeast Asia) countries. In
Figure 1 Flow diagram.
Chen et al. BMC Public Health 2014, 14:776 Page 3 of 13
http://www.biomedcentral.com/1471-2458/14/776
Table 1 Characteristics of the prospective studies on stroke
First author Publication
year
Sex Research
site
Type of stroke
Sample (person-years)
Sample who had a stroke
Risk factors (Sample who had a stroke)
Source of the cohort
A.G. Shaper [11] 1991 Men England Ischemic &
hemorrhagic
7,735 110 Smoking (98) The British Regional Heart Study [24]
Kathryn M. Rexrode [25] 1997 Women England Ischemic &
hemorrhagic
866 672 BMI (672) The Nurses' Health Study [26,27]
K. Berger [28] 1998 Men &
women
Germany Ischemic &
hemorrhagic
12,866 39 SBP (36), Hypertension (17),
Diabetes (3), Smoking (19)
The PROCAM Study
△[29,30]
Leon A. Simons [31] 1998 Men &
women
Australia Ischemic &
hemorrhagic
2,805 306 BMI (306), SBP (306), Diabetes
(N/A), Coronary heart disease (N/A), AF (N/A), Smoking (N/A)
The Dubbo Study [32]
K.S. Wong [33] 1999 Men &
women
Asian
◆Ischemic &
hemorrhagic
3,186 2,403 AF (265), Diabetes (634), Ischemic heart disease (431)
The hospital participants in an Asian country
P McCarron [34] 2001 Men England Ischemic &
hemorrhagic
4,826 293 BMI (293), SBP (293), Diabetes (13),
AF (9), Smoking (87)
The Caerphilly and Speedwell Collaborative Studies [35,36]
Yao He [37] 2003 Men &
women
China Ischemic &
hemorrhagic
1,268 45 BMI (45), SBP (45), Hypertension (N/A) The cadre's sanitarium in Xi ’an, China
Helen Rodgers [38] 2004 Men &
women
Northern England
Ischemic &
hemorrhagic
4,440 329 BMI (329), Hypertension (150),
Diabetes (24), Coronary heart disease (53), AF (32), LVH (45), Alcohol (124), Smoking (84)
The population-based survey of atrial fibrillation [39]
Yun-Mi Song (a) [40] 2004 Men Korea Ischemic &
hemorrhagic
234,863 7,444 BMI (7,444), SBP (7,444) The participants were provided
by KNHS.
Yun-Mi Song (b) [41] 2004 Men &
women
Korea Ischemic &
hemorrhagic
14,057 10,716 SBP (10,716) The participants were provided
by KNHS.
Xiao-Fei Zhang [42] 2004 Men China Ischemic &
hemorrhagic
5,092 124 BMI (124), SBP (124), Hypertension
(80), Smoking (124)
The workforce of Beijing, China
Wei Wang [43] 2006 Men &
women
China Ischemic &
hemorrhagic
30,378 565 SBP (565), Smoking (188),
Diabetes (57)
The CMCS study
△[44]
Per Harmsen [45] 2006 Men Sweden Ischemic &
hemorrhagic
7,457 317 BMI (317), SBP (317), Diabetes
(147), AF (37), Smoking (159)
The Multifactor Primary Prevention Study [46]
Mohsen Janghorbani [47] 2007 Women Iran Ischemic &
hemorrhagic
121,701 2,384 Diabetes (92) The Nurses ’ Health Study [ 26,27]
Truong-Minh Pham [48] 2007 Men &
women
Japan Ischemic &
hemorrhagic
9,651 226 BMI (226), Hypertension (80),
Smoking (108), Alcohol (61)
The participants of the Miyako Study [49,50]
Cornelia Weikert [51] 2007 Men &
women
Germany Ischemic 25,538 85 Hypertension (74), Diabetes (14),
Alcohol (27)
The European Prospective Investigation into Cancer and Nutrition [52]
Yan Wang [53] 2007 Men &
women
China Ischemic &
hemorrhagic
56,510 78 Diabetes (33), Alcohol (24),
Smoking (38)
Community residents of Shanghai, China
Michiaki Kubo [54] 2008 Men &
women
Japan Ischemic 6390 430 Hypertension (N/A), Diabetes (N/A),
Smoking (N/A), Alcohol (N/A)
The Hisayama Study [55]
Chen et al. BMC Public Health 2014, 14 :776 Page 4 of 13 http://ww w.biomedce ntral.com/1 471-2458/14/776
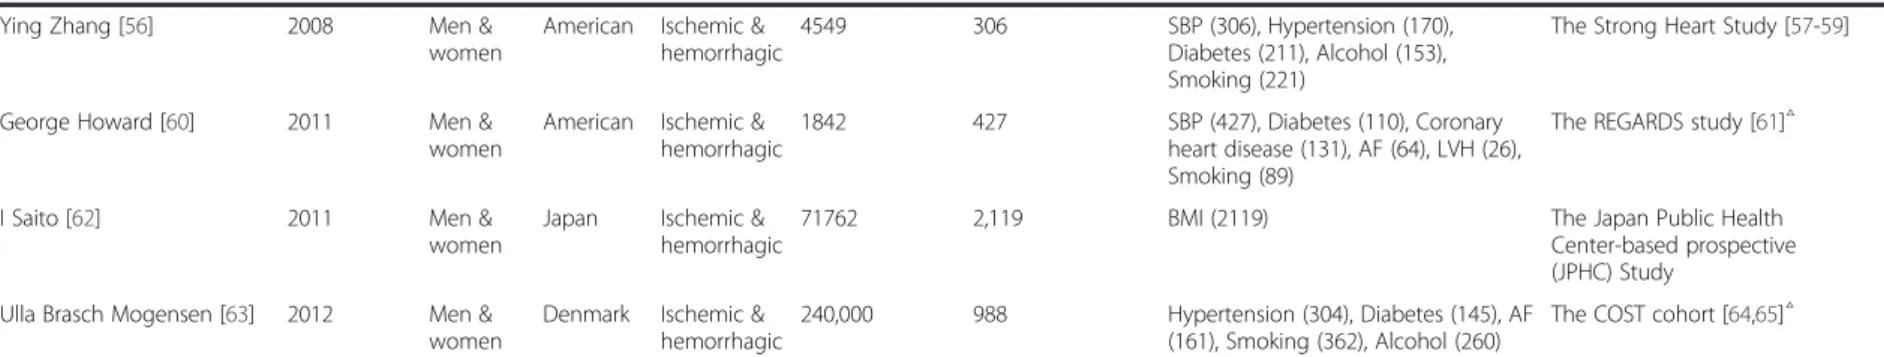
Table 1 Characteristics of the prospective studies on stroke (Continued)
Ying Zhang [56] 2008 Men &
women
American Ischemic &
hemorrhagic
4549 306 SBP (306), Hypertension (170),
Diabetes (211), Alcohol (153), Smoking (221)
The Strong Heart Study [57-59]
George Howard [60] 2011 Men &
women
American Ischemic &
hemorrhagic
1842 427 SBP (427), Diabetes (110), Coronary
heart disease (131), AF (64), LVH (26), Smoking (89)
The REGARDS study [61]
△I Saito [62] 2011 Men &
women
Japan Ischemic &
hemorrhagic
71762 2,119 BMI (2119) The Japan Public Health
Center-based prospective (JPHC) Study
Ulla Brasch Mogensen [63] 2012 Men &
women
Denmark Ischemic &
hemorrhagic
240,000 988 Hypertension (304), Diabetes (145), AF (161), Smoking (362), Alcohol (260)
The COST cohort [64,65]
△CT: Computed tomography; MRI: Magnetic Resonance Imaging; N/A, no data available; ◆China, India, Indonesia, Korea, Malaysia, the Philippines, Taiwan, Thailand, Singapore, and Vietnam; △PROCAM the Prospective Cardiovascular Muenster Study; CMCS the Chinese Muhi Provincial Cohort Study; REGARDS, the Reasons for Geographic and Racial Differences in Stroke; COST, the Copenhagen Stroke Study. KNHS, Korean National Health System.; BMI, Body mass index; SBP, Systolic blood pressure; AF, Atrial fibrillation; LVH, Left ventricular hypertrophy.
Chen et al. BMC Public Health 2014, 14 :776 Page 5 of 13 http://ww w.biomedce ntral.com/1 471-2458/14/776
the 22 prospective cohort studies that were included in this investigation, the sample sizes ranged from a minimum of 39 cases to a maximum of 7,444 cases; 30,406 cases were examined in these studies. Eleven of the included studies involved Western populations, and the remaining 11 studies involved Asian populations. In 20 of the included studies, the outcomes included both ischemic stroke and hemorrhagic stroke, whereas the remaining 2 studies only examined ischemic stroke (Table 1).
Synthesis of results
This study examined 7 risk factors for stroke in human populations, including biochemical indices, lifestyle choices, and medical history. A meta-analysis produced pooled HRs with 95% CI values for each of these factors.
The combined results indicated that 6 factors affected the incidence of stroke in Western populations. These factors included BMI, SBP, hypertension, diabetes, cardiac causes, and smoking. The following pooled HR values with 95% CIs were obtained for these factors: 0.96 (0.93 ~ 0.99) for a BMI of 18.5-21.9 kg/m 2 ; 2.39 (1.44 ~ 3.97) for an SBP ≥140 mm Hg; 1.79 (1.39-2.30) for hypertension;
1.85 (1.43 ~ 2.38) for diabetes; 1.74 (1.47 ~ 2.04) for cardiac causes; and 2.05 (1.68 ~ 2.49) for smoking; However, 0.89 (0.76 ~ 1.04) for alcohol consumption (Table 2 and Additional files 1, 2, 3, 4, 5, 6, 7, 8).
In addition, in a subgroup analysis of smoking and cardiac causes, there was statistical significance in the 4 subgroups, including atrial fibrillation, current smoking, smoking ≤20 cigarettes/d and smoking >20 cigarettes/d.
The pooled HRs with 95% CI values were as follows:
1.59 (1.33 ~ 1.90), 2.27 (1.76 ~ 2.93), 2.31 (1.80 ~ 2.96) and 2.99 (2.31 ~ 3.86) (Table 2 and Additional files 5, 7).
The included studies of Asian populations indicated that 7 factors affected the incidence of stroke. These factors included BMI, SBP, hypertension, diabetes, cardiac causes, smoking and alcohol. The following pooled HR values with 95% CIs were obtained for these factors: 1.28 (1.15 ~ 1.46) for a BMI of ≥25.0 kg/m 2 ; 2.29 (1.04 ~ 5.09) for an SBP of 120–139 mm Hg; 6.22 (2.27 ~ 17.08) for an SBP ≥140 mm Hg; 2.84 (2.10-3.82) for hypertension;
1.95 (1.42 ~ 2.67) for diabetes; 1.87 (1.45 ~ 2.42) for cardiac causes; 1.27 (1.04 ~ 1.55) for smoking; and 1.28 (1.07 ~ 1.53) for alcohol consumption (Table 2 and Additional files 9, 10, 11, 12, 13, 14, 15, 16).
In the subgroup analysis of cardiac causes, there was statistical significance for atrial fibrillation. The pooled HR with the 95% CI was 2.30 (1.50 ~ 3.53) (Table 2 and Additional file 12).
Quality of the included studies
The Newcastle-Ottawa scale results revealed that 95.45%
of the included studies earned above 2 stars for the NOS selection item, 77.27% of the included studies
earned above 1 star for the NOS comparability item, and 36.36% of the included studies earned above 2 stars for the NOS exposure item (Table 3).
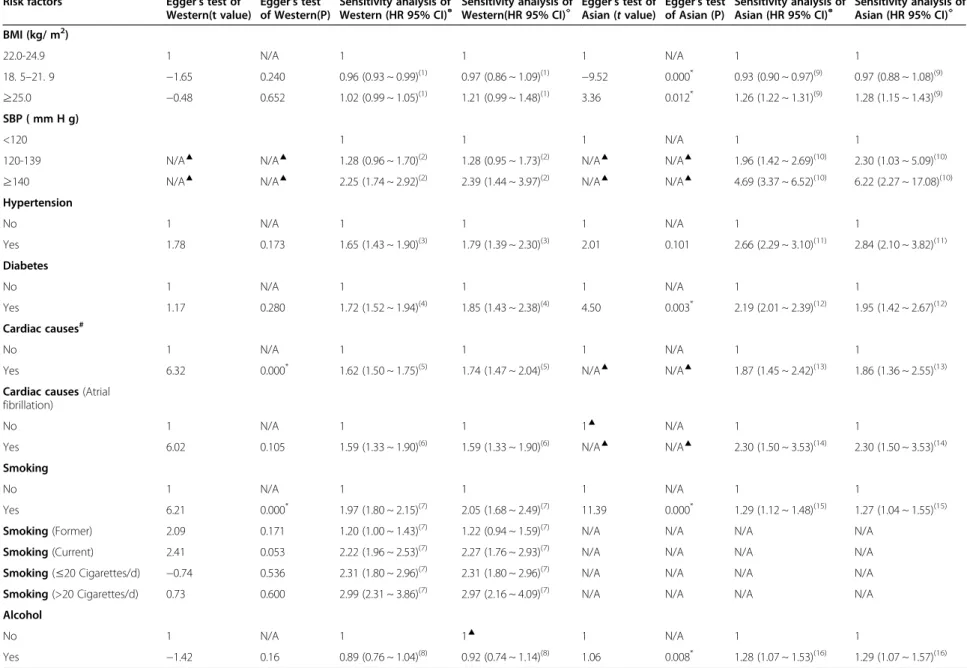
Egger's test was performed to assess the influential factors for each of the two populations that were examined (Table 4). Publication bias affected 2 factors in studies of Western populations: cardiac causes (t = 6.32, P = 0.000) and smoking (t = 6.21, P = 0.000). This analysis revealed that publication bias affected 4 factors in the studies of Asian populations: BMI = 22.0-24.9 kg/m 2 (t = −9.52, P = 0.000), BMI ≥25.0 kg/m 2 (t = 3.36, P = 0.012), diabetes (t = 4.50, P = 0.003), smoking (t = 11.39, P = 0.000) and alcohol (t = 1.06, P = 0.008).
By model transformation between the fixed effects model and random effects model for the sensitivity analyses of the included factors (Table 4). The sensitivity analysis results were consistent (Additional files 1, 2, 3, 4, 5, 6, 7, 8, 9, 10, 11, 12, 13, 14, 15, 16).
Discussion
This systematic review of prospective cohort studies on the incidence of stroke summarized 7 risk factors for stroke that have been reported with relatively high frequency in prior studies. The prospective cohort studies incorporated into this review examined 867,782 Western or Asian participants and included investigations of large cohorts and studies of small community groups.
To avoid biases attributable to differences in ethnicity and geography, the statistical analyses of the final combined results were stratified by Western or Asian population types.
Six factors affected the incidence of stroke in both Western and Asian populations. These factors included hypertension and diabetes, which are well-known risk factors for the incidence of stroke; thus, these findings are consistent with the results of earlier reports [66].
Studies have reported that a BMI ≥25 kg/m 2 is associated with increased mortality among middle-aged populations, particularly from cardiovascular and cerebrovascular diseases, which are the leading causes of death [67].
Previous studies have reported similar findings for obesity [68]; in our study, obesity was one of the risk factors for the onset of disease in Asian populations, and an elevated BMI was associated with greater risk (Figure 2). In addition, the result of the risks associated with a BMI ≥25 kg/m 2 was greater among Asian populations than among Western populations.
Stroke-related studies in the community of Framingham in the United States and the North Karelia region of Finland, as well as investigations of interventions for stroke-related risk factors in 7 Chinese cities, have con- firmed the existence of a correlation between blood pressure and stroke [69-74]. SBP, a direct indicator of hypertension, is also a factor that directly influences
Chen et al. BMC Public Health 2014, 14:776 Page 6 of 13
http://www.biomedcentral.com/1471-2458/14/776
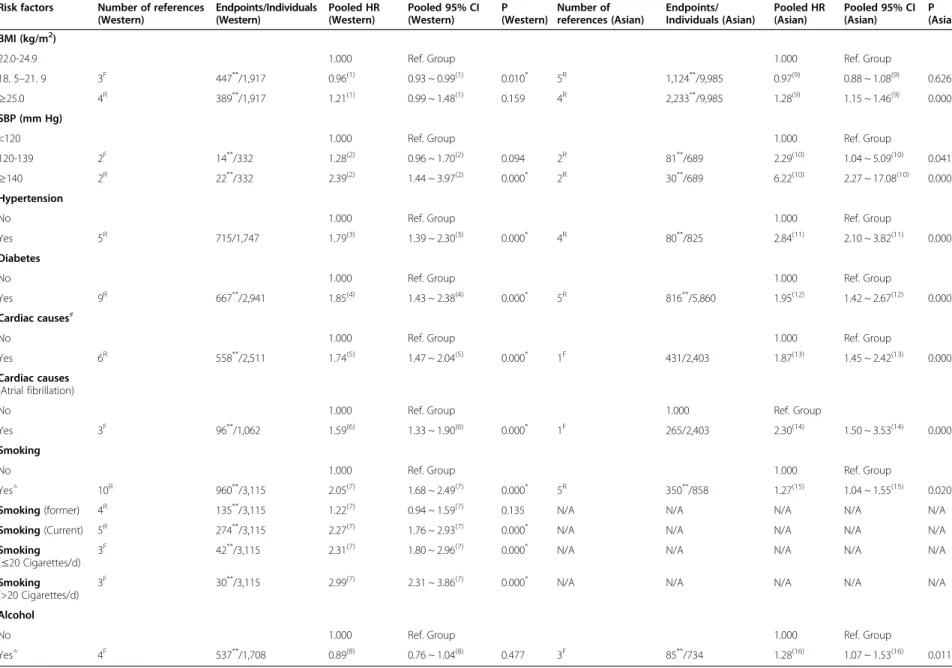
Table 2 Meta-analysis outcomes Risk factors Number of references
(Western)
Endpoints/Individuals (Western)
Pooled HR (Western)
Pooled 95% CI (Western)
P (Western)
Number of references (Asian)
Endpoints/
Individuals (Asian)
Pooled HR (Asian)
Pooled 95% CI (Asian)
P (Asian) BMI (kg/m
2)
22.0-24.9 1.000 Ref. Group 1.000 Ref. Group
18. 5 –21. 9 3
F447
**/1,917 0.96
(1)0.93 ~ 0.99
(1)0.010
*5
R1,124
**/9,985 0.97
(9)0.88 ~ 1.08
(9)0.626
≥25.0 4
R389
**/1,917 1.21
(1)0.99 ~ 1.48
(1)0.159 4
R2,233
**/9,985 1.28
(9)1.15 ~ 1.46
(9)0.000
*SBP (mm Hg)
<120 1.000 Ref. Group 1.000 Ref. Group
120-139 2
F14
**/332 1.28
(2)0.96 ~ 1.70
(2)0.094 2
R81
**/689 2.29
(10)1.04 ~ 5.09
(10)0.041
*≥140 2
R22
**/332 2.39
(2)1.44 ~ 3.97
(2)0.000
*2
R30
**/689 6.22
(10)2.27 ~ 17.08
(10)0.000
*Hypertension
No 1.000 Ref. Group 1.000 Ref. Group
Yes 5
R715/1,747 1.79
(3)1.39 ~ 2.30
(3)0.000
*4
R80
**/825 2.84
(11)2.10 ~ 3.82
(11)0.000
*Diabetes
No 1.000 Ref. Group 1.000 Ref. Group
Yes 9
R667
**/2,941 1.85
(4)1.43 ~ 2.38
(4)0.000
*5
R816
**/5,860 1.95
(12)1.42 ~ 2.67
(12)0.000
*Cardiac causes
#No 1.000 Ref. Group 1.000 Ref. Group
Yes 6
R558
**/2,511 1.74
(5)1.47 ~ 2.04
(5)0.000
*1
F431/2,403 1.87
(13)1.45 ~ 2.42
(13)0.000
*Cardiac causes (Atrial fibrillation)
No 1.000 Ref. Group 1.000 Ref. Group
Yes 3
F96
**/1,062 1.59
(6)1.33 ~ 1.90
(6)0.000
*1
F265/2,403 2.30
(14)1.50 ~ 3.53
(14)0.000
*Smoking
No 1.000 Ref. Group 1.000 Ref. Group
Yes
△10
R960
**/3,115 2.05
(7)1.68 ~ 2.49
(7)0.000
*5
R350
**/858 1.27
(15)1.04 ~ 1.55
(15)0.020
*Smoking (former) 4
R135
**/3,115 1.22
(7)0.94 ~ 1.59
(7)0.135 N/A N/A N/A N/A N/A
Smoking (Current) 5
R274
**/3,115 2.27
(7)1.76 ~ 2.93
(7)0.000
*N/A N/A N/A N/A N/A
Smoking
( ≤20 Cigarettes/d) 3
F42
**/3,115 2.31
(7)1.80 ~ 2.96
(7)0.000
*N/A N/A N/A N/A N/A
Smoking (>20 Cigarettes/d)
3
F30
**/3,115 2.99
(7)2.31 ~ 3.86
(7)0.000
*N/A N/A N/A N/A N/A
Alcohol
No 1.000 Ref. Group 1.000 Ref. Group
Yes
△4
F537
**/1,708 0.89
(8)0.76 ~ 1.04
(8)0.477 3
F85
**/734 1.28
(16)1.07 ~ 1.53
(16)0.011
**P values for comparison between the subjects who had a stroke and those who did not; **Insufficient data
#Cardiac causes: Coronary heart disease, Left atrial hypertrophy, Angina, Atrial fibrillation; F: Fixed effects model, R: Random effects model; N/A, no data available. BMI, Body mass index; SBP, Systolic blood pressure; Smoking/former: smoking cessation; Alcohol: Often drunk, △The statistical significance between Western and Asian populations; (1)-(16): (Additional files 1, 2, 3, 4, 5, 6, 7, 8, 9, 10, 11, 12, 13, 14, 15, 16).
Chen et al. BMC Public Health 2014, 14 :776 Page 7 of 13 http://ww w.biomedce ntral.com/1 471-2458/14/776
the incidence of stroke. However, the risk of stroke was elevated in hypertensive patients relative to patients exhi- biting high blood pressure without previously diagnosed hypertension [75]. The results of this study indicate that an increasing SBP is associated with an increased risk of stroke. In fact, the risk of stroke was greater among the participants with SBP ≥140 mm Hg than among the patients with diagnosed hypertension in both Asian and Western populations (Figure 2). A possible reason for this phenomenon is that most individuals diagnosed with hypertension have received appropriate anti-hypertensive
interventions. Previous studies have shown that patients diagnosed with stroke often receive antihypertensive medication [15,16]. From the results of our investigation, the risks associated with SBP ≥140 mm Hg is greater among Asian populations than among Western popula- tions. For example, the cohort studies of a workforce in China [42],which examined steelworkers in Beijing, China, found an age-adjusted RR of 5.6 among these individuals, which was higher than the RR of 3.5 obtained in the Framingham study [76]. In our previous retrospective study [77], the Rothman and Keller [78] model was utilized to establish a multivariate model for predicting the incidence of stroke in human populations. Consistent with previous reports, this model represented the occurrence of stroke resulting from the combined long-term effects of multiple risk factors [79]. Our prior results also explored the effects of the interactions between hypertension and other risk factors on the incidence of stroke. However, the question of whether changes in other risk factors could alter the intensity of the risk of hypertension with respect to the incidence of stroke in a particular population (Western or Asian) merits additional study and discussion.
The Busselton Study reported that atrial fibrillation is a risk factor for stroke, with an RR of 5.9 [80], and other studies have also consistently indicated that atrial fibrillation is a risk factor for stroke [81]. In our investigation, atrial fibrillation was again identified as a risk factor; the result for this factor in Western populations was 2.30 (1.50 ~ 3.53), and there was no difference in Asian populations by interval estimation (Table 2). Consistent with our results, cardiovascular-related diseases (such as angina and CHD) were identified as risk factors for stroke as early as the Framingham Study and related reports [82]. Previous studies have suggested that left ventricular hypertrophy (LVH) is not correlated with the occurrence of stroke [13]; however, our investigation indicated that LVH is a risk factor for stroke in Western populations. Therefore, effective measures for preventing stroke in Western populations include lifestyle improvements, appropriate treatments, and reductions in the morbidities associated with chronic cardiovascular and cerebrovascular diseases.
Smoking is a risk factor for stroke, and the HR values for smoking-related behaviors were relatively high in Western populations. After stratifying the results based on the periods during which smoking occurred, it was determined that former smoking had no effect on the incidence of stroke in Western populations. Certain prior studies have suggested that being a former smoker can affect the incidence of stroke [83-85], whereas other studies have found no significant effects associated with this characteristic [86]. We observed a dose–response association for the number of cigarettes smoked per day Table 3 The results of the Newcastle-Ottawa scale (NOS)
First author Publication year
Selection Comparability Exposure
Chinese population
Yao He
372003 ★★★ ★ ★★
Xiao-Fei Zhang
422004 ★★★ ★★ ★★★
Yan Wang
532007 ★★★ ★ ★
Wei Wang
432006 ★★ ★ ★★
Other population
A.G.Shaper
111991 ★★★ ★★ ★★
Kathryn M.
Rexrode
251997 ★★★ ★★ ★★
K. Berger
281998 ★★★ ★★ ★★★
Leon A. Simons
311998 ★★★ ★★ ★★
P McCarron
342001 ★★★★ ★★ ★★★
Cornelia Weikert
512007 ★★★★ ★★ ★★★
Per Harmsen
452006 ★★★ ★★ ★★
Ulla Brasch Mogensen
632012 ★★★ ★ ★★
Helen Rodgers
382004 ★★★★ ★★ ★★★
George Howard
602011 ★★★ ★★ ★★
K.S. Wong
331999 ★★★★ ★★ ★★
Yun-Mi Song (a)
402004 ★★★★ ★ ★★★
Yun-Mi Song (b)
412004 ★★★★ ★ ★★
Mohsen Janghorbani
472007 ★★★★ ★★ ★★★
Truong-Minh Pham
482007 ★★★ ★★ ★★
Michiaki Kubo
542008 ★★★ ★★ ★★★
Ying Zhang
562008 ★★★★ ★★ ★★
Ulla Brasch Mogensen
632012 ★★★ ★ ★★
Note [22]: Selection: 1. Representativeness of the exposed cohort. 2. Selection of the non-exposed cohort. 3. Ascertainment of exposure. 4. Demonstration that the outcome of interest was not present at the beginning of the study.
(High quality, >2 stars); Comparability: 1. Comparability of the cohorts on the basis of the design or analysis. (High quality, >1 star); Exposure: 1.
Assessment of the outcome. 2. Was the follow-up long enough for outcomes to occur? 3. Adequacy of the follow-up of the cohorts. (High quality, >2 stars).
Chen et al. BMC Public Health 2014, 14:776 Page 8 of 13
http://www.biomedcentral.com/1471-2458/14/776
Table 4 Egger's test & Sensitivity analysis
Risk factors Egger's test of
Western(t value)
Egger's test of Western(P)
Sensitivity analysis of Western (HR 95% CI)
◎Sensitivity analysis of Western(HR 95% CI)
◇Egger's test of
Asian ( t value) Egger's test of Asian (P)
Sensitivity analysis of Asian (HR 95% CI)
◎Sensitivity analysis of Asian (HR 95% CI)
◇BMI (kg/ m
2)
22.0-24.9 1 N/A 1 1 1 N/A 1 1
18. 5 –21. 9 −1.65 0.240 0.96 (0.93 ~ 0.99)
(1)0.97 (0.86 ~ 1.09)
(1)−9.52 0.000
*0.93 (0.90 ~ 0.97)
(9)0.97 (0.88 ~ 1.08)
(9)≥25.0 −0.48 0.652 1.02 (0.99 ~ 1.05)
(1)1.21 (0.99 ~ 1.48)
(1)3.36 0.012
*1.26 (1.22 ~ 1.31)
(9)1.28 (1.15 ~ 1.43)
(9)SBP ( mm H g)
<120 1 1 1 N/A 1 1
120-139 N/A
▲N/A
▲1.28 (0.96 ~ 1.70)
(2)1.28 (0.95 ~ 1.73)
(2)N/A
▲N/A
▲1.96 (1.42 ~ 2.69)
(10)2.30 (1.03 ~ 5.09)
(10)≥140 N/A
▲N/A
▲2.25 (1.74 ~ 2.92)
(2)2.39 (1.44 ~ 3.97)
(2)N/A
▲N/A
▲4.69 (3.37 ~ 6.52)
(10)6.22 (2.27 ~ 17.08)
(10)Hypertension
No 1 N/A 1 1 1 N/A 1 1
Yes 1.78 0.173 1.65 (1.43 ~ 1.90)
(3)1.79 (1.39 ~ 2.30)
(3)2.01 0.101 2.66 (2.29 ~ 3.10)
(11)2.84 (2.10 ~ 3.82)
(11)Diabetes
No 1 N/A 1 1 1 N/A 1 1
Yes 1.17 0.280 1.72 (1.52 ~ 1.94)
(4)1.85 (1.43 ~ 2.38)
(4)4.50 0.003
*2.19 (2.01 ~ 2.39)
(12)1.95 (1.42 ~ 2.67)
(12)Cardiac causes
#No 1 N/A 1 1 1 N/A 1 1
Yes 6.32 0.000
*1.62 (1.50 ~ 1.75)
(5)1.74 (1.47 ~ 2.04)
(5)N/A
▲N/A
▲1.87 (1.45 ~ 2.42)
(13)1.86 (1.36 ~ 2.55)
(13)Cardiac causes (Atrial fibrillation)
No 1 N/A 1 1 1
▲N/A 1 1
Yes 6.02 0.105 1.59 (1.33 ~ 1.90)
(6)1.59 (1.33 ~ 1.90)
(6)N/A
▲N/A
▲2.30 (1.50 ~ 3.53)
(14)2.30 (1.50 ~ 3.53)
(14)Smoking
No 1 N/A 1 1 1 N/A 1 1
Yes 6.21 0.000
*1.97 (1.80 ~ 2.15)
(7)2.05 (1.68 ~ 2.49)
(7)11.39 0.000
*1.29 (1.12 ~ 1.48)
(15)1.27 (1.04 ~ 1.55)
(15)Smoking (Former) 2.09 0.171 1.20 (1.00 ~ 1.43)
(7)1.22 (0.94 ~ 1.59)
(7)N/A N/A N/A N/A
Smoking (Current) 2.41 0.053 2.22 (1.96 ~ 2.53)
(7)2.27 (1.76 ~ 2.93)
(7)N/A N/A N/A N/A
Smoking ( ≤20 Cigarettes/d) −0.74 0.536 2.31 (1.80 ~ 2.96)
(7)2.31 (1.80 ~ 2.96)
(7)N/A N/A N/A N/A
Smoking (>20 Cigarettes/d) 0.73 0.600 2.99 (2.31 ~ 3.86)
(7)2.97 (2.16 ~ 4.09)
(7)N/A N/A N/A N/A
Alcohol
No 1 N/A 1 1
▲1 N/A 1 1
Yes −1.42 0.16 0.89 (0.76 ~ 1.04)
(8)0.92 (0.74 ~ 1.14)
(8)1.06 0.008
*1.28 (1.07 ~ 1.53)
(16)1.29 (1.07 ~ 1.57)
(16)*P values for publication bias; N/A, no data available;
▲Synthesis of References less than 3; BMI, Body mass index;
#Cardiac causes: Coronary heart disease, Left atrial hypertrophy, Angina, Atrial fibrillation; ◎Fixed effects model; ◇Random effects model; (1)-(16): (Additional files 1, 2, 3, 4, 5, 6, 7, 8, 9, 10, 11, 12, 13, 14, 15, 16).
Chen et al. BMC Public Health 2014, 14 :776 Page 9 of 13 http://ww w.biomedce ntral.com/1 471-2458/14/776
in Western populations: the HR value associated with smoking more than 20 cigarettes per day was much greater than the HR values of other risk factors by point estimation (Figure 2); this result is consistent with the findings of previous studies [86,87]. Therefore, reducing daily cigarette consumption is an effective preventive measure for reducing the incidence of stroke.
The results from the studies of Asian populations indi- cated that long-term alcohol consumption was also a risk factor for stroke, although this factor had no effect on the incidence of stroke in Western populations (Table 3). Prior studies have also produced controversial results with respect to the significance of this factor: certain studies have determined that heavy long-term alcohol consumption is a risk factor for stroke [88], but other studies have reached the opposite conclusion [89]. However, heavy long-term alcohol consumption is a risk factor for many chronic diseases, and therefore, limiting alcohol consumption may play an indirect role in preventing the incidence of stroke.
Limitations
This systematic review and meta-analysis used the Newcastle-Ottawa scale to score all of the included studies. Overall, the quality of the studies on Chinese populations was significantly lower than the quality of the studies on other populations (T-Test: Z = 3.015, P = 0.007).
The primary reason for this finding was that the populations examined in the former studies were mostly large, long-term, community-based cohorts. For example, the studies by the British regional heart study [24] and the PROCAM study [29,30], among others, were based on data from large European cohorts [29,30,32]. By contrast, most of the included Asian studies examined small community-based cohorts or even hospital cases. For
example, the research participants assessed by the cadre's sanitarium of Xi’an, China [37] were recruited from a sanatorium for retired military cadres in Xi'an, China.
Result biases may be relatively low for large community cohorts but higher for smaller samples. In addition, bias may also be related to the dropout rate. For instance, the study in Shanghai, China [53] reported a dropout rate of 3.09%, whereas the CMCS study [44] reported a dropout rate of up to 22.5%. Although this investigation involved the examination of a large number of literature databases, there was less investigation of the unpublished literature and conference-related information, potentially creating publication bias.
Furthermore, only a limited number of studies were included in this investigation; thus, a large amount of data regarding risk factors was missing. In addition, few studies were pooled to obtain certain data points, par- ticularly for Asian populations, and the number of studies finally included in the meta-analysis was very low for individual risk factors (usually in the range of 1 to 10), and this issue might have produced bias in the results. Therefore, these limitations are related to the absence of studies from South Asia and West Asia, and we believe this might be one reason for the publication bias. Consequently, to obtain more reliable data and results, additional large-sample, multi-center, randomized controlled studies and/or long-term cohort studies must be conducted.
Conclusions
This meta-analysis presents the data from large-scale prospective cohort studies to summarize and evaluate the risk factors for stroke in Western and Asian populations.
The results of this investigation are credible, and the
Overall (I-squared = 95.1%, p = 0.000) ID
Diabetes Study
SBP( 120-139 mm Hg)
Cardiac causes #
Alcohol Smoking BMI(≥25.0 kg/m2)
Hypertension SBP(≥140 mm Hg) BMI(18.5-21.9 kg/m2)
1.46 (1.14, 1.87) HR (95% CI)
1.85 (1.43, 2.38) 1.28 (0.96, 1.70)
1.74 (1.47, 2.04)
0.89 (0.76, 1.04) 2.05 (1.68, 2.49) 1.21 (0.99, 1.48)
1.79 (1.39, 2.30) 2.39 (1.44, 3.97) 0.96 (0.93, 0.99)
100.00 Weight
10.99
%
10.67
11.82
11.87 11.55 11.51
11.02 8.13 12.45
1.46 (1.14, 1.87) HR (95% CI)
1.85 (1.43, 2.38) 1.28 (0.96, 1.70)
1.74 (1.47, 2.04)
0.89 (0.76, 1.04) 2.05 (1.68, 2.49) 1.21 (0.99, 1.48)
1.79 (1.39, 2.30) 2.39 (1.44, 3.97) 0.96 (0.93, 0.99)
100.00 Weight
10.99
%
10.67
11.82
11.87 11.55 11.51
11.02 8.13 12.45
1
.5 1 1.5
Overall (I-squared = 90.2%, p = 0.000) BMI(18.5-21.9 kg/m2)
Hypertension BMI(≥25.0 kg/m2)
Alcohol Smoking ID
Diabetes SBP(≥140 mm Hg)
Cardiac causes # SBP( 120-139 mm Hg) Study
1.63 (1.29, 2.06) 0.97 (0.88, 1.08)
2.84 (2.10, 3.82) 1.28 (1.15, 1.46)
1.28 (1.07, 1.53) 1.27 (1.04, 1.55) HR (95% CI)
1.95 (1.42, 2.67) 6.22 (2.27, 17.08)
1.87 (1.45, 2.42) 2.29 (1.04, 5.09)
100.00 14.22
11.78 14.08
13.46 13.20 Weight
11.52 3.90
12.42 5.41
%
1.63 (1.29, 2.06) 0.97 (0.88, 1.08)
2.84 (2.10, 3.82) 1.28 (1.15, 1.46)
1.28 (1.07, 1.53) 1.27 (1.04, 1.55) HR (95% CI)
1.95 (1.42, 2.67) 6.22 (2.27, 17.08)
1.87 (1.45, 2.42) 2.29 (1.04, 5.09)
100.00 14.22
11.78 14.08
13.46 13.20 Weight
11.52 3.90
12.42 5.41
%
1
.5 1 1.5
Western Asian
Figure 2 Risk factors in Western and Asian populations. (**Former, Current, ≤20 Cigarettes/d and >20 Cigarettes/d; #Cardiac causes:
Coronary heart disease, Left Atrial hypertrophy, Angina, Atrial fibrillation; HR Hazard risk; CI, Confidence interval; BMI, Body mass index; SBP, Systolic blood pressure).
Chen et al. BMC Public Health 2014, 14:776 Page 10 of 13
http://www.biomedcentral.com/1471-2458/14/776
pooled results obtained in this review are more reliable than the findings from prior small-scale cohort studies and case–control studies. The analyses conducted in this investigation revealed that Western and Asian populations differ with respect to the factors that affect the incidence of stroke. Therefore, different interventional approaches should be implemented to reduce the risk of stroke among high-risk individuals from different regions and different ethnic groups.
Additional files
Additional file 1: BMI of Western, Body Mass Index (1. 25.0-25.9 Kg/m
2, 2. ≥26.0 Kg/m
2; Left: Fixed effects model, Right: Random effects model).
Additional file 2: SBP of Western, Systolic blood pressure (1. 120 –129 mm Hg, 2. 130–139 mm Hg, 3. 140-149 mm Hg2.
150-159 mm Hg2. ≥160 mm Hg; Left: Fixed effects model, Right:
Random effects model).
Additional file 3: Hypertension of Western (Left: Fixed effects model, Right: Random effects model).
Additional file 4: Diabetes of Western (Left: Fixed effects model, Right: Random effects model).
Additional file 5: Cardiac causes of Western (1. Angina, 2. Coronary Heart Disease, 3. Atrial fibrillation, 4. Left ventricular hypertrophy;
Left: Fixed effects model, Right: Random effects model).
Additional file 6: Cardiac causes -Atrial fibrillation of Western (Left: Fixed effects model, Right: Random effects model).
Additional file 7: Smoking of Western (1. < 20 Cigarettes/d, 2. =20 Cigarettes/d, 3. > 20 Cigarettes/d; Left: Fixed effects model, Right:
Random effects model).
Additional file 8: BMI of Asian, Body Mass Index (1. 25.0-25.9 Kg/m
2, 2. ≥26.0 Kg/m
2; Left: Fixed effects model, Right: Random effects model).
Additional file 9: SBP of Asian, Systolic blood pressure (1. 120 –129 mm Hg, 2. 130–139 mm Hg, 3. 140-149 mm Hg2.
150-159 mm Hg2. ≥160 mm Hg; Left: Fixed effects model, Right:
Random effects model).
Additional file 10: Hypertension of Asian (Left: Fixed effects model, Right: Random effects model).
Additional file 11: Diabetes of Asian (Left: Fixed effects model, Right: Random effects model).
Additional file 12: Cardiac causes of Asian (1. Angina, 2. Coronary Heart Disease, 3. Atrial fibrillation, 4. Left ventricular hypertrophy;
Left: Fixed effects model, Right: Random effects model).
Additional file 13: Cardiac causes -Atrial fibrillation of Asian (Left: Fixed effects model, Right: Random effects model).
Additional file 14: Smoking of Asian (Fixed effects model, Right:
Random effects model).
Additional file 15: Alcohol of Asian (*Ischemic stroke, #Hemorrhagic stroke; Left: Fixed effects model, Right: Random effects model).
Additional file 16: Alcohol of Western (*Ischemic stroke, #Hemorrhagic stroke; Left: Fixed effects model, Right: Random effects model).
Abbreviations
HR: Hazard ratio; CI: Confidence interval; BMI: Body mass index; SBP: Systolic blood pressure; MOOSE: Meta-analysis of observational studies in epidemiology; CBM: Chinese biomedical literature database; CMCI/
CMCC: Chinese medical citation index/chinese medical current contents;
CENTRAL: Cochrane central register of controlled trials; RR: Relative risk;
NOS: Newcastle-ottawa scale; CHD: Coronary heart disease; LVH: Left ventricular hypertrophy.
Competing interests
The authors declare that they have no competing interests.
Authors ’ contributions
XC, LZ and DY conducted the literature search and quality assessment and contributed to the drafting of the manuscript. LL, YZ and YW performed the data extraction and statistical analysis. WR and DM consulted on the statistical analysis. DC, HL and XL critically revised the manuscript drafts.
XAZ and DY conceived and designed the review, assisted with the inclusion/exclusion criteria, acted as independent assessors and critically revised the manuscript drafts. All of the authors contributed to the interpretation of the data and critically revised the manuscript. All of the authors are guarantors for this study and have read and approved the final manuscript.
Acknowledgments
The study was supported by two grants from the Natural Science Foundation of China (No. 81172773 and No. 81202286).
Author details
1