European Review for Medical and Pharmacological Sciences
2021; 25: 1536-1547
D.Y. JEONG
1, J. LEE
2, J.Y. KIM
1, K.H. LEE
3, H. LI
4, J.Y. LEE
5, G.H. JEONG
6,
S. YOON
1, E.L. PARK
7, S.H. HONG
1,8, J.W. KANG
9, T.-J. SONG
10, T. LEYHE
11,
M. EISENHUT
12, A. KRONBICHLER
13, L. SMITH
14, M. SOLMI
15,16, B. STUBBS
17,18,19,
A. KOYANAGI
20,21, L. JACOB
20,22, A. STICKLEY
23, T. THOMPSON
24, E. DRAGIOTI
25,
H. OH
26, A.R. BRUNONI
27, A.F. CARVALHO
28, M.S. KIM
29,30, D.K. YON
31,
S.W. LEE
32, J.M. YANG
33, R.A. GHAYDA
34, J.I. SHIN
3, P. FUSAR-POLI
15,35,361
Yonsei University College of Medicine, Seoul, Republic of Korea
2
Department of Psychiatry, Yonsei University Wonju College of Medicine, Wonju, Republic of Korea
3Department of Pediatrics, Yonsei University College of Medicine, Seoul, Republic of Korea
4
University of Florida College of Medicine, Gainesville, FL, USA
5
Department of Nephrology, Yonsei University Wonju College of Medicine, Wonju, Republic of Korea
6College of Medicine, Gyeongsang National University, Jinju, Republic of Korea
7
Department of Biostatistics, Korea University College of Medicine, Seoul, Republic of Korea
8
Department of Global Health and Population, Harvard T.H. Chan School of Public Health, Boston, MA, USA
9Department of Pediatric, Chungnam National University College of Medicine, Daejon, Republic of Korea
10Department of Neurology, Seoul Hospital Ewha Womans University College of Medicine, Seoul,
Republic of Korea
11
University of Basel, Geriatric Psychiatry, University Department of Geriatric Medicine FELIX
PLATTER, Basel, Switzerland, and Center of Old Age Psychiatry, Psychiatric University Hospital,
Basel, Switzerland
12
Department of Pediatrics, Luton and Dunstable University Hospital NHS Foundation Trust, Luton, UK
13Department of Internal Medicine IV (Nephrology and Hypertension), Medical University
Innsbruck, Innsbruck, Austria
14
The Cambridge Centre for Sport and Exercise Sciences, Anglia Ruskin University, Cambridge, UK
15Department of Neuroscience, Padova Neuroscience Center (PNC), University of Padua, Padua, Italy
16Early Psychosis: Interventions and Clinical-Detection (EPIC) Lab, Department of Psychosis Studies,
Institute of Psychiatry, Psychology and Neuroscience, King’s College London, London, UK
17
Institute of Psychiatry, Psychology and Neuroscience, King’s College London, De Crespigny Park,
London, UK
18
South London and Maudsley NHS Foundation Trust, Denmark Hill, London, UK
19
Faculty of Health, Social Care and Education, Anglia Ruskin University, Chelmsford, UK
20Parc Sanitari Sant Joan de Déu/CIBERSAM, Universitat de Barcelona, Fundació Sant Joan de
Déu, Sant Boi de Llobregat, Barcelona, Spain
21
ICREA, Pg. Lluis Companys 23, Barcelona, Spain
22
Faculty of Medicine, University of Versailles Saint-Quentin-en-Yvelines, Montigny-le-Bretonneux, France
23Stockholm Center for Health and Social Change (SCOHOST), Södertörn University, Huddinge, Sweden
24Department of Psychology, University of Greenwich, London, UK
25
Pain and Rehabilitation Centre, and Department of Medical and Health Sciences, Linköping
University, Linköping, Sweden
26
School of Social Work, University of Southern California, Los Angeles, CA, USA
27
Department of Psychiatry and Psychotherapy, University Hospital, LMU Munich, Munich,
Germany; Service of Interdisciplinary Neuromodulation, Department of Psychiatry, Laboratory of
Neurosciences (LIM-27) and National Institute of Biomarkers in Neuropsychiatry (INBioN),
Institute of Psychiatry, University of Sao Paulo, Sao Paulo, Brazil; Hospital Universitario,
Departamento de Clínica Médica, Faculdade de Medicina da USP, São Paulo, Brazil
Empirical assessment of biases in cerebrospinal
fluid biomarkers of Alzheimer’s disease: an
umbrella review and re-analysis of data from
meta-analyses
Umbrella review of cerebrospinal fluid biomarkers of Alzheimer’s disease
Abstract.
–
OBJECTIVE: Alzheimer’s disease (AD) is a leading cause of years lived with dis-ability in older age, and several cerebrospinal fluid (CSF) markers have been proposed in indi-vidual meta-analyses to be associated with AD but field-wide evaluation and scrutiny of the lit-erature is not available.MATERIALS AND METHODS: We performed an umbrella review for the reported associations be-tween CSF biomarkers and AD. Data from available meta-analyses were reanalyzed using both random and fixed effects models. We also estimated be-tween-study heterogeneity, small-study effects, ex-cess significance, and prediction interval.
RESULTS: A total of 38 meta-analyses on CSF markers from 11 eligible articles were identified and reanalyzed. In 14 (36%) of the meta-analy-ses, the summary estimate and the results of the largest study showed non-concordant results in terms of statistical significance. Large heteroge-neity (I2≥75%) was observed in 73% and
small-study effects under Egger’s test were shown in 28% of CSF biomarkers.
CONCLUSIONS: Our results suggest that there is an excess of statistically significant results and significant biases in the literature of CSF markers for AD. Therefore, the results of CSF bio-markers should be interpreted with caution.
Key Words:
Alzheimer’s disease, CSF biomarkers, Meta-analysis, Umbrella review, Excess significance.
Introduction
Alzheimer’s disease (AD) is known as the
lead-ing cause of dementia, featurlead-ing a gradual cognitive
decline accompanied by functional deterioration or
behavioral changes
1. It has also been one of the most
challenging conditions to address from a medical
and public health perspective
2, due to a high
per-centage of undiagnosed and untreated patients, in
addition to the absence of effective treatments
3.
Though AD can be diagnosed after pathologic
examination, directly sampling brain tissue is not
a routinely available clinical method
4. AD can
al-so be diagnosed according to generally accepted
diagnostic symptomatic criteria; however, some
symptoms are obscure and occasionally overlap
with other neurologic disorders, making accurate
diagnosis challenging
5.
Over the past several decades, in vivo
biomark-ers have received attention for their potential to
demonstrate underlying pathologic
characteris-tics, as well as disease status or progression
6.
Considerable evidence has already shown
that deposition of the aberrantly folded tau and
amyloid beta proteins in neurofibrillary tangles
and amyloid plaques are closely associated with
pathologic changes of the patient’s brain
2. Major
neuropathological findings of AD, amyloid- and
tau-related lesions, and neuronal dysfunction
(in-cluding pathologic synaptic conditions), can be
identified even before the manifestation of
clini-cal signs, with the help of indirect methods such
as the identification of the concentration variance
of either tau or amyloid proteins in cerebrospinal
fluids (CSF)
5,6.
To date, some well-established biomarkers of
AD from CSF include total tau (T-tau),
phosphor-ylated tau (P-tau), and amyloid-β-42 (Aβ42)
7,8.
Multiple individual meta-analyses focusing on
28
Centre for Addiction and Mental Health (CAMH), Toronto, ON, Canada; Department of
Psychiatry, University of Toronto, Toronto, ON, Canada
29
Korea University, College of Medicine, Seoul, Republic of Korea
30
Cheongsan Public Health Center, Ministry of Health and Welfare, Wando, Republic of Korea
31Department of Pediatrics, Seoul National University Hospital, Seoul National University College
of Medicine, Seoul, Republic of Korea
32
Department of Data Science, Sejong University College of Software Convergence, Seoul,
Republic of Korea
33
Department of Ophthalmology, Asan Medical Center, University of Ulsan College of Medicine,
Seoul, Korea
34
Urology Institute, University Hospitals and Case Western Reserve University, Cleveland, OH, USA
35OASIS Service, South London and Maudsley NHS Foundation Trust, London, UK
36
Department of Brain and Behavioural Sciences, University of Pavia, Pavia, Italy
Dong Yeon Jeong, Jinhee Lee, Jong Yeob Kim, Keum Hwa Lee, Han Li, Jun Young Lee
contributed equally
D.Y. Jeong, J. Lee, J.Y. Kim, K.H. Lee, H. Li, et al.
the effectiveness of several biomarkers have
al-ready been published
9-12. Additionally, there have
been several systematic reviews that described
the biases of reported evidence in biomarkers for
other neurologic and mental disorders
13,14.
How-ever, there has been no comprehensive evaluation
of various biases across the reports of studies
of CSF biomarkers for AD. Therefore, we
per-formed an umbrella review and a systematic
re-view of meta-analyses which the highest levels of
evidence
15,16for the reported associations between
CSF biomarkers and AD.
Materials and Methods
Search Strategy
This umbrella review was followed the
Pre-ferred Reporting Items for Systematic Reviews
and Met Analyses (PRISMA) guidelines (
Sup-plementary Table I
). To extract meta-analyses
of AD addressing associations between specific
biomarkers and AD, we searched PubMed records
that were published up to January 15, 2020. Three
of the authors (DYJ, ELP, JL) used the search
terms (Alzheimer* All Fields or dementia* All
Fields or dementing* All Fields) AND (meta All
Fields or level All Fields). Article titles, abstracts,
and full texts were used to screen for eligibility.
We did not have any language restrictions while
selecting the articles. Any discrepancies were
dis-cussed with the fourth investigator (JIS) and
re-solved by consensus of all four authors.
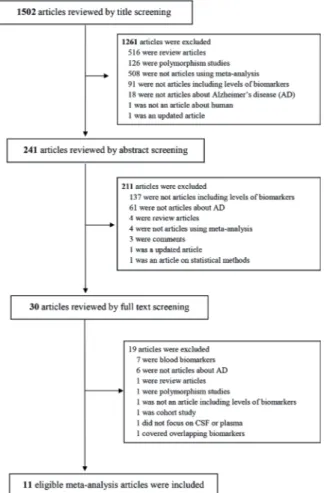
Our initial search yielded about 4,030
arti-cles. Among those, 2,003 articles were left after
we ruled out overlapping studies, review articles,
studies related to polymorphism, and articles not
based on meta-analyses. In addition, articles that
described neurodegenerative disorders other than
AD were excluded. Also, we excluded studies that
examined genetic factors or peripheral biomarker
levels, or studies that did not focus on CSF. We
ul-timately identified 11 eligible articles that satisfied
the conditions for this review (Figure 1).
Data Extraction
Three investigators (DYJ, ELP, JL) recorded
the first author, journal title, and publication year
from individual meta-analyses of eligible articles.
Additionally, numbers of patients, controls, and
studies were also recorded. We extracted the
ef-fect sizes with corresponding confidence intervals
(CIs) and metric types. We tried to adopt either the
effect size estimates or raw data, such as the mean,
standard deviation (SD), median/interquartile, or
median/range of original studies, if such factors
were specified in the articles. However, if there
were no raw data, we extracted the data from the
individual original studies. If the data were
rep-resented as median/interquartile range, the mean
and standard deviation were estimated by the
following formula: (1) mean = (q1+median +q3)/3
and (2) SD = (q3-q1)/1.35, where q1 and q3 are the
25th and 75th percentiles
17. In addition, median/
range may be approximately converted to mean ±
SD according to the following formula: (1) mean
= (a+2*median+b)/4 and (2) SD2 = {(a-2*median
+b)2/4+(b-a)2}/12, where a and b are the minimum
and maximum values
18.
Statistical Analysis
For each meta-analysis, the summary estimate
and its 95% CI with both random and fixed
mod-els
19,20were calculated by the same metric used by
the author, as well as standard mean difference
(SMD), and weighted mean difference (WMD).
Umbrella review of cerebrospinal fluid biomarkers of Alzheimer’s disease
Random effects model was favored in the presence
of within-study or between-study moderators, as
it presumes diverse underlying uncertainties
com-pared to fixed effects model which assumes that
all component studies are estimated by the same
effect size
21. We additionally calculated Hedge’s g
by converting effect sizes from SMD to identify
whether there were significant differences in
sta-tistical outcomes between those methods.
The heterogeneity across studies was estimated
by the I
2index, which evaluates the impact of
in-consistency
22. It is the ratio of between-study
vari-ance ranges to the sum of between-study and
with-in-study variances
23. It ranges from 0% to 100%;
and <50%, 50~75%, and >= 75% respectively
demonstrate small, moderate, and large
hetero-geneity
22. Publication bias was determined by the
Egger’s test for asymmetry
24. It is used to confirm
the presence of small-study effects, which account
for the tendency of small-sized studies to have
larger effect sizes than those of larger studies
25.
Excess significance (ES) test was performed to
verify an excess number of positive studies
com-pared to the expected number by using a χ
2test
26-28.
A = (O – E) 2/E + (O – E) 2/(n – E)
The observed number of positive studies is
de-noted as O and n refers to the total number of
stud-ies included in each meta-analysis. Expected
num-ber of positive studies E was obtained by the sum
of the power for individual component study
29.
The power of each study was estimated in terms
of a non-central t distribution
30, using G*Power
for Windows, version 3.1.9.2. We assumed that
the power of each study could be replaced by the
power of the largest study (the study with smallest
variance)
29. ES was claimed when p-value was less
than 0.1
26with the observed number of statistically
significant studies larger than the expected
num-ber of statistically significant studies. 95%
predic-tion interval (PI) was also calculated, which could
be used to describe the degree of between-study
heterogeneity in addition to predicting the
un-certainty of the effect that may arise in a future
study
31-33. We also examined whether the largest
study of each meta-analysis had a concordant
result in terms of statistical significance with the
summary results of the meta-analysis.
To compare the variables between groups as
with ES and without ES, groups as with and
with-out having concordance with the largest study
from the 38 meta-analyses, two-tailed independent
t test and χ
2tests were used.
Statistical analysis was performed using
Com-prehensive Meta-Analysis software for Windows
8. Statistical power was estimated by G*Power
for Windows, Version 3.1.9.2. The SPSS statistical
package (version 23.0, IBM Corp., Armonk, NY,
USA) was used to perform independent t test and
χ
2tests.
Results
We identified 11 eligible articles
correspond-ing to 38 meta-analyses of CSF biomarkers used
to detect AD, which we reanalyzed. Overall, we
included 624 studies with 66,198 cases assessing
CSF biomarkers in AD. The average number of
individual studies in each meta-analysis was 16,
and the average sample size was 1,742. Of the
38 eligible CSF-related meta-analyses, 17 (44%)
were based on more than 500 cases, and 9 (23%)
were based on more than 1,000 cases.
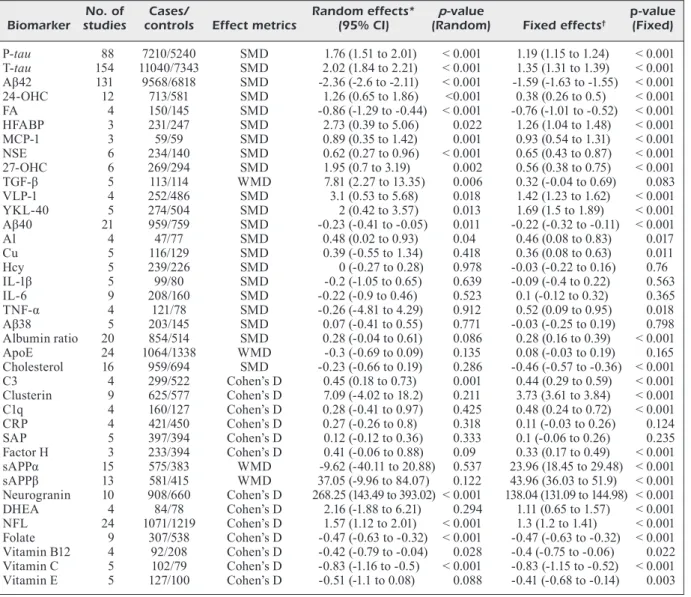
Overall, 19 (51%) studies were statistically
significant (p<0.05) under random effects model,
and 10 (26%) were significant at a p-value less
than 0.001 (Table I), which were meta-analyses
of FA, T-tau, P-tau, A β42, NSE, 24-OHC,
neuro-granin, NFL, folate, and vitamin C. Compared to
random effects model, meta-analyses under fixed
effects model yielded less conservative results, as
31 (81%) meta-analyses were statistically
signif-icant with p-values less than 0.05 and 24 (63%)
had p-value less than 0.001. There were 22 (57%)
studies with statistically significant (p<0.05)
un-der largest study effects, and 16 (42%) were
sig-nificant at a p-value less than 0.001.
Five (13%) meta-analyses had small
hetero-geneity (I
2<50%), which were meta-analyses of
Al, MCP-1, SAP, folate, vitamin B12, vitamin C,
and vitamin E, while 5 (13%) meta-analyses had
moderate heterogeneity (50% ≤I
2<75%), and 28
(73%) had large heterogeneity (I
2≥75%). Two
me-ta-analysis, studying folate and vitamin C, had a
95% PI excluding null. 11 (28%) of the
meta-anal-yses were found to have small-study effects
un-der Egger’s test. Additionally, 13 meta-analyses
(34%) were confirmed to have ES. In 14 (36%)
of the meta-analyses, the summary estimate and
the results of the largest study showed
non-con-cordant results in terms of statistical significance
(Table II).
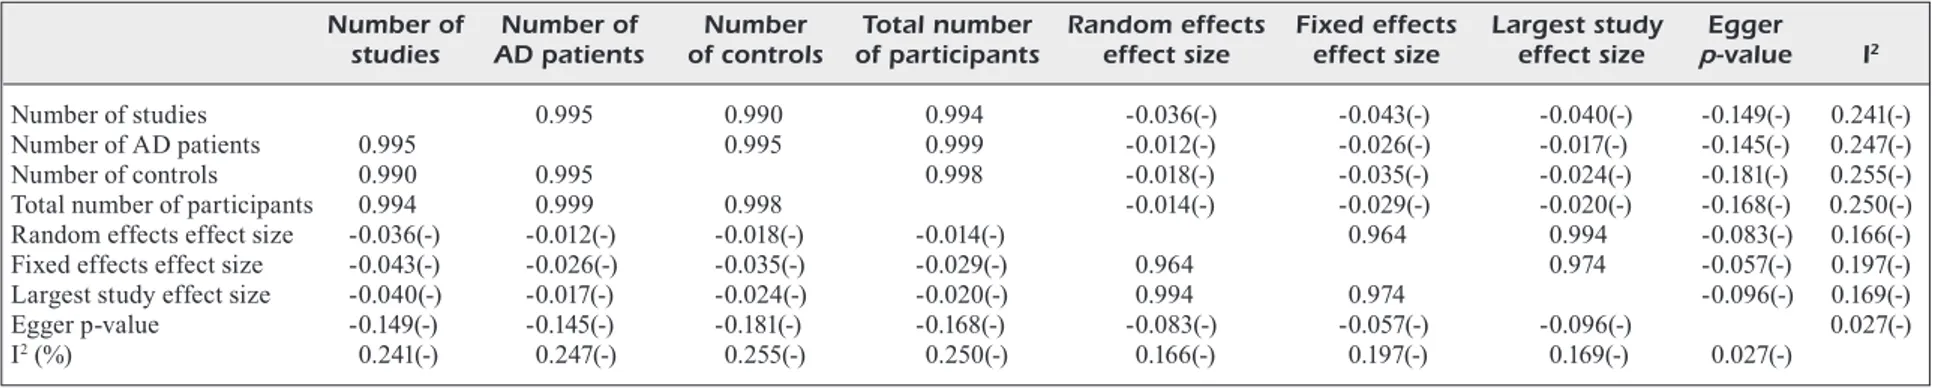
Correlations among variables from the 38
me-ta-analyses between CSF biomarkers, patients
with AD and controls are presented in Table III.
The fixed effects size and largest study effects
D.Y. Jeong, J. Lee, J.Y. Kim, K.H. Lee, H. Li, et al.
size were correlated with random effects size
significantly. The associations between largest
study effect size and fixed effect size were
al-so significant. Egger p-value and I
2(%) were
not significantly correlated with other variables.
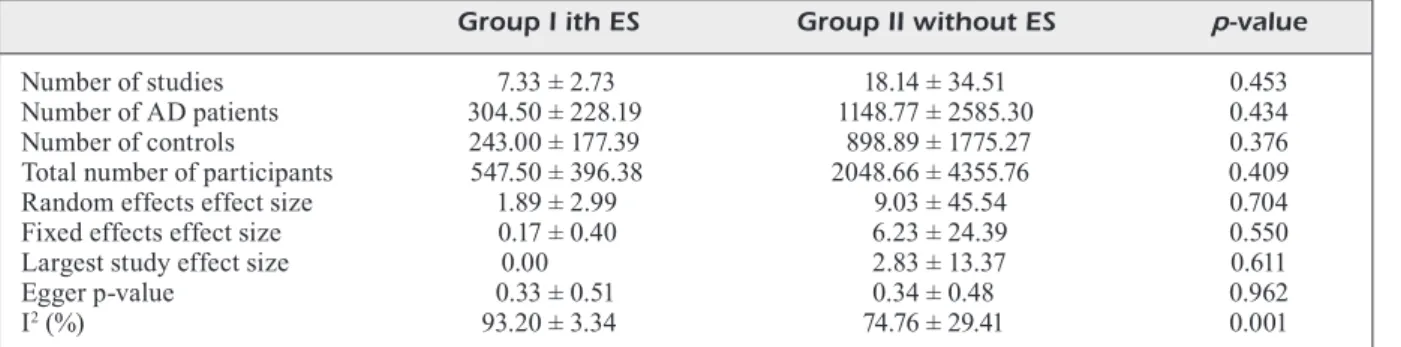
When comparing the variables between the
me-ta-analysis group with ES and the
meta-anal-yses group without ES, the number of AD
patients, only I
2(%) was significantly higher in
the meta-analysis group with ES (Table IV).
Table I. Characteristics and quantitative reanalysis of the 38 meta-analyses concerning the CSF biomarkers between AD and controls.
No. of Cases/ Random effects* p-value p-value
Biomarker studies controls Effect metrics (95% CI) (Random) Fixed effects† (Fixed)
P-tau 88 7210/5240 SMD 1.76 (1.51 to 2.01) < 0.001 1.19 (1.15 to 1.24) < 0.001 T-tau 154 11040/7343 SMD 2.02 (1.84 to 2.21) < 0.001 1.35 (1.31 to 1.39) < 0.001 Aβ42 131 9568/6818 SMD -2.36 (-2.6 to -2.11) < 0.001 -1.59 (-1.63 to -1.55) < 0.001 24-OHC 12 713/581 SMD 1.26 (0.65 to 1.86) <0.001 0.38 (0.26 to 0.5) < 0.001 FA 4 150/145 SMD -0.86 (-1.29 to -0.44) < 0.001 -0.76 (-1.01 to -0.52) < 0.001 HFABP 3 231/247 SMD 2.73 (0.39 to 5.06) 0.022 1.26 (1.04 to 1.48) < 0.001 MCP-1 3 59/59 SMD 0.89 (0.35 to 1.42) 0.001 0.93 (0.54 to 1.31) < 0.001 NSE 6 234/140 SMD 0.62 (0.27 to 0.96) < 0.001 0.65 (0.43 to 0.87) < 0.001 27-OHC 6 269/294 SMD 1.95 (0.7 to 3.19) 0.002 0.56 (0.38 to 0.75) < 0.001 TGF-β 5 113/114 WMD 7.81 (2.27 to 13.35) 0.006 0.32 (-0.04 to 0.69) 0.083 VLP-1 4 252/486 SMD 3.1 (0.53 to 5.68) 0.018 1.42 (1.23 to 1.62) < 0.001 YKL-40 5 274/504 SMD 2 (0.42 to 3.57) 0.013 1.69 (1.5 to 1.89) < 0.001 Aβ40 21 959/759 SMD -0.23 (-0.41 to -0.05) 0.011 -0.22 (-0.32 to -0.11) < 0.001 Al 4 47/77 SMD 0.48 (0.02 to 0.93) 0.04 0.46 (0.08 to 0.83) 0.017 Cu 5 116/129 SMD 0.39 (-0.55 to 1.34) 0.418 0.36 (0.08 to 0.63) 0.011 Hcy 5 239/226 SMD 0 (-0.27 to 0.28) 0.978 -0.03 (-0.22 to 0.16) 0.76 IL-1β 5 99/80 SMD -0.2 (-1.05 to 0.65) 0.639 -0.09 (-0.4 to 0.22) 0.563 IL-6 9 208/160 SMD -0.22 (-0.9 to 0.46) 0.523 0.1 (-0.12 to 0.32) 0.365 TNF-α 4 121/78 SMD -0.26 (-4.81 to 4.29) 0.912 0.52 (0.09 to 0.95) 0.018 Aβ38 5 203/145 SMD 0.07 (-0.41 to 0.55) 0.771 -0.03 (-0.25 to 0.19) 0.798 Albumin ratio 20 854/514 SMD 0.28 (-0.04 to 0.61) 0.086 0.28 (0.16 to 0.39) < 0.001 ApoE 24 1064/1338 WMD -0.3 (-0.69 to 0.09) 0.135 0.08 (-0.03 to 0.19) 0.165 Cholesterol 16 959/694 SMD -0.23 (-0.66 to 0.19) 0.286 -0.46 (-0.57 to -0.36) < 0.001 C3 4 299/522 Cohen’s D 0.45 (0.18 to 0.73) 0.001 0.44 (0.29 to 0.59) < 0.001 Clusterin 9 625/577 Cohen’s D 7.09 (-4.02 to 18.2) 0.211 3.73 (3.61 to 3.84) < 0.001 C1q 4 160/127 Cohen’s D 0.28 (-0.41 to 0.97) 0.425 0.48 (0.24 to 0.72) < 0.001 CRP 4 421/450 Cohen’s D 0.27 (-0.26 to 0.8) 0.318 0.11 (-0.03 to 0.26) 0.124 SAP 5 397/394 Cohen’s D 0.12 (-0.12 to 0.36) 0.333 0.1 (-0.06 to 0.26) 0.235 Factor H 3 233/394 Cohen’s D 0.41 (-0.06 to 0.88) 0.09 0.33 (0.17 to 0.49) < 0.001 sAPPα 15 575/383 WMD -9.62 (-40.11 to 20.88) 0.537 23.96 (18.45 to 29.48) < 0.001 sAPPβ 13 581/415 WMD 37.05 (-9.96 to 84.07) 0.122 43.96 (36.03 to 51.9) < 0.001 Neurogranin 10 908/660 Cohen’s D 268.25 (143.49 to 393.02) < 0.001 138.04 (131.09 to 144.98) < 0.001 DHEA 4 84/78 Cohen’s D 2.16 (-1.88 to 6.21) 0.294 1.11 (0.65 to 1.57) < 0.001 NFL 24 1071/1219 Cohen’s D 1.57 (1.12 to 2.01) < 0.001 1.3 (1.2 to 1.41) < 0.001 Folate 9 307/538 Cohen’s D -0.47 (-0.63 to -0.32) < 0.001 -0.47 (-0.63 to -0.32) < 0.001 Vitamin B12 4 92/208 Cohen’s D -0.42 (-0.79 to -0.04) 0.028 -0.4 (-0.75 to -0.06) 0.022 Vitamin C 5 102/79 Cohen’s D -0.83 (-1.16 to -0.5) < 0.001 -0.83 (-1.15 to -0.52) < 0.001 Vitamin E 5 127/100 Cohen’s D -0.51 (-1.1 to 0.08) 0.088 -0.41 (-0.68 to -0.14) 0.003 Abbreviations: AD, Alzheimer’s disease; CSF, cerebrospinal fluid; Random effects, summary effect size (95% CI) using random effects model; Fixed effects, summary effect size (95% CI) using fixed effects model; Largest effect, effect size (95% CI) of the largest study in the meta-analysis; Egger, p-value from Egger’s regression asymmetry test for evaluation of publication bias; P, p-value; SMD, standard mean difference; WMD, weighted mean difference; PI, prediction interval; ES, excess significance; RoM, ratio of the mean; IL, interleukin; TGF, tumor growth factor; TNF, tumor necrosis factor; Al, aluminum; Hcy, homocysteine; FA, folic acid, Apo, apolipoprotein; T-tau, total tau protein; P-tau; phosphorylated tau protein; Aβ, amyloid beta, NSE, neuron specific enolase; VLP, visinin like protein; HFABP, heart-type fatty acid binding protein; YKL-40, chitinase-3-like protein 1; MCP, monocyte chemoattractant protein; OHC, hydroxycholesterol; C3, third component of complement; CRP, C-reactive protein; SAP, serum amyloid P component; FH, factor H; sAPPα, soluble amyloid precursor protein procurer α; sAPPβ, soluble amyloid precursor protein procurer β, DHEA, dehydroepiandrosterone; NFL, neurofilament light. *Summary random effects effect size (95% CI) of each meta-analysis.†Summary fixed effects effect size (95% CI) of each meta-analysis. ‡Effect size (95% CI) of the largest study in each meta-analysis. §p-value from the Egger regression asymmetry test for evaluation of publication bias.||I2 metric of inconsistency (95% confidence intervals of I2) and p-value of the Cochran Q test for evaluation of heterogeneity. ¶Concordance between largest study estimate and random effects summary estimate.
Umbrella review of cerebrospinal fluid biomarkers of Alzheimer’s disease
When comparing the variables between the
me-ta-analysis group with concordance with the
largest study and the meta-analyses group with
discordance with the largest study, there was no
significant difference between groups (Table V).
Causes for the statistical changes after
reanaly-sis are shown in Table VI.
Discussion
There is a pressing need to identify
poten-tial biomarkers for AD, and to the best of our
knowledge, the current paper is the first
sys-tematic review to comprehensively evaluate the
entire field of CSF biomarkers and AD.
Specif-ically, in this review, we reanalyzed the current
meta-analyses on associations of CSF
biomark-er levels between AD patients and healthy
con-trols. We systemically appraised 38 biomarkers
from CSF. To the best of our knowledge, this
was the first attempt to synthesize evidence on
CSF biomarkers of AD while evaluating biases
within the literature. Several similar efforts
have been reported in the field of
neuropsy-chiatric disorders
34,35, which found substantial
biases across multiple meta-analyses utilizing
diverse statistical indices to interpret existing
meta-analyses
36.
More than half of the eligible meta-analyses
had reported statistically significant
associa-tion. Twenty (53%) were significant
accord-ing to meta-analyses under a random effects
model. However, for many of them, we found
evidence of bias after reanalyzing and
calcu-lating additional statistical indices. Most of
the associations had PIs including the null and
were not aimed at a sufficiently large number of
cases (over 1,000).
Most of the meta-analyses had substantial
heterogeneity, and the meta-analyses with low
heterogeneity may have included a small
num-ber of studies or cases, and therefore should be
interpreted with caution. Heterogeneity could
be explained by the differences in individual
characteristics of subjects within a group, such
as age, gender, ethnicity, or severity of the
dis-ease. Still, a consensus on the diagnostic
cri-teria of dementia remains to be unestablished,
which could contribute to the heterogeneity
34.
Other contributing factors could be the
dif-ference in methodology of the primary
stud-ies, such as sample preparation and detection
methods.
Only two biomarkers, FA and vitamin C, was
supported by a meta-analysis in which PI
ex-cluded the null. It was estimated to have small
heterogeneity. Conversely, most significant
re-sults, at a p-value less than 0.05 using random
effects model, had a PI including the null.
They also tended to have relatively substantial
heterogeneity, which was to be expected given
that the PI was used to describe between-study
heterogeneity. A PI including the null
sug-gests a possible existence of uncertainty, which
might be due to the confounding factors cited
above as well as a number of unknown sources
of biases.
ES was introduced to determine the existence
of excessively observed significant results. One
consequence of selective analysis reporting is
ES
27. For comparison with ES, the p-value for
Egger’s test, which is a traditional indicator of
publication bias
37, was calculated to estimate
small-study effects. In our analysis, the
propor-tion of biomarkers with ES was about 34% and
the proportion of biomarkers with small-study
effects was about 28%. Moreover, the number
of biomarkers with ES was larger than the
num-ber of biomarkers with small-study effects.
Effect sizes under random and fixed models
were highly correlated. It was assumed that
all meta-analyses would have a common true
effect size in a fixed model, while a random
model would have variable effect sizes across
studies
38. Although they were significantly
cor-related, most of the overall results under
ran-dom models were conservative with a wider
CI compared to those under fixed models, as
we expected. Since the sources of variation
in a random model were relevant to the
be-tween-study heterogeneity as well as the
with-in-study error, a random effects model might
generally be more suitable in cases where
individual studies were collected from the
pub-lished literature
38.
Commonly accepted CSF biomarkers for
di-agnosing AD are T-tau, P-tau, and Aβ42
39.
They have been reported to have relatively
favorable diagnostic accuracy when used for
verifying the prodromal phase of AD
40,41. In
our analysis, they were substantially significant
at p-value less than 0.001 under random effects
model; however, the meta-analyses had a high
level of heterogeneity, small-study effects, and
ES. Heterogeneity could be considered large,
though a significant number of studies
account-ed for the majority. Meanwhile a large number
1542
Continued Table II. Characteristics and bias test of the 38 meta-analyses concerning the CSF biomarkers between AD and controls.
No. of Largest study effects‡ p-value I2 (%)
Biomarker studies Cases/controls (95% CI) (Largest) I2 (%) (p)|| PI Egger§ (p) ES Concordance¶
P-tau 88 7210/5240 0.64 (0.5 to 0.78) < 0.001 97 < 0.001 -0.57 to 4.09 < 0.001 No Cor
T-tau 154 11040/7343 1.13 (0.99 to 1.27) < 0.001 96 < 0.001 -0.19 to 4.23 < 0.001 No Cor
Aβ42 131 9568/6818 -1.53 (-1.68 to -1.38) < 0.001 97 < 0.001 -5.12 to 0.41 < 0.001 No Cor
24-OHC 12 713/581 -0.03 (-0.3 to 0.24) 0.836 96 < 0.001 -1.11 to 3.62 0.002 Yes Dis
FA 4 150/145 -0.57 (-0.96 to -0.18) 0.004 58 0.065 -2.52 to 0.8 0.009 No Cor
HFABP 3 231/247 0.75 (0.42 to 1.07) < 0.001 99 < 0.001 -27.37 to 32.82 0.013 No Cor
MCP-1 3 59/59 1.08 (0.49 to 1.68) < 0.001 47 0.15 -4.5 to 6.28 0.258 No Cor
NSE 6 234/140 0.79 (0.35 to 1.23) < 0.001 58 0.036 -0.41 to 1.65 0.45 No Cor
27-OHC 6 269/294 -0.12 (-0.4 to 0.16) 0.408 97 < 0.001 -2.6 to 6.5 0.017 Yes Dis
TGF-β 5 113/114 0.2 (-0.17 to 0.57) 0.293 93 < 0.001 -11.11 to 26.72 0.089 Yes Dis VLP-1 4 252/486 0.79 (0.55 to 1.04) < 0.001 99 < 0.001 -9.47 to 15.68 0.241 No Cor YKL-40 5 274/504 0.51 (0.19 to 0.83) 0.002 98 < 0.001 -4.23 to 8.22 0.536 No Cor Aβ40 21 959/759 -0.26 (-0.6 to 0.09) 0.147 64 < 0.001 -0.95 to 0.48 0.48 No Dis Al 4 47/77 0.28 (-0.25 to 0.81) 0.305 25 0.26 -0.94 to 1.89 0.844 No Dis Cu 5 116/129 -0.24 (-0.78 to 0.3) 0.386 91 < 0.001 -3.21 to 3.99 0.832 Yes Cor Hcy 5 239/226 -0.01 (-0.34 to 0.32) 0.958 48 0.1 -0.82 to 0.82 0.213 No Cor IL-1β 5 99/80 0.64 (0.11 to 1.17) 0.017 86 < 0.001 -3.36 to 2.95 0.5 No Dis
IL-6 9 208/160 0.25 (-0.22 to 0.72) 0.299 89 < 0.001 -2.61 to 2.17 0.103 Yes Cor
TNF-α 4 121/78 0.36 (-0.17 to 0.88) 0.182 99 < 0.001 -22.33 to 21.82 0.97 No Cor
Aβ38 5 203/145 -0.54 (-0.93 to -0.16) 0.005 77 0.002 -1.63 to 1.77 0.135 No Dis
Albumin ratio 20 854/514 0.41 (0.08 to 0.74) 0.016 86 < 0.001 -1.18 to 1.75 0.939 No Dis
ApoE 24 1064/1338 1.3 (1.02 to 1.58) < 0.001 90 < 0.001 -2.13 to 1.53 0.053 No Dis Cholesterol 16 959/694 -0.62 (-0.89 to -0.35) < 0.001 93 < 0.001 -2.07 to 1.6 0.108 No Dis C3 4 299/522 0.43 (0.18 to 0.68) < 0.001 68 0.025 -0.7 to 1.6 0.772 No Cor Clusterin 9 625/577 0.58 (0.42 to 0.74) < 0.001 100 < 0.001 -35.29 to 49.48 0.512 No Dis C1q 4 160/127 0.61 (0.32 to 0.9) < 0.001 80 0.002 -2.77 to 3.33 0.534 No Dis CRP 4 421/450 -0.07 (-0.31 to 0.17) 0.579 92 < 0.001 -2.23 to 2.77 0.096 No Cor SAP 5 397/394 0.1 (-0.14 to 0.34) 0.422 44 0.129 -0.56 to 0.79 0.733 No Cor
Abbreviations: AD, Alzheimer’s disease; CSF, cerebrospinal fluid; Random effects, summary effect size (95% CI) using random effects model; Fixed effects, summary effect size (95% CI) using fixed effects model; Largest effect, effect size (95% CI) of the largest study in the meta-analysis; Egger, p-value from Egger’s regression asymmetry test for evaluation of publication bias; P, p-value; SMD, standard mean difference; WMD, weighted mean difference; PI, prediction interval; ES, excess significance; RoM, ratio of the mean; IL, interleukin; TGF, tumor growth factor; TNF, tumor necrosis factor; Al, aluminum; Hcy, homocysteine; FA, folic acid, Apo, apolipoprotein; T-tau, total tau protein; P-tau; phosphorylated tau protein; Aβ, amyloid beta, NSE, neuron specific enolase; VLP, visinin like protein; HFABP, heart-type fatty acid binding protein; YKL-40, chitinase-3-like protein 1; MCP, monocyte chemoattractant protein; OHC, hydroxycholesterol; C3, third component of complement; CRP, C-reactive protein; SAP, serum amyloid P component; FH, factor H; sAPPα, soluble amyloid precursor protein procurer α; sAPPβ, soluble amyloid precursor protein procurer β, DHEA, dehydroepiandrosterone; NFL, neurofilament light. *Summary random effects effect size (95% CI) of each meta-analysis. †Summary fixed effects effect size (95% CI) of each meta-analysis. ‡Effect size (95% CI) of the largest study in each meta-analysis. §p-value from the Egger regression asymmetry test for evaluation of publication bias. ||I2 metric of inconsistency (95% confidence intervals of I2) and p-value of the Cochran Q test for evaluation of heterogeneity. ¶Concordance between largest study estimate and random effects summary estimate.
Table II (Continued). Characteristics and bias test of the 38 meta-analyses concerning the CSF biomarkers between AD and controls.
No. of Largest study effects‡ p-value I2 (%)
Biomarker studies Cases/controls (95% CI) (Largest) I2 (%) (p)|| PI Egger§ (p) ES Concordance¶
Factor H 3 233/394 0.1 (-0.14 to 0.34) 0.422 88 < 0.001 -5.41 to 6.22 0.197 No Cor sAPPα 15 575/383 4.18 (-4.15 to 12.51) 0.33 93 < 0.001 -116.08 to 96.85 0.198 No Cor sAPPβ 13 581/415 9.25 (-4.79 to 23.3) 0.198 96 < 0.001 -139.14 to 213.25 0.964 No Cor Neurogranin 10 908/660 79.25 (70.06 to 88.44) < 0.001 100 < 0.001 -209.76 to 746.27 0.217 No Cor DHEA 4 84/78 1.19 (0.51 to 1.87) < 0.001 99 < 0.001 -17.53 to 21.86 0.538 No Dis NFL 24 1071/1219 0.99 (0.7 to 1.28) < 0.001 94 < 0.001 -0.59 to 3.72 0.001 No Cor Folate 9 307/538 -0.3 (-0.64 to 0.04) 0.083 0 0.475 -0.66 to -0.29 0.358 No Dis Vitamin B12 4 92/208 -0.32 (-0.86 to 0.22) 0.248 11 0.339 -1.4 to 0.57 0.194 No Dis Vitamin C 5 102/79 -1.19 (-1.8 to -0.57) <0.001 9 0.354 -1.48 to -0.19 0.547 No Cor Vitamin E 5 127/100 -0.51 (-0.96 to -0.07) 0.024 76 0.002 -2.57 to 1.55 0.431 No Dis
AD, Alzheimer’s disease; (-): negative correlation coefficient.
Table III. Correlations among variables from the 38 meta-analyses concerning the CSF biomarkers between AD and controls.
Number of Number of Number Total number Random effects Fixed effects Largest study Egger studies AD patients of controls of participants effect size effect size effect size p-value I2
Number of studies 0.995 0.990 0.994 -0.036(-) -0.043(-) -0.040(-) -0.149(-) 0.241(-)
Number of AD patients 0.995 0.995 0.999 -0.012(-) -0.026(-) -0.017(-) -0.145(-) 0.247(-)
Number of controls 0.990 0.995 0.998 -0.018(-) -0.035(-) -0.024(-) -0.181(-) 0.255(-)
Total number of participants 0.994 0.999 0.998 -0.014(-) -0.029(-) -0.020(-) -0.168(-) 0.250(-)
Random effects effect size -0.036(-) -0.012(-) -0.018(-) -0.014(-) 0.964 0.994 -0.083(-) 0.166(-)
Fixed effects effect size -0.043(-) -0.026(-) -0.035(-) -0.029(-) 0.964 0.974 -0.057(-) 0.197(-)
Largest study effect size -0.040(-) -0.017(-) -0.024(-) -0.020(-) 0.994 0.974 -0.096(-) 0.169(-)
Egger p-value -0.149(-) -0.145(-) -0.181(-) -0.168(-) -0.083(-) -0.057(-) -0.096(-) 0.027(-)
D.Y. Jeong, J. Lee, J.Y. Kim, K.H. Lee, H. Li, et al.
of estimated effects within the meta-analysis
can make in the same direction, differently
as-sessed magnitude of each effect may generate
the heterogeneity.
Effect sizes of the largest studies were
sig-nificantly correlated with both random effect
sizes and fixed effect sizes in the analysis.
However, no significant correlation was found
between largest study effect size and egger
p-value or I
2(%). If true effect sizes were
as-sumed to be equivalent to those of the largest
studies, it could be asserted that random effect
models generated more plausible results in this
review, where between-study variances were
significant. Furthermore, the analysis showed
no significant difference of variables between
meta-analysis group with ES and
meta-anal-ysis group without ES, except I
2(%). In
ad-dition, there was no significant difference in
most variables between meta-analysis group
with concordance with the largest study and
meta-analysis group without concordance to
Table IV. Comparison of variables between groups with or without ES from the 38 meta-analyses concerning the CSF biomarkers between AD and controls.
Group I ith ES Group II without ES p-value Number of studies 7.33 ± 2.73 18.14 ± 34.51 0.453 Number of AD patients 304.50 ± 228.19 1148.77 ± 2585.30 0.434 Number of controls 243.00 ± 177.39 898.89 ± 1775.27 0.376 Total number of participants 547.50 ± 396.38 2048.66 ± 4355.76 0.409 Random effects effect size 1.89 ± 2.99 9.03 ± 45.54 0.704 Fixed effects effect size 0.17 ± 0.40 6.23 ± 24.39 0.550 Largest study effect size 0.00 2.83 ± 13.37 0.611
Egger p-value 0.33 ± 0.51 0.34 ± 0.48 0.962
I2 (%) 93.20 ± 3.34 74.76 ± 29.41 0.001
ES, excess significance; CSF, cerebrospinal fluid; AD, Alzheimer’s disease.
Table V. Comparison of variables between groups with or without concordance with the largest study from the 38 meta-analyses concerning the CSF biomarkers between AD and controls.
Group I concordant Group II discordant with the without the
largest study largest study p-value Number of studies 21.58 ± 41.15 9.47 ± 6.70 0.169 Number of AD patients 1453.83 ± 3081.63 420.12 ± 362.90 0.117 Number of controls 1105.25 ± 2109.69 378.12 ± 343.82 0.110 Total number of participants 2559.08 ± 5187.69 798.24 ± 687.54 0.113 Random effects effect size 12.83 ± 54.92 1.12 ± 2.52 0.387 Fixed effects effect size 8.88 ± 29.25 0.35 ± 0.99 0.167 Largest study effect size 4.04 ± 16.09 0.12 ± 0.69 0.323
Egger p-value 0.38 ± 0.49 0.29 ± 0.47 0.587
I2 (%) 78.00 ± 25.21 70.24 ± 33.67 0.403
CSF, cerebrospinal fluid; AD, Alzheimer’s disease; Genetic comparisons additionally extracted from GWAS catalog were also re-analyzed (Table III)27-31. All 18 of the re-analyzed genetic comparisons from four articles had a p-value < 0·05. Among the 18 noteworthy comparisons, two genotype comparisons extracted from GWAS catalog were reported to be significant with a p-value < 5×10⁻⁸. Out of two genotype comparisons, only one (50%) was verified to be noteworthy (<0·2) using FPRP estimation, at a prior probability of 10-3 with a statistical power to detect an OR 1.2. In addition, two (100%) and one (50%) showed noteworthiness at prior probability of 10-3 and 10-6 with a statistical power to detect an OR 1·5. Under BFDP estimation, two (100%) and one (50%) were assessed to be noteworthy at prior probability of 10-3 and 10-6. On the other hand, all 16 of the re-analyzed genetic comparisons extracted from GWAS catalog had a borderline statistical significance (p-value between 0·05 and 5×10⁻⁸). Under RPRP estimation, six (37·5%) and three (18·7%) were assessed to be noteworthy at prior probability of 10-3 and 10-6 with a statistical power to detect an OR of 1·2. Moreover, 14 (87·5%) were identified as noteworthy at a prior probability of 10-3 with a statistical power to detect an OR of 1·5. In terms of BFDP, 15 (93·7%) and one (6·2%) had noteworthy findings (<0·8) at a prior probability of 10-3 and 10-6. Consequently, 14 (87·5%) SNPs were found noteworthy using FPRP and BFDP.
Umbrella review of cerebrospinal fluid biomarkers of Alzheimer’s disease
the largest study. Our results showed the
het-erogeneity in the meta-analysis of biomarkers
of Alzheimer’s disease might be heavily due
to both of the magnitude of the estimates and
a direction of the estimates for the biomarkers.
It is necessary to derive the result of
umbrel-la review considering variance and to avoid
checking the level of study without sufficient
consideration of these characteristics of
hetero-geneity and biases in meta-analysis.
Our review has several limitations. First,
some meta-analyses could not be reanalyzed
due to insufficient raw data. Also, five
stud-ies were excluded from ES analysis, due to
unavailable raw data. Second, some of the
meta-analyses were reanalyzed under different
metrics, which may have produced
discrep-ancies in the summary results. Nevertheless,
we attempted to reanalyze the meta-analyses
regarding the associations between CSF
bio-markers and AD by using additional statistical
indices to investigate their statistical validity.
Although considerable portion of the existing
meta-analyses have reported on the statistical
significance of associations, we recommend
in-terpreting those results with caution, especially
in cases with a high level of heterogeneity.
Currently, there is no existing single significant
method that can demonstrate the validity of the
associations. However, we think using these
bias tests can guide the interpretation of the
results from meta-analyses.
Conclusions
We evaluated the meta-analyses available using
CSF biomarkers in diagnosing Alzheimer’s
Dis-ease. Our study suggests that significant biases,
coupled with substantial heterogeneity between
me-ta-analyses, necessitate that meta-analyses in
diag-nostic CSF biomarkers be interpreted with caution.
Conflict of Interest
Brendon Stubbs is supported by a Clinical Lectureship (ICA-CL-2017-03-001) jointly funded by Health Education England (HEE) and the National Institute for Health Re-search (NIHR). Brendon Stubbs is part funded by the NIHR Biomedical Research Centre at South London and Mauds-ley NHS Foundation Trust. This paper presents indepen-dent research supported by NIHR. The views expressed are those of the author(s) and not necessarily those of the (part-ner organization), the NHS, the NIHR or the Department of Health and Social Care. The authors declare that they have no competing interest.
CRP, c-reactive protein, IL, interleukin; TGF, tumor growth factor; IFN, interferon; Aβ, amyloid beta, T-tau, total tau protein; HFABP, heart-type fatty acid binding protein; YKL-40, chitinase-3-like protein 1; BDNF, brain-derived neurotrophic factor; sAPP, soluble, amyloid precursor protein; NFL, neurofilament light; NSE, neuron specific enolase; VLP, visinin like protein; HFABP, heart-type fatty acid binding protein; YKL-40, chitinase-3-like protein 1; GFAP, glial fibrillary acidic protein; NM, not mentioned. * Sample size of the meta-analysis was incorrectly described in the article.
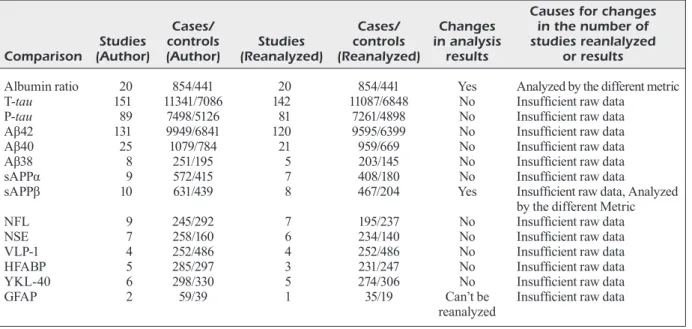
Table VI. Causes for the statistical changes after reanalysis.
Causes for changes
Cases/ Cases/ Changes in the number of Studies controls Studies controls in analysis studies reanlalyzed Comparison (Author) (Author) (Reanalyzed) (Reanalyzed) results or results
Albumin ratio 20 854/441 20 854/441 Yes Analyzed by the different metric T-tau 151 11341/7086 142 11087/6848 No Insufficient raw data
P-tau 89 7498/5126 81 7261/4898 No Insufficient raw data Aβ42 131 9949/6841 120 9595/6399 No Insufficient raw data Aβ40 25 1079/784 21 959/669 No Insufficient raw data Aβ38 8 251/195 5 203/145 No Insufficient raw data sAPPα 9 572/415 7 408/180 No Insufficient raw data
sAPPβ 10 631/439 8 467/204 Yes Insufficient raw data, Analyzed by the different Metric NFL 9 245/292 7 195/237 No Insufficient raw data NSE 7 258/160 6 234/140 No Insufficient raw data VLP-1 4 252/486 4 252/486 No Insufficient raw data HFABP 5 285/297 3 231/247 No Insufficient raw data YKL-40 6 298/330 5 274/306 No Insufficient raw data GFAP 2 59/39 1 35/19 Can’t be Insufficient raw data
D.Y. Jeong, J. Lee, J.Y. Kim, K.H. Lee, H. Li, et al.
Authors’ Contribution
D.Y.J., J.L., J.Y.K. and J.I.S. designed this study. D.Y.J. and J.L. gathered the data. D.Y.J., J.Y.K., and J.I.S. took part in reanalysis. D.Y.J., J.L., and J.I.S. wrote the first draft of the manuscript. K.H.L., H.L. and J.Y.L. gave critical comments on manuscript draft. G.H.J., S.Y., E.L.P., S.H.H., J.W.K., T.J.S., E.J., T.L., M.E., A.K., L.S., M.S., B.S., A.K., L.J., A.S., T.T., E.D., H.O., A.B., A.C., M.S.K., D.K.Y., S.W.L., J.M.Y., R.A.G., P.F.P. and J.I.S. reviewed and edited the manuscript. D.Y.J., J.L., J.Y.K., K.H.L., and J.I.S. had full access to all of the study data. All authors reviewed, wrote, and approved the final version. The corresponding author was responsible for the final decision to submit the paper for publication.
References
1) Apostolova LG. Alzheimer disease. Continuum (Minneap Minn) 2016; 22: 419-434.
2) Scheltens P, Blennow K, Breteler MM, de Stroop-er B, Frisoni GB, Salloway S, Van dStroop-er FliStroop-er WM. Alzheimer’s disease. Lancet 2016; 388: 505-517. 3) Porteri C, Albanese E, Scerri C, Carrillo MC,
Sny-der HM, Martensson B, Baker M, Giacobini E, Boccardi M, Winblad B, Frisoni GB, Hurst S, Ge-neva Task Force for the Roadmap of Alzheimer’s B. The biomarker-based diagnosis of Alzheimer’s disease. 1-ethical and societal issues. Neurobiol Aging 2017; 52: 132-140.
4) Mapstone M, Cheema AK, Fiandaca MS, Zhong X, Mhyre TR, MacArthur LH, Hall WJ, Fisher SG, Peterson DR, Haley JM, Nazar MD, Rich SA, Berlau DJ, Peltz CB, Tan MT, Kawas CH, Feder-off HJ. Plasma phospholipids identify anteced-ent memory impairmanteced-ent in older adults. Nat Med 2014; 20: 415-418.
5) Blennow K, Wallin A, Agren H, Spenger C, Sieg-fried J, Vanmechelen E. Tau protein in cerebro-spinal fluid: a biochemical marker for axonal de-generation in Alzheimer disease? Mol Chem Neu-ropathol 1995; 26: 231-245.
6) Boccardi M, Gallo V, Yasui Y, Vineis P, Padovani A, Mosimann U, Giannakopoulos P, Gold G, Du-bois B, Jack CR, Jr., Winblad B, Frisoni GB, Al-banese E, Geneva Task Force for the Roadmap of Alzheimer’s B. The biomarker-based diagnosis of Alzheimer’s disease. 2-lessons from oncology. Neurobiol Aging 2017; 52: 141-152.
7) Blennow K, Hampel H, Weiner M, Zetterberg H. Cerebrospinal fluid and plasma biomarkers in Alz-heimer disease. Nat Rev Neurol 2010; 6: 131-144. 8) Motter R, Vigo-Pelfrey C, Kholodenko D, Barbour
R, Johnson-Wood K, Galasko D, Chang L, Miller B, Clark C, Green R, Olson D, Southwick P, Wol-fert R, Munroe B, Lietrbourg I, Seubert P, Schenk D. Reduction of beta-amyloid peptide42 in the ce-rebrospinal fluid of patients with Alzheimer’s dis-ease. Ann Neurol 1995; 38: 643-648.
9) Henriksen K, O’Bryant SE, Hampel H, Trojanows-ki JQ, Montine TJ, Jeromin A, Blennow K,
Lon-neborg A, Wyss-Coray T, Soares H, Bazenet C, Sjogren M, Hu W, Lovestone S, Karsdal MA, Wein-er MW, blood-based biomarkWein-er intWein-erest G. The fu-ture of blood-based biomarkers for Alzheimer’s disease. Alzheimers Dement 2014; 10: 115-131. 10) Swardfager W, Lanctot K, Rothenburg L, Wong
A, Cappell J, Herrmann N. A meta-analysis of cy-tokines in Alzheimer’s disease. Biol Psychiatry 2010; 68: 930-941.
11) Virk SA, Eslick GD. Aluminum levels in brain, serum, and cerebrospinal fluid are higher in Alzheimer’s dis-ease cases than in controls: a series of meta-analy-ses. J Alzheimers Dis 2015; 47: 629-638.
12) Shen L, Ji HF. Associations between homocys-teine, folic acid, vitamin B12 and Alzheimer’s dis-ease: Insights from meta-analyses. J Alzheimers Dis 2015; 46: 777-790.
13) Belbasis L, Kohler CA, Stefanis N, Stubbs B, van Os J, Vieta E, Seeman MV, Arango C, Carvalho AF, Evangelou E. Risk factors and peripheral bio-markers for schizophrenia spectrum disorders: an umbrella review of meta-analyses. Acta Psychiatr Scand 2018; 137: 88-97.
14) Belbasis L, Bellou V, Evangelou E, Ioannidis JP, Tzou-laki I. Environmental risk factors and multiple sclero-sis: an umbrella review of systematic reviews and me-ta-analyses. Lancet Neurol 2015; 14: 263-273. 15) Fusar-Poli P, Hijazi Z, Stahl D, Steyerberg EW.
The science of prognosis in psychiatry: a review. JAMA Psychiatry 2018; 75: 1289-1297.
16) Fusar-Poli P, Radua J. Ten simple rules for con-ducting umbrella reviews. Evid Based Ment Health 2018; 21: 95-100.
17) Wan X, Wang W, Liu J, Tong T. Estimating the sample mean and standard deviation from the sample size, median, range and/or interquartile range. BMC Med Res Methodol 2014; 14: 135. 18) Hozo SP, Djulbegovic B, Hozo I. Estimating the
mean and variance from the median, range, and the size of a sample. BMC Med Res Methodol 2005; 5: 13.
19) DerSimonian R, Laird N. Meta-analysis in clinical trials. Control Clin Trials 1986; 7: 177-188.
20) Lau J, Ioannidis JP, Schmid CH. Quantitative synthesis in systematic reviews. Ann Intern Med 1997; 127: 820-826.
21) Baumeister D, Akhtar R, Ciufolini S, Pariante CM, Mondelli V. Childhood trauma and adult-hood inflammation: a meta-analysis of peripher-al C-reactive protein, interleukin-6 and tumour necrosis factor-alpha. Mol Psychiatry 2016; 21: 642-649.
22) Bowden J, Tierney JF, Copas AJ, Burdett S. Quantifying, displaying and accounting for het-erogeneity in the meta-analysis of RCTs using standard and generalised Q statistics. BMC Med Res Methodol 2011; 11: 41.
23) Higgins JPT, Thompson SG. Quantifying hetero-geneity in a meta-analysis. Stat Med 2002; 21: 1539-1558.
Umbrella review of cerebrospinal fluid biomarkers of Alzheimer’s disease
24) Egger M, Davey Smith G, Schneider M, Minder C. Bias in meta-analysis detected by a simple, graphical test. BMJ 1997; 315: 629-634.
25) Sterne JA, Sutton AJ, Ioannidis JP, Terrin N, Jones DR, Lau J, Carpenter J, Rucker G, Har-bord RM, Schmid CH, Tetzlaff J, Deeks JJ, Pe-ters J, Macaskill P, Schwarzer G, Duval S, Altman DG, Moher D, Higgins JP. Recommendations for examining and interpreting funnel plot asymmetry in meta-analyses of randomised controlled trials. BMJ 2011; 343: d4002.
26) Ioannidis JP, Trikalinos TA. An exploratory test for an excess of significant findings. Clin Trials 2007; 4: 245-253.
27) Ioannidis JP. Excess significance bias in the lit-erature on brain volume abnormalities. Arch Gen Psychiatry 2011; 68: 773-780.
28) Kavvoura FK, McQueen MB, Khoury MJ, Tan-zi RE, Bertram L, Ioannidis JP. Evaluation of the potential excess of statistically significant find-ings in published genetic association studies: ap-plication to Alzheimer’s disease. Am J Epidemiol 2008; 168: 855-865.
29) Ioannidis JPA. Clarifications on the application and interpretation of the test for excess signifi-cance and its extensions. J Math Psychol 2013; 57: 184-187.
30) Lubin JH, Gail MH. On power and sample size for studying features of the relative odds of disease. Am J Epidemiol 1990; 131: 552-566.
31) Higgins JP, Thompson SG, Spiegelhalter DJ. A re-evaluation of random-effects meta-analysis. J R Stat Soc Ser A Stat Soc 2009; 172: 137-159. 32) Riley RD, Higgins JP, Deeks JJ. Interpretation of
random effects meta-analyses. BMJ 2011; 342: d549.
33) Higgins JPT. Commentary: heterogeneity in me-ta-analysis should be expected and appropriately quantified. Int J Epidemiol 2008; 37: 1158-1160. 34) Bellou V, Belbasis L, Tzoulaki I, Middleton LT,
Io-annidis JPA, Evangelou E. Systematic evaluation of the associations between environmental risk factors and dementia: an umbrella review of
sys-tematic reviews and meta-analyses. Alzheimers Dement 2017; 13: 406-418.
35) Bellou V, Belbasis L, Tzoulaki I, Evangelou E, Io-annidis JP. Environmental risk factors and Parkin-son’s disease: n umbrella review of meta-analy-ses. Parkinsonism Relat Disord 2016; 23: 1-9. 36) Bortolato B, Kohler CA, Evangelou E,
Leon-Ca-ballero J, Solmi M, Stubbs B, Belbasis L, Pac-chiarotti I, Kessing LV, Berk M, Vieta E, Carvalho AF. Systematic assessment of environmental risk factors for bipolar disorder: an umbrella review of systematic reviews and meta-analyses. Bipolar Disord 2017; 19: 84-96.
37) Dwan K, Altman DG, Arnaiz JA, Bloom J, Chan AW, Cronin E, Decullier E, Easterbrook PJ, Von Elm E, Gamble C, Ghersi D, Ioannidis JP, Simes J, Williamson PR. Systematic review of the em-pirical evidence of study publication bias and out-come reporting bias. PLoS One 2008; 3: e3081. 38) Borenstein M, Hedges LV, Higgins JP, Rothstein
HR. A basic introduction to fixed-effect and ran-dom-effects models for meta-analysis. Res Synth Methods 2010; 1: 97-111.
39) Blennow K, Biscetti L, Eusebi P, Parnetti L. Cere-brospinal fluid biomarkers in Alzheimer’s and Par-kinson’s diseases-From pathophysiology to clini-cal practice. Mov Disord 2016; 31: 836-847. 40) Visser PJ, Verhey F, Knol DL, Scheltens P,
Wah-lund LO, Freund-Levi Y, Tsolaki M, Minthon L, Wal-lin AK, Hampel H, Burger K, Pirttila T, Soininen H, Rikkert MO, Verbeek MM, Spiru L, Blennow K. Prevalence and prognostic value of CSF markers of Alzheimer’s disease pathology in patients with subjective cognitive impairment or mild cognitive impairment in the DESCRIPA study: a prospective cohort study. Lancet Neurol 2009; 8: 619-627. 41) Shaw LM, Vanderstichele H, Knapik-Czajka M,
Clark CM, Aisen PS, Petersen RC, Blennow K, Soares H, Simon A, Lewczuk P, Dean R, Siemers E, Potter W, Lee VM, Trojanowski JQ, Alzheimer’s Disease Neuroimaging I. Cerebrospinal fluid bio-marker signature in Alzheimer’s disease neuro-imaging initiative subjects. Ann Neurol 2009; 65: 403-413.