• 검색 결과가 없습니다.

Analysis of Bone Mineral Density according to Hemoglobin in University Students

N/A
N/A
Protected

Academic year: 2021

Share "Analysis of Bone Mineral Density according to Hemoglobin in University Students"

Copied!
8
0
0

로드 중.... (전체 텍스트 보기)

전체 글

(1)

pISSN 1738-3544 eISSN 2288-1662

Analysis of Bone Mineral Density according to Hemoglobin in University Students

Joon Yoon 1 , Dai-Joong Kim 2 , Hyun-Ho Sung 3 , Yoon-Kyung Jo 3

1

Department of Radiologic Technology, Dongnam Health University, Suwon 16328, Korea

2

Department of Laboratory Medicine, Bundang Jesaeng Hospital, Seongnam 13590, Korea

3

Department of Clinical Laboratory Science, Dongnam Health University, Suwon 16328, Korea

혈색소 농도에 따른 대학생의 골밀도 분석

윤 준 1 , 김대중 2 , 성현호 3 , 조윤경 3

1

동남보건대학교 방사선과,

2

분당제생병원 진단검사의학과,

3

동남보건대학교 임상병리과

This study was performed to evaluate the effect of hemoglobin (Hb) on bone mineral density (BMD) in university students by performing a quantitative analysis. The subjects included healthy university students aged 20 to 30 years. Although osteoporosis has traditionally been considered as a disease of aging women, it is becoming an increasingly concerning male health problem.

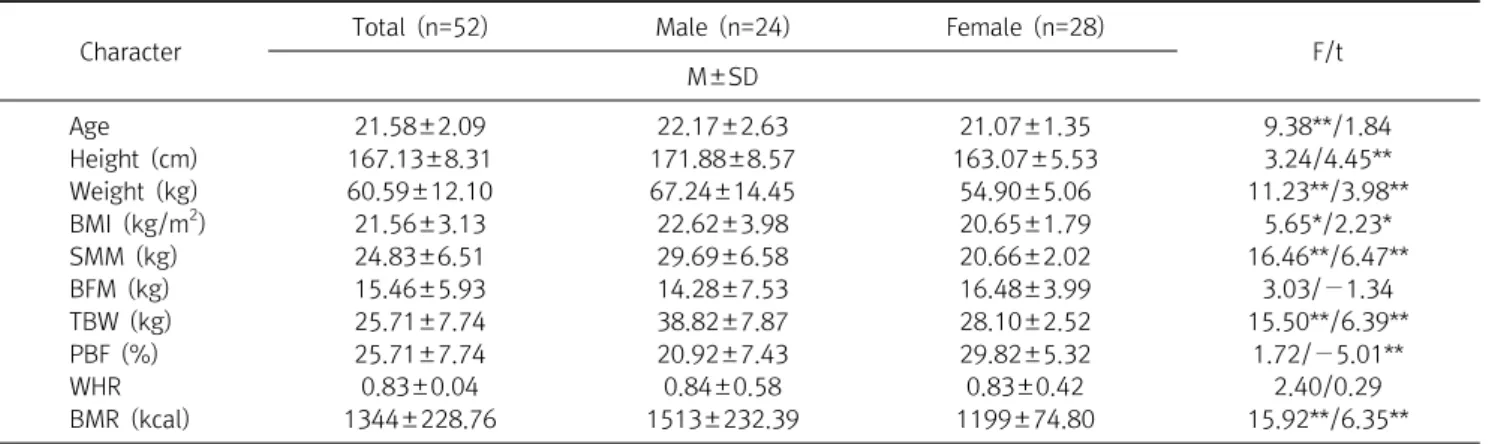
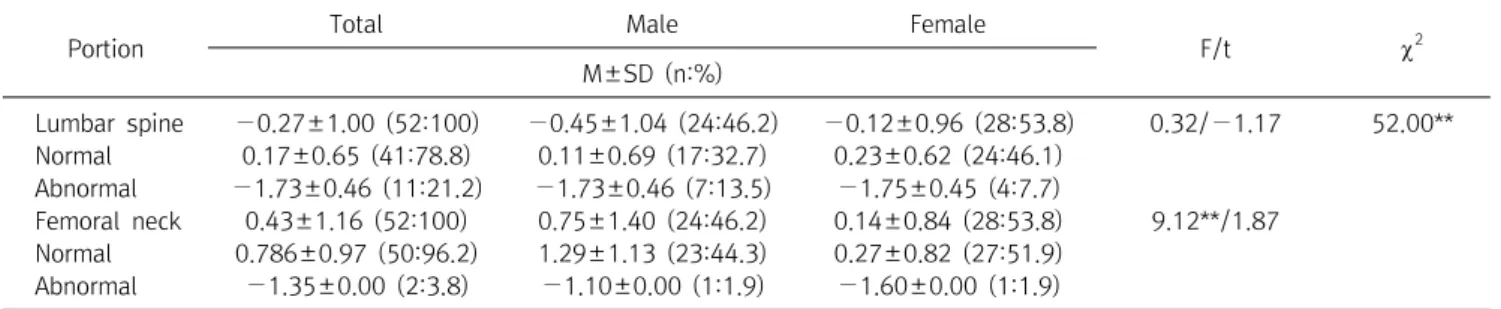
Diagnosis of osteoporosis is calculated with a quantitative assessment of BMD. Laboratory blood and urine tests are mainly used with low BMD or fragility fractures to identify any possible causes of bone metabolism disorders. In this study, there was no difference in BMD according to gender.

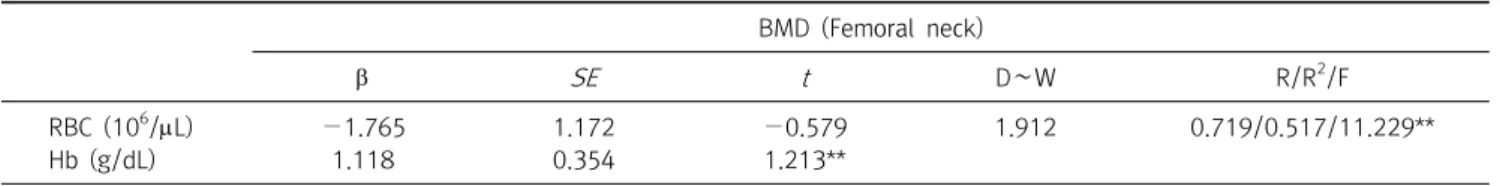
The average red blood cell (RBC), Hb, and Hematocrit (HCT) were significantly higher in males ( p <0.01). The correlation between lumbar spine, skeletal muscle mass (SMM), and basal metabolic rate (BMR) was statistically significant ( p <0.01). Hb showed a 51.7% statistical influence on BMD by multiple regression analysis. These findings are useful to understand the relationship between BMD and Hb; lower Hb level is associated with lower BMD. The Hb level was the strongest predictor of abnormal BMD. In conclusion, this study showed that a low Hb value was significantly correlated with low bone mass, suggesting that a low Hb value is a risk factor for changes in bone turnover that leads to a decrease bone density.

Key words: Bone mineral density, Hemoglobin

Corresponding author: Yoon-Kyung Jo Department of Clinical Laboratory Science, Dongnam Health University, 50 Cheoncheon-ro 74-gil, Jangan-gu, Suwon 16328, Korea

Tel: 82-31-249-6412 Fax: 82-31-249-6410 E-mail: ykjo@dongnam.ac.kr

This is an Open Access article distributed under the terms of the Creative Commons Attribution Non-Commercial License (http://creativecommons.org/licenses/by-nc/4.0) which permits unrestricted non-commercial use, distribution, and reproduction in any medium, provided the original work is properly cited.

Copyright © 2016 The Korean Society for Clinical Laboratory Science. All rights reserved.

Received: October 21, 2016 Revised: November 16, 2016 Accepted: November 17, 2016

Introduction

Most bone mineral density (BMD) is acquired before adolescence [1]. Bone is composed of osteoblasts and osteocytes;

remodeling cells, namely, osteoclasts; and non-mineral matrix of collagen and no collagenous proteins called osteoid, with inorganic mineral salts deposited within the matrix.

During life, the bones undergo processes of longitudinal and

radial growth, modeling and remodeling [2]. Bone protects

the vital organs, provides an environment for marrow (both

blood forming and fat storage), acts as a mineral reservoir for

calcium homeostasis and a reservoir of growth factors and

cytokines, and also takes part in acid–base balance [3]. There

are many factors influencing BMD which include heredity,

age, gender, weight, body length, smoking, calcium intake,

caffeine, alcohol etc [4]. Osteoporosis is a clinically-silent

(2)

disease in its early stages. Bone loss occurs without symp- toms. It can lead to hip and spine fractures later in life [5].

Hemoglobin (Hb) is the iron-containing oxygen-transport metalloprotein in the red blood cells of all vertebrates. Hb consists of globin molecules and these proteins, in turn, are folded chains of a large number of different amino acids called polypeptides. There is more than one hemoglobin gene: in humans, hemoglobin A is coded for by the genes, HbA1, HbA2, and HbB [6]. Anemia is usually defined as a decrease in the amount of red blood cells or hemoglobin in the blood.

There are three main types of anemia: that due to blood loss.

Causes of blood loss include trauma and gastrointestinal bleeding. Causes of decreased production include iron deficiency, a lack of vitamin B12, thalassemia, and a number of neoplasms of the bone marrow. Causes of increased breakdown include a number of genetic conditions such as sickle cell anemia, infections like malaria, and certain autoimmune diseases.

Erythropoietin (EPO) is a glycoprotein hormone that controls erythropoiesis, or red blood cell production. It is a cytokine for red blood cell precursors in the bone marrow [7].

EPO is an essential hormone for red blood cell production.

Without it, definitive erythropoiesis does not take place.

Under hypoxic conditions, the kidney will produce and secrete erythropoietin to increase the production of red blood cells by targeting colony-forming unit–erythrocyte (CFU-E), proerythroblast and basophilic erythroblast subsets in the differentiation. It is also similar mechanism in the liver.

Hematopoietic and osteogenic cells are known to affect each other’s function [8-10]. During blood loss, HSCs are stimulated. These activities may also activate osteoprogenitor cells in the bone marrow niche [11]. Hence, the aim of this study was to demonstrate the BMD and Hb quantitative analysis result in subjects who were university students. To our best knowledge, this relationship has not been studied yet. We aimed to make a comparison of bone health in healthy subjects with normal Hb values.

Materials and Methods

1. Subjects

A total of 52 healthy university students in the age of 20∼30 were investigated by direct experiment through BMD and complete blood cell count (CBC) test at a health university located in the southern part of Gyeonggi-do in 2015.

2. Anthropometric data and blood test

An automatic anthropometric instrument that measures the height and weight at the same time was used. Body Mass Index (BMI) was calculated using the SPSS statistical package by dividing weight by height squared and was treated as a variable. Body composition analysis was measured by using a body composition analysis equipment Inbody 770 (Biospace, Seoul, Korea) using a bioelectrical impedance analysis. The measured test items as skeletal muscle mass (SMM), body fat mass (BFM), total body water (TBW), percent body fat (PBF), the ratio of waist and hip (WHR) of the index calculation Kaufman, basal metabolic rate (BMR). Blood test was performed by collecting venous blood samples after fasting for more than 8 hours, and white blood cell (WBC), red blood cell (RBC), hemoglobin (Hb), hematocrit (HCT), mean corpuscular volume (MCV), mean corpuscular hemoglobin (MCH), mean corpuscular hemoglobin concentration (MCHC), red cell volume distribution width (RDW), platelet (PLT), plateletcrit (PCT), mean platelet volume (MPV), neutrophil segment, lymphocyte, monocyte, eosinophil were tested.

Blood tests were measured using LABGEO PT Hepatic Test 9 (Samsung Electronics, Suwon, Korea).

3. Bone mineral density measurement

BMD was measured using DPX-BRAVO (General Electric, New York, USA) is called Dual Energy X-Ray Absorptiometry (DXA), on 2 parts: Lumbar spine, Femoral neck. To measure bone mass with a DXA machine, the person lies on a flat padded table and remains motionless while the “arm” of the instrument passes over the whole body or over selected areas.

While the measurement is performed, a beam of low-dose

x-rays from below the table passes through the area being

measured. These x-rays are detected by a device in the

(3)

Table 1. General characteristics of subjects

Character Total (n=52) Male (n=24) Female (n=28)

M±SD F/t

Age 21.58±2.09 22.17±2.63 21.07±1.35 9.38**/1.84

Height (cm) 167.13±8.31 171.88±8.57 163.07±5.53 3.24/4.45**

Weight (kg) 60.59±12.10 67.24±14.45 54.90±5.06 11.23**/3.98**

BMI (kg/m

2

) 21.56±3.13 22.62±3.98 20.65±1.79 5.65*/2.23*

SMM (kg) 24.83±6.51 29.69±6.58 20.66±2.02 16.46**/6.47**

BFM (kg) 15.46±5.93 14.28±7.53 16.48±3.99 3.03/−1.34

TBW (kg) 25.71±7.74 38.82±7.87 28.10±2.52 15.50**/6.39**

PBF (%) 25.71±7.74 20.92±7.43 29.82±5.32 1.72/−5.01**

WHR 0.83±0.04 0.84±0.58 0.83±0.42 2.40/0.29

BMR (kcal) 1344±228.76 1513±232.39 1199±74.80 15.92**/6.35**

* p <0.05, ** p <0.01.

Abbreviation: BMI, body mass index; SMM, skeletal muscle mass; BFM, body fat mass; TBW, total body water; PBF, percent body fat;

WHR, the ratio of waist and hip; BMR, basal metabolic rate.

instrument’s “arm.” The machine converts the information received by the detector into an image of the skeleton and analyzes the quantity of bone in the skeleton. The results are usually reported as BMD, or “bone mineral density,” the amount of bone per unit of skeletal area. For the spine measurement, the person’s lower legs rest on a Styrofoam cube with the hips flexed. For the hip measurement, the toes are placed in a “pigeon-toed” position to rotate the hips and provide the largest projected area to measure. For the arm measurement, the person sits on a chair beside the machine and places an arm into a holding device while the measurement is taken. For a total body measurement, which provides individual measurements of the legs, the trunk, the pelvis, the ribs, the arms and the skull, the person simply lies flat and motionless. Results from a DXA are compared to two standards known as “age matched” or “young normal.” The Z score is age-matched and the T score compares to the young normal. The T score compares to a healthy 25-year old person of the same sex. A T score of 0 to -1 is considered normal, a T score of -1 to -2.5 is considered osteopenic and less than -2.5 is considered osteoporotic.

4. Statistical analysis

Statistical analysis was performed using the SPSS, PC, Version 21.0 (SPSS, Chicago, USA) program. A frequency analysis and mean (M) and standard deviation (SD) were calculated for the physical features, CBC results, and BMD of the subjects. An chi square analysis was performed for

homogeneity test, and independent t-test for the difference and a correlation analysis was performed for relational analysis. In addition, the multiple regression analysis was performed according to the correlation. All statistical significance level was set as p <0.05.

Results

1. General characteristics of subjects

The total number of subjects who participated in this study is 52 with 24 (46.15%) males and 28 (53.85%) females. The average age of the subjects was 21.58±2.09, showing no significant difference between the male and female group.

The average height of the subjects was 167.13±8.31 cm. The average weight of the subjects was 60.59±12.10 kg. The male showed higher levels than women in the height and weight which were statistically significant ( p <0.01). The average BMI of the subjects was 21.56±3.13 (kg/m2), the female showed a higher than men, they were statistically significant ( p <0.05). The average results of SMM, BFM, TBW, PBF, WHR, BMR were respectively 24.83±6.51 kg, 15.46±5.93 kg, 33.05±7.77 kg, 25.71±7.74 %, 0.83±0.04 and 1344±228.76 kcal in subjects. The Male showed a statistically significantly higher results than women in SMM, TBW and BMR ( p <0.01).

Conversely, PBF, showed a statistically significant higher

results in men than women. The general characteristic of the

subjects is described on Table 1.

(4)

Table 3. Measurement of BMD according to subjects

Portion Total Male Female

F/t 

2

M±SD (n:%)

Lumbar spine −0.27±1.00 (52:100) −0.45±1.04 (24:46.2) −0.12±0.96 (28:53.8) 0.32/−1.17 52.00**

Normal 0.17±0.65 (41:78.8) 0.11±0.69 (17:32.7) 0.23±0.62 (24:46.1) Abnormal −1.73±0.46 (11:21.2) −1.73±0.46 (7:13.5) −1.75±0.45 (4:7.7)

Femoral neck 0.43±1.16 (52:100) 0.75±1.40 (24:46.2) 0.14±0.84 (28:53.8) 9.12**/1.87 Normal 0.786±0.97 (50:96.2) 1.29±1.13 (23:44.3) 0.27±0.82 (27:51.9)

Abnormal −1.35±0.00 (2:3.8) −1.10±0.00 (1:1.9) −1.60±0.00 (1:1.9)

** p <0.01.

Abbreviation: BMD, bone mineral density.

Table 2. Complete blood count results of subjects

Variable Total (n=52) Male (n=24) Female (n=28)

M±SD F/t

WBC (10

3

/L) 6.39±1.57 6.43±1.69 6.35±1.49 0.18/0.19

LYM (%) 30.46±7.31 29.35±7.09 31.31±7.49 0.03/−0.96

MON (%) 5.44±2.18 5.26±2.13 5.60±2.25 0.00/0.99

GRA (%) 64.16±8.04 65.40±7.93 63.10±8.13 0.07/1.02

RBC (10

6

/L) 4.60±0.51 4.95±0.45 4.29±0.33 0.48/5.97**

Hb (g/dL) 13.82±1.85 15.20±1.52 12.64±1.16 0.21/6.86**

HCT (%) 37.43±4.73 40.96±3.84 34.41±3.03 0.05/6.87**

MCV (fL) 81.38±4.93 82.83±2.94 80.14±5.97 8.02**/2.00

MCH (pg) 30.07±2.19 30.77±1.47 29.47±2.53 6.43*/2.28*

MCHC (g/dL) 36.88±0.60 37.07±0.54 36.71±0.60 0.37/2.27*

RDW (fL) 15.04±1.19 14.81±0.83 15.23±1.41 5.15*/−1.26

PLT (10

3

/L) 220.60±64.77 207.50±40.79 231.82±78.89 4.63*/0.98

* p <0.05, ** p <0.01.

Abbreviation: CBC, complete blood cell count WBC, white blood cell; LYM, lymphocyte; MON, monocyte; GRA, granulocyte; RBC, red blood cell; Hb, hemoglobin; HCT, Hematocrit; MCV, mean corpuscular volume; MCH, mean corpuscular hemoglobin; MCHC, mean corpuscular hemoglobin concentration; RDW, red cell distribution width; PLT, platelet.

2. Complete blood count results of subjects

The average RBC in the male group was 4.95±0.45 and 4.29±0.33 in the female group, the average Hb in the male group was 15.20±1.52 and 12.64±1.16 in the female group, the average HCT in the male group was 40.96±3.84 and 34.41±3.03 in the female group, with the male group showing a significantly higher value ( p <0.01). The average MCH in the male group was 30.77±1.47 and 29.47±2.53 in the female group, with the male group showing a significantly higher value ( p <0.05). The average MCHC in the male group and female group was 37.07±0.54 and 36.71±0.60, respectively, with the male group showing significantly higher value ( p <0.05)(Table 2).

3. Measurement of BMD according to subjects

The difference in BMD test results in the normal group and abnormal group according to the gender was shown by several variables. There was no difference in BMD according to gender. The average lumbar spine in the normal group was 0.17±0.65 and −1.73± 0.46 in the abnormal group. The average femoral neck in the normal group was 0.786±0.97 and −1.35±0.00 in the abnormal group. A group of male and female in accordance with the normal and abnormal showed a difference in both groups, was statistically signi- ficant ( p <0.01) (Table 3).

4. Correlation analysis of body composition, CBC and BMD

The correlation between Lumbar spine, body composition,

(5)

Table 5. Multiple regression analysis of RBC and Hb according to BMD

BMD (Femoral neck)

 SE t D∼W R/R

2

/F

RBC (10

6

/L) −1.765 1.172 −0.579 1.912 0.719/0.517/11.229**

Hb (g/dL) 1.118 0.354 1.213**

** p <0.01.

Abbreviations are the same as those in Table 2, 3.

Table 4. Correlation of body composition and CBC results

Variable Height (cm) Weight (kg) BMI (kg/m

2

) SMM (kg) BMR (kcal) RBC (10

6

/L) Hb (g/dL) HCT (%)

Lumbar spine 0.330 0.152 0.029 0.357 0.361 0.110 0.289 0.256

Femoral neck 0.429* 0.491* 0.403 0.608** 0.603** 0.536** 0.682** 0.653**

* p <0.05, ** p <0.01.

Abbreviation: See Table 1, 2, 3.

Fig. 1. A scatter plot of the dependent variable (femoral neck) of the RBC and Hb.

CBC and BMD were no statistically. According to a correlation analysis of Femoral neck and body composition of the subjects, weight and height showed a positive correlation ( p <0.05). There was no correlation between the BMI statistically, while SMM, BMR were a statistically significant positive relationship ( p <0.01). RBC showed a positive correlation, Hb showed a positive correlation, HCT showed a positive correlation ( p <0.01)(Table 4).

5. Multiple regression analysis of RBC and Hb according to BMD

RBC and femoral neck was statistically correlated but showed t value of −0.579 with no influence at all. Hb values showed a positive correlation to Femoral neck with a t value of 1.213 ( p <0.01), which is affected under a statistically significant level. Multiple regression analysis showed that R-squared value was 0.517. Hb showed a 51.7% statistical influence on bone mineral density (Table 5) (Fig. 1).

Discussion

The purpose of this study is the analysis of hemoglobin influence on BMD. The subjects were studied 52 people aged 20 to 30 health university students. The experiment was conducted at the any Health University which is located in Suwon, Gyeonggi-do. Gender differences in demographic characteristics of age, there was no difference. Height and

weight were higher in male than female were statistically

significant ( p <0.01). Male also showed statistically higher

results than female in BMI ( p <0.05). In general, RBC, Hb and

HCT in the CBC test for men are higher than women [12]. Also

it showed the same results in this study ( p <0.01). Differences

in BMD (Lumbar spine, Femoral neck) according to gender in

this study was not statistically significant, according to the

group classification of BMD (Lumbar spine, Femoral neck)

were in different groups. Therefore, in this study, the

demographic classification by gender, CBC and BMD

analyzed for expression on it. While osteoporosis has been

traditionally considered as a disease of aging women, it is

becoming an increasingly important male health problem

(6)

[13]. Diagnosis of osteoporosis is calculated with a quantitative assessment of bone density, which is called BMD [14]. The best imaging modalities to assess bone density are the dual energy examination methods x-ray absorptiometry (DEXA) and quantitative computerized tomography (CT). CT is more sensitive but with the added risk of more radiation exposure, several experts prefer DEXA examination due to the less radiation exposure [15]. In addition to DEXA, osteoporosis examination can be done with BMI [16]. Overweight and obesity have been considered protective to bone health, while higher BMI levels to be associated with higher BMD score [17-20]. In this study, the height and weight were positively correlated with BMD and the same result. Thus, relationship between BMD and BMI is still not clearly defined, some authors found out a positive relationship, while others showed that BMI is a risk factor for osteoporosis [21]. As a result, the height and weight showed a positive correlation of BMD in this study. Although there are no standard diagnosis criteria, diagnosis is based on low muscle mass, low muscle strength. Sarcopenia and low SMM increase the risk of physical limitation and subsequent disability; therefore, recent articles report that this condition increases the risk of comorbid conditions [22-23]. In this study, BMD and SMM showed a high correlation.

Many studies have been undertaken to reveal the exact mechanisms of bone loss. Laboratory blood and urine tests are mainly used with low BMD or fragility fractures in order to identify possible causes of the disorder of bone metabolism.

They help to differentiate osteoporosis from other osteopenic conditions such as osteomalacia and identify secondary causes of osteoporosis. In previous studies red blood cells exhibited a higher result from normal subjects as compared with osteopenia [24]. On the other hand the value of the hemoglobin, but is statistically not different, hematocrit was a statistically significant result [25]. Various factors, including hormones, nutritional intake of calcium and protein, physical activities, medication use, and smoking, are known to influence the formation and maintenance of bone [26]. A recent study has suggested that among lumbar BMD-related factors, age, weight, pulse rate, and glycated hemoglobin (HbA1c) level can predict lumbar BMD in premenopausal

females, with weight being the most influential predictive factor [27]. Healthy women loose about 70 mL of blood every month, which adds up to some 850 mL per year and approximately 30 L over the 35 years of their reproductive life. Blood loss intensifies hematopoiesis by increasing the level of hematopoietic growth factors while, at the same time, stimulating proliferation of osteogenic progenitor cells [28].

EPO is the main hormone that regulates the production of red blood cells (hematopoiesis), by stimulating their progenitors [29]. Blood loss creates developmental pressure on the hematopoietic system, augments production of hematopoietic growth factors with subsequent intensified proliferation of hematopoietic progenitor cells, and increases the number of hematopoietic cells including osteoclasts, thus intensifying resorption of bone tissue and extension of hematopoietic territories [28]. The level of synthesis of EPO in the kidneys (or liver) is primarily governed by the needs of the given cells for oxygen. Anemia is diagnosed by measuring Hb levels and HCT and by comparison with a given reference values. In healthy people relationship between the mass of red blood cells and hemoglobin saturation with oxygen is linear. In chronically anemic people there is an inverse linear relationship between serum EPO and hemoglobin [30]. EPO can enhance bone formation by increasing the expression of vascular endothelial growth factor and bone morphogenetic protein. In addition, EPO regulates bone formation through mammalian target of rapamycin (mTOR) signaling [31]. The actual anemia of the illness is caused by hemolysis, the destruction of the red cells, because of their shape. Although the bone marrow attempts to compensate by creating new red cells, it does not match the rate of destruction. Healthy red blood cells typically function for 90∼120 days. Important evidence supporting the substantial role of hematopoietic insufficiency in the development of osteoporosis comes from the field of clinical hematology. Compared with normal subjects from the general population, the patients with sickle cell anemia exhibited lower bone mineral density values in all scan regions (approximately 6% to 21% lower than expected).

These differences in the lumbar spine were significant for

both girls and boys [32]. But in this study, BMD in the lumbar

spine did not produce significant results. Such reasons

(7)

leading study subject is considered because of growing boys and girls. In the preceding paper published in 2007, a significant relationship was demonstrated between low hemoglobin levels and lower BMD [33]. These result showed the same results in this study which showed that hemoglobin is statistically affects BMD ( p <0.01). EPO not only directly promotes osteoblastic differentiation but also indirectly stimulates osteoblastic phenotypes through communication of osteoclast-osteoblast contact. These findings are useful for understanding BMD and Hb a significant relationship between lower Hb levels and lower BMD. Hb level was the strongest predictor of abnormal BMD. Further research is needed to address fracture risk and therapeutic interventions.

In conclusion, this study has shown that low Hb value had significantly of subjects with low bone mass. This means that low Hb value has a rule as a risk factor in changes of bone turnover leading to decrease bone density.

요 약

본 연구는 대학생을 대상으로 혈색소와 골밀도를 평가하고, 혈 색소와 골밀도 정량 분석 결과를 보기 위하여 시작되었다. 본 연구 는 골밀도에 미치는 혈색소의 영향을 목적으로 하였다. 연구대상자 는 20∼30세의 건강한 대학생 52명을 직접 실험을 진행하였다. 골 다공증은 전통적 노화 여성의 질병으로 간주되었지만, 점차 남성의 건강 문제로 되고 있다. 골다공증의 진단은 골밀도의 정량적 평가 로 계산된다. 검사실에서 실시하는 혈액과 소변 검사는 주로 뼈의 신진 대사의 장애의 원인을 파악하기 위해 낮은 BMD 또는 취약성 골절에 사용된다. 본 연구는 성별에 따른 골밀도의 차이는 없었다.

평균 적혈구수, 혈색소 및 적혈구 용적은 남성에게서 상당히 높은 값을 나타내었다( p <0.01). 요추 척추, 골격근양, 기초대사량 사이 의 상관 관계는 통계적으로 유의 한 수준에서 정의 관계로 나타났 다( p <0.01). 다중회귀분석결과 혈색소는 골밀도에 51.7% 통계적 영향을 나타냈다. 이러한 연구 결과는 골밀도와 혈색소에서 유의한 관계를 이해하는데 유용하며, 혈색소 수준은 골밀도 수준을 예측하 는데 강력한 인자이다. 결론적으로, 본 연구에서 낮은 Hb 값이 낮은 뼈 질량을 가진 피험자에서 유의한 결과를 보여, 낮은 Hb 값이 골밀 도를 감소시키는 뼈 회전율 변화의 위험 요소로서의 규칙을 가짐을 의미한다고 사료된다.

Acknowledgements: None

Funding: This study was financially supported by Dongnam Health University.

Conflict of interest: None

References

1. Kouda K, Ohara K, Nakamura H, Fujita Y, Iki M. Predicting bone mineral acquisition during puberty: data from a 3-year follow-up study in Hamamatsu, Japan. J Bone Miner Metab.

2016;1-7. doi:10.1007/s00774-016-0740-4.

2. Boskey AL, Coleman R. Aging and bone. J Dent Res. 2010;

89(12):1333–1348. doi: 10.1177/0022034510377791.

3. Taichman RS. Blood and bone: two tissues whose fates are in- tertwined to create the hematopoietic stem cell niche. Blood.

2005;105(7):2631-2639.

4. Kim YR, Lee TY, Park YS, Cheon HK. The effect of lifestyle hab- its and nutrient intake conditions of female shift workers at general hospitals on bone mineral density values. J Radiol Sci Technol. 2012;35(1):9-15.

5. Ghobadi M, Hoseini R. Investigating the effects of physical ac- tivity levels, dairy products and calcium intakes on risk factors of osteoporosis prevention in female students of Islamic Azad University of Damavand, Iran. Medical-biological Problems of Physical Training and Sports. 2014;11:79-82.

6. Hardison RC. Evolution of hemoglobin and its genes. Cold Spring Harb Perspect Med. 2012;2: a011627.

7. Heo TH, Kim YK, Yang SJ, Cho HJ, Kim SJ. Immunogenicity of recombinant human erythropoietin: clinical cases, causes and assays. J Exp Biomed Sci. 2009;15:161-166.

8. Li Z, Li L. Understanding hematopoietic stem-cell microen- vironments. Trends Biochem Sci. 2006;10:589-595.

9. Wilson A, Trumpp A. Bone-marrow haematopoietic-stem-cell niches. Nat Rev Immunol. 2006;2:93-106.

10. Yin T, Li L. The stem cell niches in bone. J Clin Invest. 2006;

116(5):1195-1201.

11. Lucas TS, Bab IA, Lian JB, Stein GS, Jazrawi L, Majeska RJ, et al.

Stimulation of systemic bone formation induced by ex- perimental blood loss. Clin Orthop Relat Res. 1997;340:267-275.

12. Park SK. An interpretation on abnormal finding of CBC. Korean J Med. 2010;78(5):531-539.

13. Johnell O, Kanis JA. An estimate of the worldwide prevalence and disability associated with osteoporotic fractures. Osteoporos Int. 2006;17:1726-1733.

14. Compston J, Cooper A, Cooper C, Francis R, Kanis JA, Marsh D, et al. Guideline for the diagnosis and management of osteopo- rosis in postmenopausal women and men from the age of 50 years in the UK. Maturitas. 2013;62:105-108.

15. Priyana A, Peran pertanda tulang dalam serum pada tata laksa- na osteoporois. Universa Medicina. 2016;26(3):152-159.

16. Department of Health and Human Services, Centers for Disease Control and Prevention. Body mass index: considerations for practitioners [cited 2015 September 19]. Available from: www.

cdc. gov/obesity/downloads/bmiforpactitioners.pdf.

(8)

17. Morin S, Leslie WD. Manitoba bone density program, high bone mineral density is associated with high body mass index.

Osteoporos Int. 2009;20(7):1267-1271. doi: 10.1007/s00198- 008-0797-6.

18. Andreoli A, Bazzocchi A, Celi M, Lauro D, Sorge R, Tarantino U, et al. Relationship between body composition, body mass index and bone mineral density in a large population of normal, os- teopenic and osteoporotic women. Radiol Med. 2011;116(7):

1115-1123.

19. Langsetmo L, Hitchcock CL, Kingwell EJ, Davison KS, Berger C, Forsmo S, et al. Physical activity, body mass index and bone mineral density-associations in a prospective population- based cohort of women and men: the Canadian Multicentre Osteoporosis Study (CaMos). Bone. 2012;50(1):401-408. doi:

10.1016/j.bone.2011.11.009.

20. Salamat MR, Salamat AH, Abedi I, Janghorbani M. Relationship between weight, body mass index, and bone mineral density in men referred for dual-energy X-ray absorptiometry scan in Isfahan, Iran. J Osteoporos. 2013;205963:7. doi: 10.1155/2013/

205963.

21. Ishii K, Taguchi A, Nakamoto T, Ohtsuka M, Sutthiprapaporn P, Tsuda M, et al. Diagnostic efficacy of alveolar bone loss of the mandible for identifying postmenopausal women with femoral osteoporosis. Dentomaxillofac Radiol. 2007;36:28-33.

22. Delmonico MJ, Harris TB, Lee JS, Visser M, Nevitt M, Kritchevsky SB, et al. Alternative definitions of sarcopenia, lower extremity performance, and functional impairment with aging in older men and women. J Am Geriatr Soc, 2007;55:

769-774.

23. Goodpaster BH, Park SW, Harris TB, Kritchevsky SB, Nevitt M, Schwartz AV, et al. The loss of skeletal muscle strength, mass, and quality in older adults: the health, aging and body compo- sition study. J Gerontol A Biol Sci Med Sci. 2006;61:1059-1064.

24. Lin X, Yu H, Zhao C, Qian Y, Hong D, Huang K, et al. The periph- eral blood mononuclear cell count is associated with bone health in elderly men: A cross-sectional population-based study. Me- dicine. 2016;95(15):e3357. doi: 10.1097/MD.0000000000003357.

25. Lim HS, Park YH, Kim SK. Relationship between serum in- flammatory marker and bone mineral density in healthy adults.

J Bone Metab. 2016;23(1):27-33.

26. Matkovic V. Calcium intake and peak bone mass. N Engl J Med.

1992;327:119-120.

27. Shin S, Lee K, Song C. Relationship of body composition, knee extensor strength, and standing balance to lumbar bone miner- al density in postmenopausal females. J Phys Ther Sci. 2016;

28(7): 2105-2109.

28. Gurevitch O, Slavin S. The hematological etiology of oste- oporosis. Med Hypotheses. 2006;67(4): 729-735.

29. Hiram-Bab S, Neumann D, Gabet Y. Erythropoietin in bone–

Controversies and consensus. Cytokine. 2016;S1043-4666(16) 30008-4. doi: 10.1016/j.cyto.2016.01.008

30. Panjeta M, Tahirovic I, Karamehic J, Sofic E, Ridic O, Coric, J.

The relation of erythropoietin towards hemoglobin and hema- tocrit in varying degrees of renal insufficiency. Materia so- cio-medica, 2015;27(3):144-148.

31. Li C, Shi C, Kim J, Chen Y, Ni S, Jiang L, et al. Erythropoietin promotes bone formation through EphrinB2/EphB4 signaling.

Journal of dental research, 2015;94(3):455-463.

32. Brinker MR, Thomas KA, Meyers SJ, Texada T, Humbert JR, Cook SD, et al. Bone mineral density of the lumbar spine and proximal femur is decreased in children with sickle cell anemia.

Am J Orthop (Belle Mead NJ). 1998;27(1):43-49.

33. Sarrai M, Duroseau H, D‘Augustine J, Moktan S, Bellevue R.

Bone mass density in adults with sickle cell disease. Br J

Haematol. 2007;136(4): 666-672.

수치

Table  1.  General  characteristics  of  subjects
Table  2.  Complete  blood  count  results  of  subjects
Fig.  1.  A  scatter  plot  of  the  dependent  variable  (femoral  neck)  of  the  RBC  and  Hb.

참조

관련 문서

Our results also showed that pigment epithelium-derived factor concentration in vitreous was higher than that in serum, suggesting that it is mainly derived from

Effects of pulse frequency of low-level laser thrapy (LLLT)on bone nodule formation in rat calvarial cells.. Low-level laser therapy stimulats

In 4-week group, the group filled with bone graft with decortication revealed larger new bone formation area than shown in the group that had a defect area

It might also act in conjunction with a growth factor, such as bone morphogenic protein (BMP), insulin-like growth factor, or platelet-derived growth factor.

In addition, if the patients had a high MPV level (cut-off value of 7.95 fL) without low-dose aspirin therapy, they were at risk for ischemic stroke, especially in

Biochemical markers of bone turnover can be classified according to the process that underlie in markers of bone formation, products of the osteoblast

Higher power view of the box area of the left figure showed poor new-bone formation around the implant (asterisk) and low BIC. Villanueva

The result of using PLGA nanofiber membrane with bone graft material showed that the PLGA nanofiber membrane in the experimental group of 2 weeks were ten times more new