Effect of Diet Change on Gut Microbiota:
Observational Pilot Study of Four Urban Couples
Yujin Roh1, Jeongsang Lee2, Won Gyoung Kim3, Gahye Yi4, Byung Kwon Kim5, Bumjo Oh4,*
1Department of Medicine, Seoul National University College of Medicine, Seoul; Departments of 2Thoracic and Cardiovascular Surgery, 3Nutrition Service, and
4Family Medicine, SMG-SNU Boramae Medical Center, Seoul; 5Omicspia Co., Ltd., Daejeon, Korea
Background: Recent studies have focused on changes in gut microbiota following a dietary change. We iden- tified how the distribution of gut microbiota changed when the dietary habits of young city dwellers improved using an intervention in which married couples shared the same dietary habits.
Methods: Four married couples in their 30s with irregular eating habits and sedentary lifestyles were asked whether they had any uncomfortable symptoms. A nutritionist advised them to reduce their intake of processed meats, carbonated beverages, and late-night snacks. After a 6-week intervention, subjects were asked whether they observed any changes in their symptoms. Their stool samples were collected before and after the interven- tion and analyzed to determine whether the gut microbiota had changed.
Results: After the dietary intervention, some subjective symptoms of the participants improved. Specifically, a subject who complained of frequent abdominal pain/diarrhea and one who complained of fatigue showed im- provement in those symptoms. In addition, some subjects showed improvements in symptoms such as skin dis- ease or constipation. Intestinal microorganisms between spouses who share the same dietary habits were found to be similar.
Conclusion: Improvements in eating habits can change the distribution of gut microbiota and alleviate various uncomfortable medical symptoms. Within married couples, the distribution of gut microbiota became similar when the spouses shared the same dietary habits. These results suggest a possible correlation between family- level changes in eating habits and the health of all family members.
Key words: Diet therapy, Gastrointestinal microbiome, Urban population, Spouses
Received October 31, 2017 Reviewed November 10, 2017 Accepted November 17, 2017
* Corresponding author Bumjo Oh
https://orcid.org/0000-0002-2468-0755 Department of Family Medicine, SMG-SNU Boramae Medical Center, 20 Boramae-ro 5-gil, Dongjak-gu, Seoul 07061, Korea
Tel: +82-2-870-2682 Fax: +82-2-831-0714 E-mail: [email protected]
The first two authors contributed equally to this study.
INTRODUCTION
Chronic conditions such as type 2 diabetes, autoimmune diseas- es, cardiovascular disease, metabolic syndrome, and obesity are widely considered to be associated with unhealthy lifestyles and behaviors.
1Thus, lifestyle modifications, including stress manage- ment, emotional well-being, positive social relationships, smoking cessation, balanced diet, regular physical activity (PA), and moder- ate consumption of alcohol
2-5, are important in preventing and treat- ing those diseases.
Meanwhile, interest has been growing in indigenous microbial
communities and the host environment that they inhabit. Microbes that inhabit human bodies benefit the entire host-microbe system by supplying crucial ecosystem services. They produce important resources, convert nutrients biologically, and protect their host from pathogenic microbes.
6Therefore, the disruption of the beneficial functions of microbiota can lead to disease. Recently, many studies have suggested a correlation between microbiota and some chronic illnesses, such as inflammatory bowel disease, obesity, type 1 diabe- tes, and pulmonary diseases.
7-11As an easily modifiable lifestyle factor, diet has substantial effects on human health by modifying intestinal microbiota.
12,13Many data
Copyright © 2017 Korean Society for the Study of Obesity
This is an Open Access article distributed under the terms of the Creative Commons Attribution Non-Commercial License (http://creativecommons.org/licenses/by-nc/4.0/) which per- mits unrestricted non-commercial use, distribution, and reproduction in any medium, provided the original work is properly cited.
2017-03-16 https://crossmark-cdn.crossref.org/widget/v2.0/logos/CROSSMARK_Color_square.svg
suggest the importance of diet in establishing human intestinal mi- crobiota.
14,15The consumption of various nutrients affects the struc- ture of the microbial community and provides substrates for micro- bial metabolism.
16The microbiota can produce molecules absorbed by the host and can affect many important physiological process- es.
16,17Functional studies in animal models, as well as descriptive association studies in humans, provide evidence for the role of diet in disease pathogenesis through its effects on intestinal microbes.
16Couples who live together share their lifestyles. They tend to eat similar foods, do exercise together, and enjoy leisure activities to- gether. As time goes by, their physical condition might become very similar to each other, and they become susceptible to similar diseases.
18Because diet can alter gut microbiota, we analyzed the intestinal microbiome of eight people (four married couples) to observe changes in microbiota following a dietary intervention. We also determined how similar changes in individuals were to those in their partner. Participants were asked to maintain a well-balanced and healthy diet for 6 weeks.
METHODS Participants
Four Korean couples (eight participants) with skin diseases (pso- riasis, atopic dermatitis, etc.) or gastrointestinal symptoms (diar- rhea, constipation, etc.) were recruited for this research. This study was approved by the Institutional Review Board of SMG-SNU Boramae Medical Center (IRB No. 26-2016-141), and written in- formed consent was obtained from all participants before their ad- mission to the protocol. Symptoms and characteristics of the four couples were evaluated, and we carried out an anthropometric in- vestigation and nutritional survey to establish participants’ nutri- tional status and dietary lifestyles. Their fecal samples were also col- lected. For 6 weeks, the participants submitted to a dietary inter- vention to reduce their intake of processed meat, carbonated bever- ages, and late-night snacks, while maintaining a well-balanced healthy diet. The couples were asked to eat at least one meal together every day. After the intervention, their fecal samples were collected again, and each individual’s gut microbiota were analyzed using a high- throughput sequencing technique. Participants were also asked to report any changes in their symptoms.
Characteristics of participants
Social history, physical activity, and mental health
We interviewed participants to learn their occupations and wheth- er they had any uncomfortable health problems. We also conduct- ed a survey in written form to ask participants if they had ever smoked.
If a participant answered “yes,” we asked how long they had smoked and how many cigarettes they had smoked each day. Through the survey, we asked participants if they drank alcohol. If a participant answered “yes,” we asked how often they drank and how much they drank per occasion.
We used the International Physical Activity Questionnaire to as- sess PA in three domains.
19The specific types of activity assessed are walking, moderate-intensity activities (moderate PA), and vig- orous intensity activities (vigorous PA). Frequency (measured in days per week) and duration (time per day) are collected separately for each specific type of activity. The volume of activity can be com- puted by weighting each type of activity by its energy requirements defined in metabolic equivalents (METs; multiples of the resting metabolic rate) to yield a score in MET-minutes. A MET-minute is computed by multiplying the MET score by the minutes performed:
walking= 3.3 METs, moderate PA= 4.0 METs, and vigorous PA=
8.0 METs.
We used the Korean-translated Brief Encounter Psychosocial In- strument (BEPSI-K) to assess the stress level of participants. BEPSI is a stress evaluation scale developed in 1988 by Frank and Zyzans- ki.
20In 1996, the Korean version of BEPSI, BEPSI-K was developed by Yim et al.
21It contains five questions and is designed to assess stress during the past month. Each item is rated on a scale of 0–4 points, and an average of 2.4 points or more is considered to be stressful. Because the BEPSI contains only a few simple questions, it can be used conveniently in primary care situations.
22We used the Patient Health Questionnaire-9 (PHQ-9) to screen for depression. The PHQ-9 incorporates the Diagnostic and Statis- tical Manual of Mental Disorders-IV depression diagnostic criteria and other leading major depressive symptoms into a brief self-re- port tool. The tool rates the frequency of the symptoms that factor into the scoring severity index. PHQ scores of 10 or more had a sensitivity of 88% and a specificity of 88% for major depression.
PHQ-9 scores of 5, 10, 15, and 20 represent mild, moderate, mod-
erately severe, and severe depression, respectively.
23Body measurement and assessing obesity
We measured the height and body weight of participants. Their body mass index (BMI), body fat percentage, and basal metabolic rate (BMR) were assessed using eight-polar bioelectrical imped- ance (InBody 3.0; Biospace, Seoul, Korea).
Dietary assessment and intervention
Dietary habits and diet quality
To evaluate the dietary habits of participants, we asked three ques- tions about bad eating habits: “How often do you drink carbonated drinks?”, “How often do you eat out?”, and “How often do you eat fast food?” The first item was rated as 0–3 points; the second item was rated as 0–2 points, and the last item was rated as 0–1 point.
We then summed all points.
We used the Recommended Food Score (RFS), a food-frequen- cy questionnaire based on reported consumption of foods contain- ing high amounts of antioxidant nutrients, to measure overall diet quality. Because current dietary guidelines emphasize the consump- tion of whole grains, legumes, vegetables, fruits, fish, dairy prod- ucts, nuts, and tea, participants received 1 point for each recom- mended food they reported consuming at least weekly. A total of 46 foods or food groups corresponding to recommended food groups were selected. We also used the “daily frequency of meals”
to calculate the RFS. Thus, the maximum possible score was 47, with scores greater than 36 points indicating a high-quality diet.
24Diet related health risk appraisal
We used a tool called the diet related health risk appraisal to as- sess the risk of chronic diseases based on individual dietary habits.
Dietary assessment
Before nutritional counseling, each participant wrote 3-day food record. For the analysis of the nutrients (carbohydrates, protein, fat) in the food consumed, we used the CAN-Pro 4.0 (Computer Aided Nutrition Analysis Program) from the Korean Nutrition So- ciety. A skilled clinical dietitian diagnosed nutritional problems based on the dietary assessment and conducted individual nutri- tional counseling.
Fecal sample collection and preparation
Fecal samples, which were taken at the participant’s home at the beginning and end of the program, were collected and stored at −80°C until analysis.
DNA extraction and pyrosequencing
Metagenomic DNA was extracted from the fecal samples using a FastDNA SPIN extraction kit (MP Biomedicals, Santa Ana, CA, USA). The 16S rRNA gene (target region V1–V3) was amplified with barcoded primers using a C1000 Touch thermal cycler (Bio- Rad, Hercules, CA, USA). Amplified products were purified using the QIAquick PCR purification kit (Qiagen, Valencia, CA, USA) and quantified using the PicoGreen dsDNA assay kit (Invitrogen, Carlsbad, CA, USA). Equimolar concentrations of samples were pooled and sequenced on a Roche/454 GS junior system (Roche Sequencing, Pleasanton, CA, USA) according to the manufactur- er’s instructions.
Pyrosequencing analysis
Sequences produced by the pyrosequencer were analyzed accord- ing to previous descriptions. Briefly, sequences for each sample were sorted using a unique barcode, and low-quality reads (average qual- ity score < 25 or read length < 300 bp) were removed. Primer se- quences were trimmed by the HMM-search program of the HM- MER 3.0 package (http://hmmer.org/). Trimmed sequences were clustered by 97% similarity, and representative sequences in each cluster were selected to identify their taxonomic positions. The taxonomic assignments of reads were conducted using the RDP- classifier with SILVA database and BLAST algorithm against Ez- Taxon-e database. Chimera sequences were detected and removed for further analysis using UCHIME. The diversity indices were cal- culated using the Mothur program (Mothur, Ann Arbor, MI, USA) after the read number in each sample had been normalized. The pyrosequencing reads obtained from this study are available in the European Molecular Biology Laboratory Sequence Read Archive database under study number.
Statistical analysis
Statistical analyses were performed using the STATA version 12.0
(Stata Corp., College Station, TX, USA). The changes in fecal mi-
crobiota were set as the dependent variable, and the body measure- ments and survey results were set as the discriminatory variables.
All survey and examination results were analyzed using the chi-square test and descriptive statistics to determine the frequency, percent- ages, and averages. The Pearson correlation method was used to confirm whether the Firmicutes to Bacteroidetes ratio was related to anthropometric data, including BMI. The P-value was determined using the Kruskal-Wallis H-test and Mann-Whitney rank-sum test, and a post-hoc test was performed using the Tukey-Kramer meth- od. Multiple test corrections were made using the Benjamini-Ho- chberg false discovery rate. Results with P-values <0.05 (two-tailed) were considered statistically significant.
RESULTS Characteristics of participants
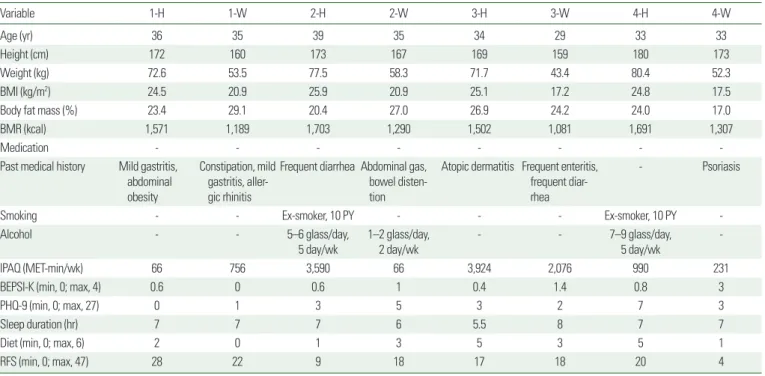
Table 1 summarizes the characteristics of the subjects, including their lifestyles.
Social history, physical activity, and mental health
Participant 1-H (husband) is a government employee with mild
gastritis. Participant 1-W (wife) is a housewife with severe consti- pation. She also has mild gastritis and allergic rhinitis. Participant 2-H is a building materials dealer with frequent diarrhea. He has smoked one pack a day for 10 years and drinks 5 days a week, five or six glasses per day. Participant 2-W is a housewife who frequent- ly has gas in the bowels. She drinks 2 days a week, one or two glass- es per day. Participant 3-H is a computer programmer who has suf- fered from atopic dermatitis for 17 years. Participant 3-W is a house- wife who frequently suffers from enteritis. Participant 4-H is an IT (information technology) company employee with no underlying disease. He has smoked one pack a day for 10 years and drinks 5 days a week, seven or nine glasses per day. Participant 4-W is a house- wife with psoriasis.
Based on MET-minutes scores, we assessed each participant’s level of PA. Participants 1-H, 2-W, and 4-W were classified as “inac- tive.” Participants 2-H and 3-H were classified as “health enhancing physical activity active.” Participants 1-W, 3-W, and 4-H were classi- fied as “minimally active.”
Using BEPSI-K, no participant felt severe stress. On the other hand, according to their PHQ-9 scores, participants 2-W and 4-H had mild depression. The other participants had no depression.
Table 1. Characteristics of participants
Variable 1-H 1-W 2-H 2-W 3-H 3-W 4-H 4-W
Age (yr) 36 35 39 35 34 29 33 33
Height (cm) 172 160 173 167 169 159 180 173
Weight (kg) 72.6 53.5 77.5 58.3 71.7 43.4 80.4 52.3
BMI (kg/m2) 24.5 20.9 25.9 20.9 25.1 17.2 24.8 17.5
Body fat mass (%) 23.4 29.1 20.4 27.0 26.9 24.2 24.0 17.0
BMR (kcal) 1,571 1,189 1,703 1,290 1,502 1,081 1,691 1,307
Medication - - - -
Past medical history Mild gastritis, abdominal obesity
Constipation, mild gastritis, aller- gic rhinitis
Frequent diarrhea Abdominal gas, bowel disten- tion
Atopic dermatitis Frequent enteritis, frequent diar- rhea
- Psoriasis
Smoking - - Ex-smoker, 10 PY - - - Ex-smoker, 10 PY -
Alcohol - - 5–6 glass/day,
5 day/wk 1–2 glass/day,
2 day/wk - - 7–9 glass/day,
5 day/wk -
IPAQ (MET-min/wk) 66 756 3,590 66 3,924 2,076 990 231
BEPSI-K (min, 0; max, 4) 0.6 0 0.6 1 0.4 1.4 0.8 3
PHQ-9 (min, 0; max, 27) 0 1 3 5 3 2 7 3
Sleep duration (hr) 7 7 7 6 5.5 8 7 7
Diet (min, 0; max, 6) 2 0 1 3 5 3 5 1
RFS (min, 0; max, 47) 28 22 9 18 17 18 20 4
Each couple is numbered, using H and W to indicate husband and wife, respectively.
BMI, body mass index; BMR, basal metabolic rate; PY, pack-year; IPAQ, International Physical Activity Questionnaire; MET, metabolic equivalent; BEPSI-K, Korean-translated Brief Encounter Psychosocial Instrument; min, minimum; max, maximum; PHQ-9, Patient Health Questionnaire-9; RFS, Recommended Food Score.
Body measurement and assessing obesity
The World Health Organization Asian BMI risk cut points es- tablish the following three BMI categories: 18.5–22.9 kg/m
2(nor- mal weight), 23–27.5 kg/m
2(overweight), and ≥27.5 kg/m
2(obese).
All male participants are overweight. Participants 3-W and 4-W have BMI scores below the normal range, which means they are underweight. Participants 1-W and 2-W have BMI scores in the normal range.
Evaluation of nutritional status and dietary intervention
Dietary habit and diet quality
Using the RFS, no participants began the study with a good qual- ity diet (Table 1).
Diet related health risk appraisal
The risk of chronic diseases was assessed by diet related health risk appraisal (Supplementary Table 1). Participants 1-H, 2-H, 3-H, and 4-H have a very high risk of hypercholesterolemia; participant 1-H has a high risk of hypertension; participant 4-H has a moder- ate risk of diabetes mellitus; participants 3-H and 4-H have a high risk of obesity, and participants 2-W, 3-H, and 4-H have a moderate risk of abdominal obesity.
Dietary assessment
Nutritional problems indicated in the dietary assessment and the causes of each problem were assessed (Supplementary Tables 2 and 3).
Comparison of gut microbiota distribution before and after the dietary intervention
Phylum level
In all samples, the highest percentage of gut microbiota were Bac
teroidetes and Firmicutes. Veillonellaceae, Ruminococcaceae, and Lach
nospiraceae are the main microorganisms in Bacteroidetes, and Rikenel
laceae, Prevotellaceae, and Bacteroidaceae are the main microorgan- isms in Firmicutes. The Firmicutes to Bacteroidetes ratio is known to correlate with obesity: the larger that ratio, the greater the likelihood of obesity.
Comparing the results before and after the dietary interventions, most of the samples changed from their original state. The Firmicutes
to Bacteroidetes ratio decreased in participants 1-H, 1-W, 3-H, 3-W, and 4-W and increased in participants 2-H, 2-W, and 4-H. We also used the Pearson correlation method to determine whether the an- thropometric values correlate with the Firmicutes to Bacteroidetes ratio. Overall, we found no correlation between that ratio and body mass, body fat percent, BMI, BMR, or eating habits. However, when analyzed separately for male subjects, body fat mass and the Firmicutes to Bacteroidetes ratio showed a negative but nonsignificant correla- tion of –0.91 (P=0.089), and BMR and the Firmicutes to Bacteroi
detes ratio showed a strong positive correlation of 0.96 (P=0.037).
Nevertheless, it is difficult to confirm the statistical significance of that correlation because the number of samples is only four, and it was not observed when the women were analyzed separately (Table 2).
In participants 1-H, 3-H, 3-W, and 4-W, Bacteroidetes increased significantly and Firmicutes decreased. On the other hand, in partici- pants 2-H and 4-H, Firmicutes increased significantly and Bacteroi
detes decreased. The largest change occurred in participants 3-H and 4-W. In participant 4-W, Firmicutes accounted for 97.5% of the mi- crobiota before the intervention. After the dietary control, Firmicutes decreased to 43.3%, and Bacteroidetes that were not present before became 60.4% of the microbiota. In participant 3-H, Firmi cutes ac- counted for 50% and Proteobacteria accounted for 34.8% before the intervention. After the dietary control, Firmicutes and Proteobacteria decreased to 23% and 0.05%, respectively, and Bacteroi detes account- ed for 76.5% of the microbiota. Proteobacteria are commonly observed in patients with diseases such as inflammatory bowel disease and are known to cause inflammation (Supplementary Fig. 1).
Table 2. Correlation between Firmicutes to Bacteroidetes ratio and anthropomet- ric data
Sample
ID Sex Weight
(kg)
Body fat mass
(%)
BMI (kg/m2)
BMR (kcal) RFS
Bacte- roidetes/
Firmicutes (%)
1-H Male 72.6 23.4 24.5 1,571 28 47.74
1-W Female 53.5 29.1 20.9 1,189 22 108.25
2-H Male 77.5 20.4 25.9 1,703 9 118.09
2-W Female 58.3 27.0 20.9 1,290 18 50.46
3-H Male 71.7 26.9 25.1 1,502 17 15.22
3-W Female 43.4 24.2 17.2 1,081 18 106.22
4-H Male 80.4 24.0 24.8 1,691 20 83.47
4-W Female 52.3 17.0 17.5 1,307 4 0
BMI, body mass index; BMR, basal metabolic rate; RFS, Recommended Food Score.
Genus level
At the genus level, the samples containing Bacteroides as the ma- jor portion were 1-H (before the intervention [bef]), 1-H (after the intervention [aft]), 1-W (bef), 1-W (aft), 3-H (aft), 4-H (bef), and 4-H (aft). The samples containing Prevotella as the major por- tion were 2-H (bef), 2-W (aft), 3-W (bef), 3-W (aft), and 4-W (aft).
In the 2-H (aft) sample, Ruminococcus (Ruminococcaceae) account- ed for the major portion.
Prevotella, which is commonly observed in people who eat a lot of vegetable fiber, increased in participants 2-W, 3-W, and 4-W after the dietary control. On the other hand, in participant 2-H, it decr- eased. Overall, the Prevotella group showed an increase from 13.57%
to 18.90%, but there was no statistical significance because of indi- vidual differences. Participants 1-H, 1-W, 3-H, and 4-W saw an in- crease in Bacteroides, which are known to be common in people who consume a lot of meat.
Species level
Each sample shows a unique distribution of various species. Clos
tridium tertium, which accounted for 85.4% in sample 4-W (bef), was not detected at all in sample 4-W (aft). C. tertium is an oppor- tunistic infectious microorganism that can cause bacteremia, men- ingitis, pyogenic arthritis, gastroenteritis, and pneumonia. In sam- ple 4-W (aft), the AJ315483_s strain, which belongs to the genus Prevotella, was the dominant strain.
On the other hand, in participant 3-H, Escherichia coli accounted for 28.3% of the microbiota before the dietary intervention and was only about 0.05% after the intervention. In contrast, Alistipes shahii, a Bacteroidetes bacterium, showed a dominance of 29.9%. In addition, the distribution of Lactobacillus, which is known to be beneficial, increased from 0.17% to 0.32% after dietary control. The distribution of the Clostridium and Escherichia groups, which are known to be harmful, decreased from 12.9% to 0.4% and from 3.6%
to 0.05%, respectively.
Figure 1. Microbial profiling chart. The size of the circles indicates the relative abundance of each family in the samples, and the colors indicate the phylum. Each couple is numbered, using H and W to indicate husband and wife, respectively. bef, before the intervention; aft, after the intervention.
Family level
Phylum level Others
Bacteria_unclassified Mollicutes_unclassified Mollicutes_RF9_unclassified Enterobacteriaceae Succinivibrionaceae Coriobacteriaceae Bifidobacteriaceae Veillonellaceae Erysipelotrichaceae Ruminococcaceae Peptostreptococcaceae Lachnospiraceae Clostridiales_unclassified Clostridiaceae_1 Christensenellaceae Lactobacillaceae Rikenellaceae Prevotellaceae Porphyromonadaceae Bacteroidales_unclassified Bacteroidaceae
1-H (bef)
Bacteroidetes Firmicutes Actinobacteria Proteobacteria Tenericutes Others
1-H (aft) 1-W
(bef) 1-W (aft) 2-H
(bef) 2-H (aft) 2-W
(bef) 2-W (aft) 3-H
(bef) 3-H (aft) 3-W
(bef) 3-W (aft) 4-H
(bef) 4-H (aft) 4-W
(bef) 4-W (aft)