Effect of Bicarbonate Supplementation on Renal Function and Nutritional Indices in Predialysis Advanced Chronic Kidney Disease
Jiwon Jeong, M.D., Soon Kil Kwon, M.D. and Hye-Young Kim, M.D.
Department of Internal Medicine, Chungbuk National University College of Medicine, Cheongju, Korea
Current practice guidelines recommend alkali therapy in patients with chronic kidney disease (CKD) and metabolic acidosis to prevent complications. This study aims to investigate the effect of oral sodium bicarbonate supplementation on the progression of renal function and nutritional indices in patients with pre- dialysis advanced CKD. Forty patients with predialysis stage 5 CKD (estimated glomerular filtration rate, eGFR <15 mL/min per 1.73 m2) and 40 patients with stage 4 CKD (eGFR 15 to 30 mL/min per 1.73 m2) who had a total CO2 less than 22 mEq/L were assigned into the bicarbonate treatment group or control group for 12 months. In stage 4 CKD, there were significant differences in the changes of eGFR during the study between the treatment group and the control group (-2.30±4.49 versus -6.58±6.32 mL/min/1.73 m2, p<0.05). However, in stage 5 CKD, there were no significant differences in the change of eGFR during the study between the two groups (-2.10±2.06 versus -3.23±1.95 mL/min/1.73 m2).There were no significant differences in the changes of nutritional indices such as albumin, prealbumin, transferrin, total lymphocyte count (TLC), and Ondodera’s prognostic nutritional index (OPNI) during the study between the two groups. In stage 5 CKD, there were significant differences in the changes of TLC and OPNI between the two groups.
In conclusion, our results demonstrate that bicarbonate supplementation slows the rate of decline of renal function in stage 4 CKD and improves nutritional indices in stage 5 CKD. Alkali therapy in advanced CKD may have beneficial effect on renal function and malnutrition.
Key Words: Chronic kidney disease, Acidosis, Bicarbonate, Nutrition assessment Received: December 9, 2014
Accepted: December 19, 2014
Corresponding Author: Hye-Young Kim, M.D., Ph.D.
Department of Internal Medicine, Chungbuk National University College of Medicine, 52 Naesudong-ro, Seowon-gu, Cheongju 362-763, Korea
Tel: +82-43-269-6017, Fax: +82-43-273-3252 E-mail: [email protected]
This is an Open Access article distributed under the terms of the Creative Commons Attribution Non-Commercial License(http://creativecommons.org/licenses/by-nc/3.0/) which permits unrestricted non-commercial use, distribution, and reproduction in any medium, provided the original work is properly cited.
Introduction
Chronic metabolic acidosis is a common complication of advanced chronic kidney disease (CKD), especially among patients with an estimated glomerular filtration rate (eGFR) lower than 25 mL/min/1.73 m2 1). It can have substantial adverse effects, including exacerbation of bone disease, increase of muscle degradation with muscle wast- ing, reduction of albumin synthesis, and possible accelera- tion of the progression of CKD2).
Current practice guidelines recommend correcting the serum bicarbonate to greater than 22 mEq/L to prevent potential adverse effects related to chronic metabolic acidosis in CKD3). However, clinicians may be reluctant to prescribe the oral bicarbonate in advanced CKD pa- tients with edema or uncontrolled hypertension. Although alkali therapy in CKD has been examined in some clinical trials4-9), information for the impact of bicarbonate supple- mentation in advanced CKD patients who have a high risk of severe malnutrition and edema is very limited.
We investigated the effect of oral bicarbonate supple-
mentation on renal function and nutritional indices in predialysis advanced CKD patients.We compared the ef- fect of bicarbonate supplementation in patients with stage 4 and predialysis stage 5 CKD.
Methods
Forty patients with stage 5 CKD not receiving renal replacement therapy (eGFR <15 mL/min per 1.73 m2) and 40 patients with stage 4 CKD (eGFR 15 to 30 mL/min per 1.73 m2) who had total CO2 less than 22 mEq/L were enrolled from outpatient clinics of Chungbuk National University Hospital. Patients were assigned to receive either oral sodium bicarbonate in the treatment group or standard care without alkali in the control group for 12 months. In the 40 patients with alkali treatment group, the dosage of sodium bicarbonate (Tasna®, HCO3 5.95 mEq/500 mg) were started 1,000 mg thrice daily and then were adjusted as necessary to maintain total CO2 level greater than 22 mEq/L. We excluded patients with malig- nant disease, liver cirrhosis, infection, sepsis, and overt congestive heart failure. This study was approved by the Institutional Review Board of Chungbuk National Univer- sity Hospital. Blood pressure, body weight, serum elec- trolyte, total CO2, creatinine, BUN, eGFR, calcium, phos- phorous, intact PTH were assessed at baseline and 12 month of the study. The eGFR was calculated by the Modification of Diet in Renal Disease formula: eGFR (mL/min/1.73m2)=186×(serum creatinine)-1.154×(Age)-0.203× 0.742 (female).
Nutritional indices were assessed body mass index (BMI), mid-arm muscle circumference (MAMC), prealbumin, al- bumin, transferrin, total lymphocyte count (TLC), and Onodera’s prognostic nutritional index (OPNI) at baseline and 12 month of study. BMI was derived using weight and height. MAMC was derived from the Bishop10) for- mula using mid-arm circumference (MAC) and triceps skin-fold thickness (TSF):MAMC (cm)=MAC (cm)-TSF (mm)×0.314. TLC was calculated by multiplying the per- centage of lymphocytes with the total white blood cell count. The OPNI was calculated based on the serum albu-
min and total lymphocyte count, using the following equation: OPNI=10×serum albumin (g/dL)+0.005×total lymphocyte count (/mm3)11).
SigmaPlot 12.0 for windows software was used for all statistical analysis (Systat Software Inc, San Jose, CA, USA).
Values are expressed as mean±SD. The comparisons be- tween baseline and 12 month were assessed by paired t-test, and comparisons between groups were assessed by unpaired t-test or Wilcox singed-rank test. A p-value of less than 0.05 was considered statistically significant.
Results
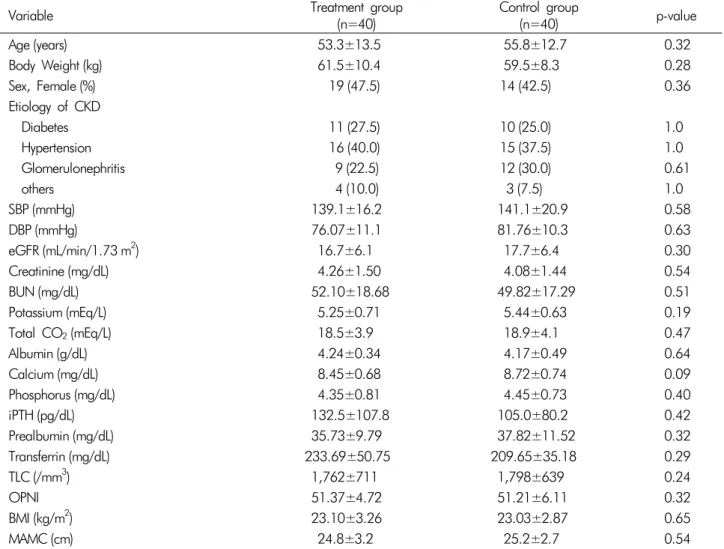
1. Patient characteristicsThe baseline demographic, laboratory, and nutritional datas of the study group are shown in Table 1. There were no significant differences in age, body weight, gender, pri- mary causes of CKD and blood pressure. There were no significant differences in baseline eGFR, creatinine, BUN, potassium, total CO2, albumin, calcium, phosphorus, in- tact PTH, prealbumin, transferrin, TLC, OPNI, BMI, and MAMC in the two groups.
2. Effect of oral bicarbonate supplementation on renal function
Of the 80 patients enrolled, 37 patients in the treat- ment group and 36 patients in the control group com- pleted the study. In only stage 5 CKD, 3 patients in the treatment group and 4 patients in the control group drop- ped out because of progression to dialysis.
The mean dosage of oral sodium bicarbonate supple- mentation in the treatment group was 0.58±0.42 mEq/kg.
After alkali treatment, serum total CO2 level was increased in stage 5 and stage 4 CKD (p<0.05, Table 2). However, in the control group, serum total CO2 level was decreased in stage 5 and stage 4 CKD(p<0.05, Table 2). There was significant difference in changes of total CO2 level in the treatment group compared with the control group during the study period (p<0.05, Table 3, Fig. 1).
There was a significant decrease in eGFR between
Table 1. Baseline demographic, laboratory and nutritional data of the study population
Variable Treatment group
(n=40) Control group
(n=40) p-value
Age (years) 53.3±13.5 55.8±12.7 0.32
Body Weight (kg) 61.5±10.4 59.5±8.3 0.28
Sex, Female (%) 19 (47.5) 14 (42.5) 0.36
Etiology of CKD
Diabetes 11 (27.5) 10 (25.0) 1.0
Hypertension 16 (40.0) 15 (37.5) 1.0
Glomerulonephritis 9 (22.5) 12 (30.0) 0.61
others 4 (10.0) 3 (7.5) 1.0
SBP (mmHg) 139.1±16.2 141.1±20.9 0.58
DBP (mmHg) 76.07±11.1 81.76±10.3 0.63
eGFR (mL/min/1.73 m2) 16.7±6.1 17.7±6.4 0.30
Creatinine (mg/dL) 4.26±1.50 4.08±1.44 0.54
BUN (mg/dL) 52.10±18.68 49.82±17.29 0.51
Potassium (mEq/L) 5.25±0.71 5.44±0.63 0.19
Total CO2(mEq/L) 18.5±3.9 18.9±4.1 0.47
Albumin (g/dL) 4.24±0.34 4.17±0.49 0.64
Calcium (mg/dL) 8.45±0.68 8.72±0.74 0.09
Phosphorus (mg/dL) 4.35±0.81 4.45±0.73 0.40
iPTH (pg/dL) 132.5±107.8 105.0±80.2 0.42
Prealbumin (mg/dL) 35.73±9.79 37.82±11.52 0.32
Transferrin (mg/dL) 233.69±50.75 209.65±35.18 0.29
TLC (/mm3) 1,762±711 1,798±639 0.24
OPNI 51.37±4.72 51.21±6.11 0.32
BMI (kg/m2) 23.10±3.26 23.03±2.87 0.65
MAMC (cm) 24.8±3.2 25.2±2.7 0.54
Data expressed as mean±SD. SBP: Systolic blood pressure, DBP: Diastolic blood pressure, eGFR: Estimated glomerular filtration rate, BUN: Blood urea nitrogen, iPTH: Intact parathyroid hormone, TLC: Total lymphocyte count, OPNI: Onodera’s prognostic nutritional index, BMI: Body mass index, MAMC: Mid-arm muscle circumference
Fig. 1. Changes of Total CO2 during the Study Period. (A) The change of total CO2 in stage 5 CKD. (B) The change of total CO2 in stage 4 CKD. There was significant difference in changes of total CO2 level in the treatment group (solid line) compared with the control group (dotted line) during study period. T: Treatment group with oral sodium bicarbonate, C: Control group,
*:p<0.05 vs Control group.
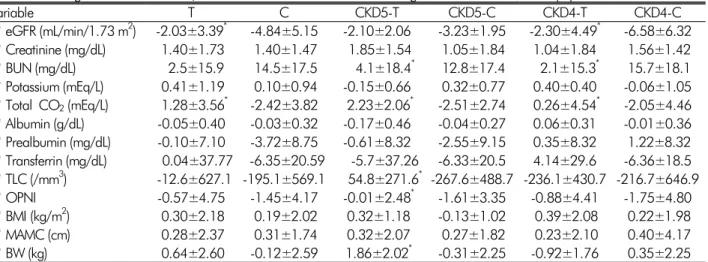
Table 3. Changes of renal function, acidosis and nutritional indices during the 12 months follow-up period
variable T C CKD5-T CKD5-C CKD4-T CKD4-C
ΔeGFR (mL/min/1.73 m2) -2.03±3.39* -4.84±5.15 -2.10±2.06 -3.23±1.95 -2.30±4.49* -6.58±6.32 ΔCreatinine (mg/dL) 1.40±1.73 1.40±1.47 1.85±1.54 1.05±1.84 1.04±1.84 1.56±1.42 ΔBUN (mg/dL) 2.5±15.9 14.5±17.5 4.1±18.4* 12.8±17.4 2.1±15.3* 15.7±18.1 ΔPotassium (mEq/L) 0.41±1.19 0.10±0.94 -0.15±0.66 0.32±0.77 0.40±0.40 -0.06±1.05 ΔTotal CO2(mEq/L) 1.28±3.56* -2.42±3.82 2.23±2.06* -2.51±2.74 0.26±4.54* -2.05±4.46 ΔAlbumin (g/dL) -0.05±0.40 -0.03±0.32 -0.17±0.46 -0.04±0.27 0.06±0.31 -0.01±0.36 ΔPrealbumin (mg/dL) -0.10±7.10 -3.72±8.75 -0.61±8.32 -2.55±9.15 0.35±8.32 1.22±8.32 ΔTransferrin (mg/dL) 0.04±37.77 -6.35±20.59 -5.7±37.26 -6.33±20.5 4.14±29.6 -6.36±18.5 ΔTLC (/mm3) -12.6±627.1 -195.1±569.1 54.8±271.6* -267.6±488.7 -236.1±430.7 -216.7±646.9 ΔOPNI -0.57±4.75 -1.45±4.17 -0.01±2.48* -1.61±3.35 -0.88±4.41 -1.75±4.80 ΔBMI (kg/m2) 0.30±2.18 0.19±2.02 0.32±1.18 -0.13±1.02 0.39±2.08 0.22±1.98
ΔMAMC (cm) 0.28±2.37 0.31±1.74 0.32±2.07 0.27±1.82 0.23±2.10 0.40±4.17
ΔBW (kg) 0.64±2.60 -0.12±2.59 1.86±2.02* -0.31±2.25 -0.92±1.76 0.35±2.25 Datas expressed as mean±SD. T: Treatment group with oral sodium bicarbonate, C: Control group, CKD5: Stage 5 chronic kidney disease, CKD4: Stage 4 chronic kidney disease, Δ: Difference between the baseline value and value at 12 month of study eGFR: Estimated glomerular filtration rate, BUN: Blood urea nitrogen, TLC: Total lymphocyte count, OPNI: Onodera’s prognostic nutritional index, BMI: Body mass index, MAMC: Mid-arm muscle circumference, BW: Body weight, *:p<0.05 vs Control group.
Table 2. Renal function, acidosis and nutritional indices at baseline and at the 12 months follow-up
Variable CKD5-T CKD5-C CKD4-T CKD4-C
Baseline
(n=20) 12 Months
(n=17) Baseline
(n=20) 12 Months
(n=16) Baseline
(n=20) 12 Months
(n=20) Baseline
(n=20) 12 Months (n=20) eGFR (mL/min/1.73 m2) 11.3±2.8 9.3±3.1* 12.3±2.1 9.1±2.3* 20.9±4.3 18.7±7.7* 23.2±4.9 16.7±7.9* Creatinine (mg/dL) 5.51±1.01 7.37±2.22* 5.58±0.93 6.77±1.78* 3.58±0.77 4.62±2.06* 3.17±0.54 4.74±1.64* BUN (mg/dL) 62.3±18.3 66.4±17.0 66.9±9.9 79.8±19.6 46.3±16.0 47.3±24.3 38.6±10.5 54.5±17.5* Potassium (mEq/L) 5.37±0.75 5.26±0.66 5.50±0.48 5.82±0.61 5.13±0.69 5.53±0.57 5.48±0.72 5.42±0.94 Total CO2(mEq/L) 17.6±0.9 20.3±2.8* 18.6±3.4 15.5±2.8* 18.9±3.0 21.3±4.4* 19.7±2.2 18.3±4.5* Ca (mg/dL) 8.45±0.68 8.23±0.92 8.37±0.85 7.96±1.29 8.62±0.42 8.58±0.67 8.86±0.52 8.37±1.58 P (mg/dL) 4.41±0.81 5.09±1.64 4.66±0.92 5.20±1.44 4.22±0.89 4.31±0.86 4.36±0.49 4.55±0.83 Albumin (g/dL) 4.19±0.34 4.01±0.55 4.29±0.40 4.25±0.28 4.18±0.39 4.24±0.45 4.13±0.53 4.11±0.60 Prealbumin (mg/dL) 35.7±9.7 35.0±8.4 36.1±18.2 33.2±10.2 34.3±10.1 35.7±8.9 35.3±9.8 33.5±12.4 Transferrin (mg/dL) 214.0±23.0 208.3±39.4 193.2±59.1 173.1±44.7 228.6±35.7 232.7±34.8 208.8±23.0 202.4±23.0 TLC (/mm3) 1,356±711 1,414±671.6 1,510±639 1,242±580* 2,405±639 2,169±580 1,932±690 1,715±575 OPNI 49.6±4.7 48.7±5.5 51.3±6.1 48.5±4.6* 53.4±6.1 53.6±5.9 51.8±6.8 50.1±6.4 BMI (kg/m2) 23.1±3.2 24.3±3.2 23.0±2.8 22.9±3.1 23.3±2.7 22.6±3.5 24.0±2.8 22.7±3.1 MAMC (cm) 24.8±3.2 25.1±4.2 25.2±2.7 24.7±3.5 25.5±3.5 25.4±5.2 25.7±4.5 25.4±3.2 BW (kg) 59.8±3.2 61.9±4.2* 60.1±2.7 59.3±3.5 64.0±3.5 63.1±5.2 59.3±7.5 59.8±8.4 Datas expressed as mean±SD. T: Treatment group with oral sodium bicarbonate, C: control group, CKD5: Stage 5 chronic kidney disease, CKD4: Stage 4 chronic kidney disease, eGFR: Estimated glomerular filtration rate, BUN: Blood urea nitrogen, TLC: Total lymphocyte count, OPNI: Onodera’s prognostic nutritional index, BMI: Body mass index, MAMC: Mid-arm muscle circumference, BW: Body weight, *p<0.05 vs Baseline
baseline and 12 months in both the treatment and control groups (p<0.05, Table 2). The changes of eGFR in the treatment groups during the study period was sig- nificantly lower than in the control group (-2.03±3.39
mL/min/1.73 m2 in the treatment group vs. -4.84±5.15 mL/min/1.73 m2 in the control group, p<0.05, Table 3).
In stage 4 CKD, there was a significant difference in the changes of eGFR during the study between the treatment
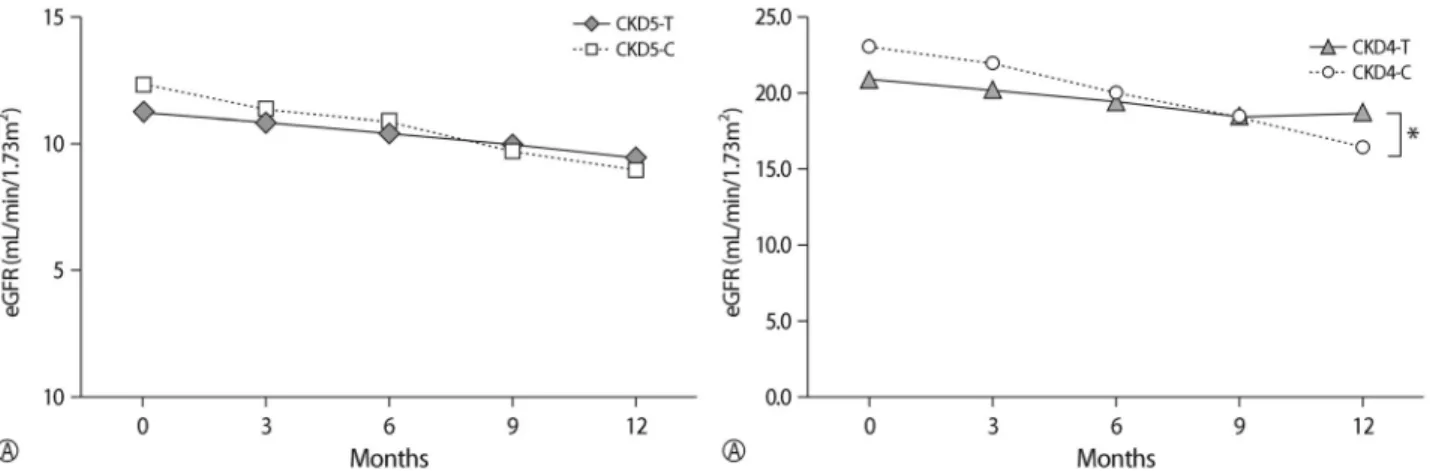
Fig. 2. Changes of Renal Function during the Study Period. (A) The decline of eGFR was similar between the treatment group and control group in stage 5 CKD. (B)The decline of eGFR was significantly lower in the treatment group (solid line) compared with control group (dotted line) in stage 4 CKD. T: Treatment group with oral sodium bicarbonate, C: Control group, *:p<0.05 vs Control group.
group and the control group (-2.30±4.49 mL/min/1.73 m2 in the treatment group vs. -6.58±6.32 mL/min/1.73 m2 in control group, p<0.05, Table 3, Fig. 2). However, in stage 5 CKD, there was no statistically significant differ- ence in the change of eGFR during the study between the treatment group and the control group (Table 3, Fig.
2). There were no differences in changes of creatinine, BUN, potassium level in the treatment group compared with the control group during the study period. During the study period, serum calcium, phosphorous, intact PHT levels were similar between the treatment group and the control group (Table 3).
3. Effect of oral bicarbonate supplementation on nutritional indices
There were no significant differences in albumin, prea- blumin, transferrin, BMI, and MAMC between baseline and 12 months in both treatment and control groups (Table 2). However, there was a significant decrease in TLC and OPNI between baseline and 12 months in the control group of stage 5 CKD (p<0.05, Table 2).
There was no significant difference in the changes of albumin, prealbumin, transferrin, TLC, OPNI during the study period between the treatment group and control group. The decline of TLC in the treatment group was lower than in the control group during the study period,
which was not statistically significant (-12.6±627.1/mm3 in the treatment group vs. -195.6±569.1/mm3 in the con- trol group, p=0.07, Table 3). In stage 5 CKD, there was a significant difference in the changes of TLC and OPNI during the study between the treatment group and control group (p<0.05, Table 3). However, in stage 4 CKD, there was no statistically significant difference in the change of TLC and OPNI during the study between the treat- ment group and control group (Table 3).
4. The adverse events during the study period Mean body weight was significantly increased after 12 months in the treatment group of stage 5 CKD (p<0.05, Table 2). There was no significant difference in the changes of body weight during study period between the treat- ment group and control group (Table 3). In stage 4 CKD, there was no statistically significant difference in the change of body weight during the study between the treatment group and control group. However, in stage 5 CKD, there was a significant difference in the changes of body weight during the study between the treatment group and control group (p<0.05, Table 3).
There was no significant difference in the changes of systolic and diastolic blood pressure during the study be- tween the treatment group and control group (3.4±16.3/
0.7±11.5 mmHg in the treatment group vs. -2.1±22.3/
-1.8±12.3 mmHg in the control group). There was no difference in the number and types of antihypertensive medications during the study between the two groups.
All patients in stage 5 CKD was received loop diuretics at the end of the study. Loop diuretic use increased sim- ilarly by 75 and 82 % in the control and treatment group, respectively. Three patients in the treatment group and 4 patients in the control group required dialysis during the study period.
Discussion
Overt chronic metabolic acidosis in CKD patients de- velops after a drop in GFR to less than approximately 25 mL/min/1.73 m2 1). The National Kidney Foundation Kidney Disease Outcomes Quality Initiative guidelines re- commend correcting the serum bicarbonate to greater than 22 mEq/L to prevent potential adverse effects related to chronic metabolic acidosis, including bone disease, pro- gression of CKD and malnutrition1,3). Although alkali ther- apy in CKD has been examined in some clinical trials4-9), information on the effects of bicarbonate supplementa- tion in advanced CKD patients who have a high risk of severe malnutrition, uncontrolled hypertension and edema is very limited.
In a randomized, prospective study, de Brito-Ashurst et al.5) suggested that sodium bicarbonate slowed the rate of creatinine clearance decline from 5.93 to 1.88 mL/min per 1.73 m2/year in patients with stage 4 CKD. Phisitkul et al.12) noted sodium citrate slowed the rate of decrease in eGFR in patients with hypertensive nephropathy with eGFR of 20 to 60 mL/min/1.73 m2.
We compared the effects of oral bicarbonate supple- mentation on the progression of CKD and nutritional indices in predialysis stage 5 and stage 4 CKD. This study demonstrated that oral bicarbonate supplementation slowed the rate of decline of eGFR in stage 4 CKD.
However, rate of decline of eGFR was similar between the treatment group and control group in stage 5 CKD.
In this study, the annual decline of eGFR in stage 4 CKD is similar to the previously reported study5,12).
Malnutrition is a potential consequence of chronic me- tabolic acidosis13). In advanced CKD, treatment of severe acidosis has produced improvements in anthropometric measures of lean body mass in some but not all reports14-17). Several small, short-term clinical trials, mainly of dialysis patients, suggested that correction of acidosis is associated with increased serum albumin and improved nutritional status18). Uremic acidosis can increase skeletal muscle breakdown and diminish albumin synthesis, leading to muscle wasting and muscle weakness1,13). The catabolic state appears to be mediated by acidosis, acting in part by the increased release of cortisol and diminished release of insulin-like growth factor-I, leading to the loss of lean body mass and muscle weakness19). These abnormalities in muscle function and/or albumin metabolism can be reversed by alkali therapy to correct the acidosis, inclu- ding optimal correction of acidosis in patients undergoing chronic dialysis16-18).
We were unable to demonstrate the beneficial effect of alkali therapy on serum albumin, and mid-arm muscle circumference in contrast to the previous studies5). How- ever, in this study, there were significant differences in the changes of TLC and OPNI during the study period between the treatment group and control group in stage 5 CKD, but not stage 4 CKD. Our study demonstrated that oral sodium bicarbonate supplementation for 12 months might improve the biochemical nutritional in- dices in stage 5 CKD.
TLC has been proposed as a prognostic factor20). Malnutrition can induce a decrease in TLC and sup- pression of cellular immunity including delayed hyper- sensitivity reaction21). Reddan et al.22) showed that the lymphocyte count was associated with the nutritional sta- tus and mortality in dialysis patients. Onodera et al.11) first reported the validity of the OPNI to predict the prognosis in gastrointestinal surgical patients.
In advanced CKD, the anticipated adverse effects of sodium bicarbonate supplementation were worsening hy- pertension and edema as a result of sodium retention.
The adverse event of both groups were similar. In this study, after sodium bicarbonate supplementation, there
was a tendency of weight gain and increased blood pres- sure in stage 5 CKD.
In meta-analysis, the sodium bicarbonate administered in the long-term trials had no adverse effect on blood pressure or cardiac function23). Although alkali therapy is well tolerated in advanced CKD, potential complica- tions of sodium bicarbonate, such as volume overload and worsened hypertension, need to be monitored care- fully in stage 5 CKD.
This study has several strengths. To the best of our knowledge, the study is the first to examine the effect of bicarbonate supplementation in stage 5 CKD patients not on dialysis. In addition, various biochemical nutri- tional indices such as prealbumin, transferrin, TLC, and OPNI as well as albumin were used for assessment of nu- tritional status. Despite the strengths, there are limitations to this study. The small number of subjects in a single center study was not enough to compare the differences between groups. The serum total CO2 level did not reach greater than 22 mEq/L during bicarbonate treatment.
Conclusion
Our results demonstrate that bicarbonate supplementa- tion in advanced CKD with metabolic acidosis slows the rate of decline of renal function only in stage 4 CKD, but not stage 5 CKD. In addition, bicarbonate supplementation may have a beneficial effect on malnutrition in stage 5 CKD, but not stage 4 CKD. Alkali therapy in advanced CKD may have a beneficial effect on renal function and malnutrition, which may differ depending on the stage of CKD.
Acknowledgement
The paper was supported by the research grant of Chungbuk National University in 2012.
Reference
1. Kraut JA, Kurtz I: Metabolic acidosis of CKD: diagnosis, clinical characteristics, and treatment. Am J Kidney Dis 45:978-993, 2005
2. Mitch WE: Influence of metabolic acidosis on nutrition.
Am J Kidney Dis 29:xlvi-xlviii, 1997
3. Clinical practice guidelines for nutrition in chronic renal failure. K/DOQI, National Kidney Foundation. Am J Kidney Dis 35:S1-140, 2000
4. Abramowitz MK, Melamed ML, Bauer C, Raff AC, Hostetter TH: Effects of oral sodium bicarbonate in pa- tients with CKD. Clin J Am Soc Nephrol 8:714-720, 2013 5. de Brito-Ashurst I, Varagunam M, Raftery MJ, Yaqoob
MM: Bicarbonate supplementation slows progression of CKD and improves nutritional status. J Am Soc Nephrol 20:2075-2084, 2009
6. Disthabanchong S,Treeruttanawanich A: Oral sodium bi- carbonate improves thyroid function in predialysis chron- ic kidney disease. Am J Nephrol 32:549-556, 2010 7. Gaggl M, Cejka D, Plischke M, et al.: Effect of oral so-
dium bicarbonate supplementation on progression of chronic kidney disease in patients with chronic metabolic acidosis: study protocol for a randomized controlled trial (SoBic-Study). Trials 14:196, 2013
8. Goraya N, Simoni J, Jo CH, Wesson DE: A comparison of treating metabolic acidosis in CKD stage 4 hypertensive kidney disease with fruits and vegetables or sodium bicar- bonate. Clin J Am Soc Nephrol 8:371-38, 2013 9. Mathur RP, Dash SC, Gupta N, Prakash S, Saxena S,
Bhowmik D: Effects of correction of metabolic acidosis on blood urea and bone metabolism in patients with mild to moderate chronic kidney disease: a prospective ran- domized single blind controlled trial. Ren Fail 28:1-5, 2006
10. Bishop CW, Bowen PE, Ritchey SJ: Norms for nutri- tional assessment of American adults by upper arm anthropometry. Am J Clin Nutr 34:2530-2539, 1981 11. Onodera T, Goseki N, Kosaki G: [Prognostic nutritional
index in gastrointestinal surgery of malnourished cancer patients]. Nihon Geka Gakkai Zasshi 85:1001-1005, 1984
12. Phisitkul S, Hacker C, Simoni J, Tran RM,Wesson DE:
Dietary protein causes a decline in the glomerular filtra- tion rate of the remnant kidney mediated by metabolic acidosis and endothelin receptors. Kidney Int 73:192-199, 2008
13. Kraut JA, Madias NE: Consequences and therapy of the metabolic acidosis of chronic kidney disease. Pediatr Nephrol 26:19-28, 2011
14. Bossola M, Giungi S, Tazza L,Luciani G: Long-term oral sodium bicarbonate supplementation does not improve serum albumin levels in hemodialysis patients. Nephron
Clin Pract 106:c51-56, 2007
15. Brady JP, Hasbargen JA: Correction of metabolic acidosis and its effect on albumin in chronic hemodialysis patients.
Am J Kidney Dis 31:35-40, 1998
16. Stein A, Moorhouse J, Iles-Smith H, et al.: Role of an improvement in acid-base status and nutrition in CAPD patients. Kidney Int 52:1089-1095, 1997
17. Szeto CC, Wong TY, Chow KM, Leung CB, Li PK: Oral sodium bicarbonate for the treatment of metabolic aci- dosis in peritoneal dialysis patients: a randomized place- bo-control trial. J Am Soc Nephrol 14:2119-2126, 2003 18. Movilli E, Viola BF, Camerini C, Mazzola G, Cancarini
GC: Correction of metabolic acidosis on serum albumin and protein catabolism in hemodialysis patients. J Ren Nutr 19:172-177, 2009
19. Yaqoob MM: Treatment of acidosis in CKD. Clin J Am Soc Nephrol 8:342-343, 2013
20. Omran ML, Morley JE: Assessment of protein energy malnutrition in older persons, Part II: Laboratory evalu- ation. Nutrition 16:131-140, 2000
21. Bistrian BR, Blackburn GL, Scrimshaw NS, Flatt JP:
Cellular immunity in semistarved states in hospitalized adults. Am J Clin Nutr 28:1148-1155, 1975
22. Reddan DN, Klassen PS, Szczech LA, et al.: White blood cells as a novel mortality predictor in haemodialysis patients. Nephrol Dial Transplant 18:1167-1173, 2003 23. Susantitaphong P, Sewaralthahab K, Balk EM, Jaber BL,
Madias NE: Short- and long-term effects of alkali ther- apy in chronic kidney disease: a systematic review. Am J Nephrol 35:540-547, 2012