D I A B E T E S & M E T A B O L I S M J O U R N A L
This is an Open Access article distributed under the terms of the Creative Commons At- tribution Non-Commercial License (http://creativecommons.org/licenses/by-nc/3.0/) which permits unrestricted non-commercial use, distribution, and reproduction in any medium, provided the original work is properly cited.
Risk Factors for the Progression of Intima-Media Thickness of Carotid Arteries: A 2-Year Follow-Up Study in Patients with Newly Diagnosed Type 2 Diabetes
Sang Ouk Chin1, Jin Kyung Hwang1, Sang Youl Rhee1, Suk Chon1, You-Cheol Hwang1, Seungjoon Oh1, Kyu Jeung Ahn1, Ho Yeon Chung1, Jeong-taek Woo1, Sung-Woon Kim1, Young Seol Kim1, Ja-Heon Kang2, In-Kyung Jeong1
1Department of Endocrinology and Metabolism, 2Department of Ophthalmology, Kyung Hee University School of Medicine, Seoul, Korea
Background: Intima-media thickness (IMT) of the carotid arteries is known to have a positive correlation with the risk of car- diovascular disease. This study was designed to identify risk factors affecting the progression of carotid IMT in patients with type 2 diabetes mellitus (T2DM).
Methods: Patients with newly diagnosed T2DM with carotid IMT measurements were enrolled, and their clinical data and ca- rotid IMT results at baseline and 2 years later were compared.
Results: Of the 171 patients, 67.2% of males and 50.8% of females had abnormal baseline IMT of the left common carotid artery.
At baseline, systolic blood pressure, body mass index and smoking in male participants, and fasting plasma glucose and glycated hemoglobin levels in females were significantly higher in patients with abnormal IMT than in those with normal IMT. Low den- sity lipoprotein cholesterol (LDL-C) levels in males and high density lipoprotein cholesterol (HDL-C) levels in females at the 2-year follow-up were significantly different between the nonprogression and the progression groups. Reduction of the United Kingdom Prospective Diabetes Study (UKPDS) 10-year coronary heart disease (CHD) risk score after 2 years was generally higher in the nonprogression group than the progression group.
Conclusion: LDL-C levels in males and HDL-C levels in females at the 2-year follow-up were significantly different between participants with and without progression of carotid IMT. Furthermore, a reduction in the UKPDS 10-year CHD risk score ap- peared to delay the advancement of atherosclerosis. Therefore, the importance of establishing the therapeutic goal of lipid pro- files should be emphasized to prevent the progression of carotid IMT in newly diagnosed T2DM patients.
Keywords: Atherosclerosis; Carotid artery intima-media thickness; Diabetes mellitus, type 2; Risk factors
Corresponding authors:
In-Kyung Jeong
Department of Endocrinology and Metabolism, Kyung Hee University Hospital at Gangdong, Kyung Hee University School of Medicine, 892 Dongnam-ro, Gangdong-gu, Seoul 134-727, Korea
E-mail: [email protected] Ja-Heon Kang
Department of Ophthalmology, Kyung Hee University Hospital at Gangdong, Kyung Hee University School of Medicine, 892 Dongnam-ro, Gangdong-gu, Seoul 134-727, Korea
INTRODUCTION
The incidence and complications of type 2 diabetes mellitus
(T2DM) continue to increase rapidly [1]. Insulin resistance and hyperglycemia exacerbate macrovascular complications in diabetic patients when compared with nondiabetic patients.
http://dx.doi.org/10.4093/dmj.2013.37.5.365 pISSN 2233-6079 · eISSN 2233-6087
The disequilibrium between increases in toxic metabolites (e.g., advanced glycation end-products, protein kinase C activation, and oxidative stress) and decreases in protective endogenous factors (e.g., insulin, vascular endothelial growth factor, plate- let-derived growth factors, and adiponectin) may play a role in the development of diabetic complications [2], which raises the likelihood of cardiovascular disease (CVD), such as myocardial infarction and stroke [3].
Early diagnosis and treatment of atherosclerosis are neces- sary to prevent serious diabetic complications. Many diagnos- tic tools, including myocardial scans, computed tomography, and magnetic resonance imaging, are used for early detection of atherosclerosis, but their applications are currently limited due to their high costs and low accuracy [4]. In contrast, the intima-media thickness (IMT) of the carotid arteries as mea- sured by noninvasive method using B-mode ultrasound is known to be a useful marker of atherosclerosis and has been reported to be significantly correlated with the actual carotid IMT as determined by histologic examination [5,6]. Further- more, previous studies identified a positive correlation be- tween carotid IMT and risk of CVD [7-9].
The Insulin Resistance Atherosclerosis Study reported that carotid IMT did not significantly differ between diabetic and nondiabetic participants at the time of diagnosis, but signifi- cant differences in carotid IMT between these two groups were detectable after several years [10,11]. Diabetes mellitus (DM) duration was one of the factors that impacted this difference in carotid IMT [12], and the rate of increase in carotid IMT was significantly higher in diabetic patients than in nondiabetic participants [13].
However, few studies have investigated the risk factors that aggravate the progression of carotid atherosclerosis among pa- tients with T2DM. This study was designed to determine the risk factors affecting the progression of carotid IMT in Korean patients newly diagnosed with T2DM.
METHODS
Study population
The study population comprised of patients with T2DM that were newly diagnosed between January 2007 and June 2008 at Kyung Hee University Hospital at Gangdong. All participants had initial carotid IMT measurements by ultrasonography at the time of their T2DM diagnosis. Patients with T2DM satis- fied the criteria of the American Diabetic Association (ADA)
[14]. Those with a previous history of CVD and trauma, surgi- cal or radiation therapy at the cervical region, including the carotid artery, were excluded. All participants in this study provided informed consent before the research began.
Carotid IMT measurements
High-resolution B-mode carotid ultrasonography was per- formed at baseline and after a 2-year follow-up period using identical scanning protocols and equipment (Envisor HD11XE;
Koninklijke Philips Electronics, Eindhoven, the Netherlands).
During the ultrasonographic examination, all participants were put in the supine position with their heads straight and their necks extended. Scanning was performed by insonating the vessel in a perpendicular orientation, optimizing the B-mode settings of gain, depth and focal zone placement, and com- pressing to enhance the image quality. The definition of IMT was the distance from the leading edge of the lumen-intima in- terface to the leading edge of the media-adventitia interface of the far wall [15]. A single longitudinal lateral image of the left common carotid artery (CCA) with the regular lumen-intima interface parallel to the adventitia was captured and transferred to a personal computer for automated measurements. IMT measurement was taken using Intimascope software (Media Cross Co., Ltd., Tokyo, Japan) that performs automated IMT measurements based on an algorithm that delineates the lu- men-intima and media adventitia interfaces [16]. Two lines along the boundaries of the IMT that corresponded to the measurement points within the set segment were drawn manu- ally. All of the measurements were made by a single certified sonographer for both years of the study. The present study used the mean IMT value obtained from Intimascope. The defini- tion of a plaque was a focal structure that protruded by at least 0.5 mm into the arterial lumen or that occupied the vascular lumen with its thickness greater than 50% of the surrounding IMT value or greater than 1.5 mm as measured from the me- dia-adventitia interface to the intima-lumen interface [15].
Analyses of clinical parameters
Systolic blood pressure (SBP) and diastolic blood pressure (DBP) were taken in the right arm and recorded as the mean of the two measurements obtained at least 5 minutes apart.
Participants with hypertension included those who had either a SBP greater than 140 mm Hg or a DBP greater than 90 mm Hg. Any participant currently taking antihypertensive medi- cations was also classified as hypertensive. Dyslipidemia was
defined using the following criteria established by the National Cholesterol Education Program Adult Treatment Panel III:
triglyceride (TG) ≥150 mg/dL, low density lipoprotein choles- terol (LDL-C) ≥100 mg/dL or high density lipoprotein choles- terol (HDL-C) ≤40 mg/dL in males and ≤50 mg/dL in fe- males [17]. Those currently taking lipid-lowering medications were also classified as having dyslipidemia. All participants fasted for at least 8 hours before venous sampling. TG was measured by enzymatic colorimetric methods. HDL-C con- centration in the supernatant was determined by an enzymatic colorimetric method after precipitation with dextran sulfate and magnesium chloride. The LDL-C concentration was di- rectly assessed using the β-quantification procedure. Body mass index was calculated by dividing the weight in kilograms by the height in meters squared. The homeostasis model as- sessment-insulin resistance (HOMA-IR) was determined us- ing the following equation: fasting glucose (mg/dL)×fasting insulin (μU/mL)/405 [18]. Cigarette smoking was ascertained by educational nurses during an interview. Diabetic retinopa- thy (DR) was defined when retinal photography revealed non- proliferative DR, proliferative DR (PDR), diabetic macular edema, or any combination thereof [19]. Diabetic nephropa- thy was determined to be when the urinary albumin to creati- nine level was ≥30 mg/g [20]. Diabetic neuropathy was identi- fied when a neuropathy consistent with diabetes was present or nerve conduction studies confirmed its presence [21].
Medical records were thoroughly reviewed to obtain informa- tion regarding the past medication use, including antihyper- tensive, antiplatelet, and lipid-lowering agents.
Calculated risks of the United Kingdom Prospective Diabetes Study risk engine
Risk for coronary heart disease (CHD) was estimated by sub- stituting risk factors such as age, gender, race, current smoking status, glycated hemoglobin (HbA1c), SBP, total cholesterol, HDL-C, and presence or absence of atrial fibrillation into the United Kingdom Prospective Diabetes Study (UKPDS) risk engine calculator, which was provided by the Diabetes Trials Units: The Oxford Centre for Diabetes, Endocrinology and Metabolism (http://www.dtu.ox.ac.uk/riskengine) [22-24].
ΔCHD risk was calculated by subtracting the UKPDS 10-year CHD risk at the 2-year follow-up from that at baseline.
Data and statistical analyses
Baseline characteristics were classified according to gender
and expressed as means and standard deviations. Abnormal carotid IMT was defined when the IMT was higher than the upper limit of the normal range of carotid IMT that was ob- tained from age- and gender-matched data from the Health Promotion Center, Kyung Hee University Hospital. In each age group, 30 participants with no cardiovascular risk factors, such as T2DM, hypertension, dyslipidemia, and smoking his- tory, were randomly selected, and their carotid IMT values were measured to obtain the normal range (Supplementary Table 1). Participants with plaques were also classified as hav- ing an abnormal IMT. Since the Atherosclerosis Risk in Com- munities (ARIC) study reported that the mean carotid IMT increased by 0.007 to 0.01 mm annually [25], the mean carotid IMT should therefore increase by 0.014 to 0.02 mm during the 2-year follow-up period. Based on this assumption, progres- sion of carotid IMT was defined when the left mean carotid IMT at the 2-year follow-up had increased by more than 0.01 mm compared with the baseline. Participants with nonpro- Table 1. Clinical characteristics of the study participants
Characteristic Total
(n=171) Male
(n=110) Female (n=61)
Age, yr 52.5±9.9 50.9±10.1 55.4±8.9
SBP, mm Hg 131.1±15.2 130.8±14.5 131.5±16.6
DBP, mm Hg 81.1±9.9 82.1±9.8 79.5±10.1
FPG, mg/dL 160.5±60.9 170.9±64.4 143.2±50.4
HbA1c, % 8.1±2.2 8.4±2.3 7.5±1.9
TC, mg/dL 193.1±43.5 196.1±44.9 187.5±40.8 TG, mg/dL 187.2±153.6 206.0±165.4 155.8±126.8 HDL-C, mg/dL 45.1±9.3 44.4±9.3 46.3±9.3 LDL-C, mg/dL 114.6±36.8 116.1±38.3 112.1±34.3
BMI, kg/m2 25.4±3.4 25.2±3.1 25.9±3.9
HOMA-IR 4.1±2.3 4.2±2.5 3.9±1.7
HTN 39/171 (22.8) 19/110 (17.3) 20/61 (32.8) Dyslipidemia 149/171 (87.1) 97/110 (88.2) 52/61 (85.2) Microalbuminuria 26/120 (24.2) 18/78 (23.0) 8/42 (19.0) Diabetic retinopathy 6/120 (5.0) 5/78 (6.4) 1/42 (2.3) Diabetic neuropathy 41/120 (34.2) 25/78 (32.1) 16/42 (38.1) Abnormal carotid IMT 105/171 (61.4) 74/110 (67.3) 31/61 (50.8) Values are presented as mean±standard deviation or number (%).
SBP, systolic blood pressure; DBP, diastolic blood pressure; FPG, fast- ing plasma glucose; HbA1c, glycated hemoglobin; TC, total choles- terol; TG, triglyceride; HDL-C, high density lipoprotein cholesterol;
LDL-C, low density lipoprotein cholesterol; BMI, body mass index;
HOMA-IR, homeostasis model assessment-insulin resistance; HTN, hypertension; IMT, intima-media thickness.
gression of carotid IMT included those whose left mean carot- id IMT at the 2-year follow-up examination had decreased by more than 0.01 mm or had remained unchanged. The signifi- cance of differences between groups was assessed using Stu- dent t-test or chi-square tests using PASW version 18.0 (IBM Co., Armonk, NY, USA). A P<0.05 was considered statistically significant.
RESULTS
Clinical characteristics of the study participants
This study enrolled 171 participants (male:female, 110:61), and their mean age was 52.5±9.9 years (males, 50.9±10.1; fe- males, 55.4±8.9) (Table 1). SBP and DBP of both males and females were largely within the target BP recommended in the ADA consensus guidelines [14]. The mean fasting plasma glu- cose (FPG) and HbA1c were 160.5±60.0 mg/dL and 8.1%±
2.2%, respectively; both of these mean values were above the therapeutic target level for T2DM. The mean LDL-C value was also higher than the treatment target for hyperlipidemia in pa- tients with T2DM (114.6±36.8 mg/dL). BMI and incidence of smoking were significantly higher in male participants in the abnormal IMT group than those in the normal IMT group.
The mean HOMA-IR was 4.1±2.3, which demonstrated insu- lin resistance in the study participants. Of the 171 participants, 24.2% had microalbuminuria, and 5.0% and 34.2% had ac- companying DR and neuropathy, respectively. Abnormal base- line IMT of the left CCA was found in 61.4% of the partici- pants, which included 67.2% of males (74/110) and 50.8% of females (31/61). Comparison of baseline and 2-year follow-up values revealed that the mean IMT of male participants was significantly lower at the 2-year follow-up compared to base- line (0.65±0.16 mm vs. 0.61±0.11 mm; P=0.008), whereas the mean IMT of female participants showed a nonsignificant de- crease 2 years after diagnosis (0.65±0.18 mm vs. 0.62±0.17
mm; P=0.107) (Table 2). The number of males with newly ob- served plaques in the left CCA was lower at the 2-year follow- up than at baseline, while this number remained the same in females.
Comparison of participants with and without abnormal baseline carotid IMT
Comparison of the baseline clinical characteristics of males with normal and abnormal baseline mean IMT values revealed that SBP and BMI were significantly higher in those partici- pants with an abnormal baseline IMT (Table 3). In addition, the percentage of males who smoked was significantly higher in the abnormal IMT group than in the normal IMT group.
The same analysis among female participants revealed that FPG and HbA1c were significantly higher in those participants with an abnormal baseline IMT than they were in those with a normal baseline IMT. The UKPDS 10-year CHD risk at base- line did not differ significantly between participants with nor- mal or abnormal IMT values regardless of gender. The number of patients with microalbuminuria, DR, or neuropathy did not differ significantly between participants with normal or abnor- mal baseline IMT regardless of gender.
Comparison between participants with and without progression of carotid IMT
There were 113 participants who underwent follow-up carotid IMT measurements (male:female, 73:40). We assigned these participants with a normal mean IMT at both baseline and the 2-year follow-up period to the nonprogression group, while those with a normal IMT at baseline but an abnormal IMT at 2 years were placed in the progression group (Table 4 for males and Table 5 for females). In both male and female participants, most clinical parameters had improved at the 2-year follow-up period compared with baseline levels. When baseline and fol- low-up levels of all parameters in the nonprogression group Table 2. Comparison of mean intima-media thickness at the left common carotid artery and the number of patients with plaque between baseline and after 2-year follow-up
Mean IMT at left CCA, mm Plaques at left CCA
Baseline After 2 yr P value Baseline After 2 yr P value
Male 0.65±0.16 0.61±0.11 0.008a 10/73 (13.6) 8/73 (10.9) <0.001a
Female 0.65±0.18 0.62±0.17 0.107 8/40 (20.0) 8/40 (20.0) NA
Values are presented as mean±standard deviation or number (%).
CCA, common carotid artery; NA, not available.
aP<0.05.
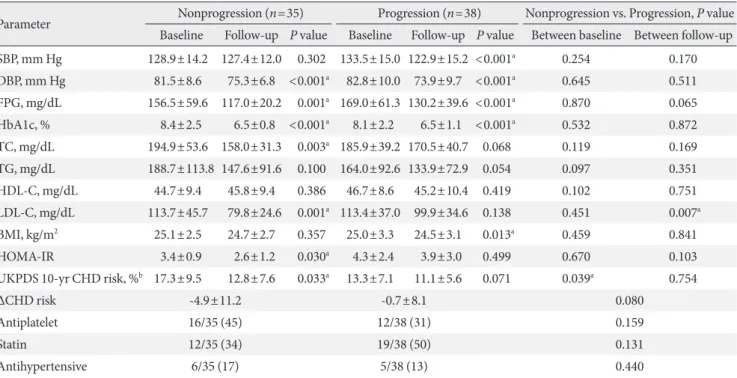
were compared with those in the progression group, the LDL- C level at the 2-year follow-up was significantly higher in males of the progression group than in the nonprogression group (79.79±24.6 mg/dL vs. 99.9±34.6 mg/dL; P=0.007) (Table 4, Fig. 1A). Interestingly, in females, the HDL-C level at the 2-year follow-up was significantly lower in the progression group than in the nonprogression group (53.0±14.9 mg/dL vs. 44.1±12.0 mg/dL; P=0.049) (Table 5, Fig. 1B). In females, the UKPDS 10- year CHD risk at baseline tended to be higher in the nonpro- gression group than the progression group, but the risk reduc- tion after 2 years was significantly higher in the nonprogression group (-2.3±4.7 vs. +1.6±3.6; P=0.005) (Table 5). A similar trend was found in males (-4.9±11.2 vs. -0.7±8.1; P=0.008) (Table 5). The use of medications, such as antiplatelet agents, statins, and antihypertensive agents at the time of diagnosis did
not significantly differ between the progression and nonpro- gression groups of both males and females.
DISCUSSION
The present study demonstrated that LDL-C levels in males and HDL-C levels in females 2 years after the diagnosis of T2DM were significantly different between those participants with and without carotid IMT progression. Furthermore, al- though the UKPDS 10-year CHD risk score at baseline was generally higher in the nonprogression group than the pro- gression group, the risk reduction (ΔCHD risk) of the nonpro- gression group 2 years after diagnosis was also higher than that of the progression group. These results suggested that ac- tive and comprehensive control of LDL-C, HDL-C, glucose Table 3. Comparison of baseline (at the time of diagnosis with type 2 diabetes mellitus) clinical characteristics between groups with normal and abnormal baseline mean intima-media thickness at left common carotid artery
Parameter Male Female
Normal IMT (n=36) Abnormal IMT (n=74) P value Normal IMT (n=30) Abnormal IMT (n=31) P value
Age, yr 51.2±11.1 50.7±9.6 0.812 54.2±9.310 56.6±8.6 0.298
SBP, mm Hg 126.7±12.3 132.8±15.2 0.040a 130.5±14.2 132.6±18.8 0.630
DBP, mm Hg 80.1±8.5 83.0±10.3 0.149 70.0±9.1 80.0±11.10 0.712
FPG, mg/dL 171.4±68.1 170.7±63.0 0.961 130.2±33.3 156.2±60.9 0.046a
HbA1c, % 8.3±2.3 8.5±2.4 0.789 7.0±1.5 7.9±2.1 0.048a
TC, mg/dL 191.6±42.5 198.2±46.4 0.474 185.1±40.9 189.8±41.1 0.655
TG, mg/dL 223.3±144.5 196.8±175.9 0.461 153.5±86.5 158.0±156.0 0.895
HDL-C, mg/dL 44.9±8.5 44.1±9.7 0.695 46.3±7.5 46.4±10.8 0.946
LDL-C, mg/dL 108.8±34.7 119.6±39.7 0.213 108.6±38.6 115.4±30.1 0.472
BMI, kg/m2 24.7±3.0 26.1±3.2 0.038a 25.6±3.7 26.2±4.2 0.568
HOMA-IR 4.4±2.0 4.1±2.8 0.601 3.9±1.5 4.0±1.9 0.778
Smoking 37/74 (50) 25/36 (69) 0.041a 0/30 0/31 NA
Antiplatelet 15/36 (41) 22/74 (29) 0.107 7/30 (23) 7/31 (22) 0.592
Statin 11/34 (32) 30/74 (40) 0.276 11/30 (36) 13/30 (43) 0.396
Antihypertensive 3/35 (8) 16/74 (21) 0.076 11/30 (36) 9/31 (29) 0.359
UKPDS 10-yr CHD risk, %b 16.9±10.5 17.5±10.4 0.777 7.2±5.9 10.0±8.4 0.195
Microalbuminuria 5/36 (13.9) 13/74 (17.6) 0.499 3/30 (10.0) 5/31 (16.1) 0.527
Diabetic retinopathy 2/36 (5.6) 3/74 (4.1) 0.491 2/30 (6.7) 0/30 (0) 0.178
Diabetic neuropathy 8/36 (22.2) 17/74 (23.0) 0.535 7/30 (23.3) 9/30 (30.0) 0.589
Values are presented as mean±standard deviation or number (%).
IMT, intima-media thickness; SBP, systolic blood pressure; DBP, diastolic blood pressure; FPG, fasting plasma glucose; HbA1c, glycated hemo- globin; TC, total cholesterol; TG, triglyceride; HDL-C, high density lipoprotein cholesterol; LDL-C, low density lipoprotein cholesterol; BMI, body mass index; HOMA-IR, homeostasis model assessment-insulin resistance; UKPDS, United Kingdom Prospective Diabetes Study; CHD, coronary heart disease.
aP<0.05, bBased upon the UKPDS risk engine calculator (http://www.dtu.ox.ac.uk/riskengine).
levels, and blood pressure after the diagnosis of T2DM were more important than the baseline levels of these variables in preventing the progression of atherosclerosis.
Carotid IMT measurement is a noninvasive procedure that
enables clinicians to predict the future risk of CVD [7-9,26].
When compared with their nondiabetic counterparts, newly diagnosed diabetic patients display an increased carotid IMT at the time of diagnosis [27]. However, in clinical practice, it is Table 4. Comparison of clinical parameters between subjects according to the presence of progression of mean intima-media thickness at left common carotid artery in male
Parameter Nonprogression (n=35) Progression (n=38) Nonprogression vs. Progression, P value Baseline Follow-up P value Baseline Follow-up P value Between baseline Between follow-up SBP, mm Hg 128.9±14.2 127.4±12.0 0.302 133.5±15.0 122.9±15.2 <0.001a 0.254 0.170 DBP, mm Hg 81.5±8.6 75.3±6.8 <0.001a 82.8±10.0 73.9±9.7 <0.001a 0.645 0.511 FPG, mg/dL 156.5±59.6 117.0±20.2 0.001a 169.0±61.3 130.2±39.6 <0.001a 0.870 0.065
HbA1c, % 8.4±2.5 6.5±0.8 <0.001a 8.1±2.2 6.5±1.1 <0.001a 0.532 0.872
TC, mg/dL 194.9±53.6 158.0±31.3 0.003a 185.9±39.2 170.5±40.7 0.068 0.119 0.169
TG, mg/dL 188.7±113.8 147.6±91.6 0.100 164.0±92.6 133.9±72.9 0.054 0.097 0.351
HDL-C, mg/dL 44.7±9.4 45.8±9.4 0.386 46.7±8.6 45.2±10.4 0.419 0.102 0.751
LDL-C, mg/dL 113.7±45.7 79.8±24.6 0.001a 113.4±37.0 99.9±34.6 0.138 0.451 0.007a
BMI, kg/m2 25.1±2.5 24.7±2.7 0.357 25.0±3.3 24.5±3.1 0.013a 0.459 0.841
HOMA-IR 3.4±0.9 2.6±1.2 0.030a 4.3±2.4 3.9±3.0 0.499 0.670 0.103
UKPDS 10-yr CHD risk, %b 17.3±9.5 12.8±7.6 0.033a 13.3±7.1 11.1±5.6 0.071 0.039a 0.754
ΔCHD risk -4.9±11.2 -0.7±8.1 0.080
Antiplatelet 16/35 (45) 12/38 (31) 0.159
Statin 12/35 (34) 19/38 (50) 0.131
Antihypertensive 6/35 (17) 5/38 (13) 0.440
Values are presented as mean±standard deviation or number (%).
SBP, systolic blood pressure; DBP, diastolic blood pressure; FPG, fasting plasma glucose; HbA1c, glycated hemoglobin; TC, total cholesterol;
TG, triglyceride; HDL-C, high density lipoprotein cholesterol; LDL-C, low density lipoprotein cholesterol; BMI, body mass index; HOMA-IR, homeostasis model assessment-insulin resistance; UKPDS, United Kingdom Prospective Diabetes Study; CHD, coronary heart disease.
aP<0.05, bBased upon the UKPDS risk engine calculator (http://www.dtu.ox.ac.uk/riskengine).
Baseline 2-yr follow-up Baseline 2-yr follow-up
200 150 100 50 0
LDL-C (mg/dL)
Nonprogression Progression
a
200 150 100 50 0
HDL-C (mg/dL)
Nonprogression
a
Progression
Fig. 1. Comparison between participants with nonprogression and progression of carotid (A) intima-media thickness: low den- sity lipoprotein cholesterol (LDL-C) in males and (B) high density lipoprotein cholesterol (HDL-C) in females at baseline and 2-year follow-up. aP<0.05.
A B
common to encounter patients with well-controlled DM but also concurrent aggravation of carotid IMT. Thus, it is rela- tively difficult to predict possible candidates at higher risk for progression of carotid IMT. The present study was designed to identify risk factors that would enable clinicians to anticipate the progression of carotid IMT.
Participants with a past history of coronary artery disease and lower HDL-C levels have been reported to experience more rapid progression of carotid IMT than those without these risk factors [28]. Furthermore, the ARIC study revealed that diabetes, current smoking, HDL-C, pulse pressure, white blood cell count, and fibrinogen concentration were signifi- cantly associated with the progression of carotid IMT [25]. In a Japanese study of a male working population, the TC level appeared to be the only significant determinant of the progres- sion of carotid IMT [29].
Our study showed that at the time of diagnosis of T2DM, the mean carotid IMT was 0.65±0.16 mm in males and 0.65±
0.18 mm in females. Bae et al. [30] reported that the mean ca- rotid IMT values of normal participants between 45 and 64
years of age were 0.64±0.12 and 0.70±0.11 mm for males and 0.54±0.09 and 0.71±0.12 mm in females. One meta-analysis by Brohall et al. [31] demonstrated that patients with T2DM had a 0.13-mm thicker carotid IMT than normal participants.
In a Korean study, Seon et al. [32] reported the mean carotid IMT of Korean patients newly diagnosed with T2DM was 0.67±0.15 mm. Also, Park et al. [33] found that approximately 50% of newly diagnosed T2DM patients accompanied the ca- rotid plaque, which implies that the prevalence of abnormal carotid IMT in newly diagnosed T2DM patients may exceed 50%. When a comparison was made between the 2-year fol- low-up data and baseline data between participants with and without carotid IMT progression, the LDL-C level at the 2-year follow-up was significantly higher in males in the pro- gression group than in males from the nonprogression group, though most parameters had improved at follow-up compared with the baseline data. It should be noted that in the progres- sion group, the mean LDL-C level at the 2-year follow-up had decreased below 100 mg/dL but was still significantly higher in the progression group than the non-progression group Table 5. Comparison of clinical parameters between subjects according to the presence of progression of mean intima-media thickness at left common carotid artery in female
Parameter Nonprogression (n=20) Progression (n=20) Nonprogression vs. Progression, P value Baseline Follow-up P value Baseline Follow-up P value Between baseline Between follow-up SBP, mm Hg 131.6±15.9 121.6±11.9 0.010a 133.9±17.9 130.8±19.7 0.019a 0.826 0.995
DBP, mm Hg 80.6±11.6 71.3±7.9 0.005a 79.1±8.7 75.9±12.5 0.003a 0.636 0.604
FPG, mg/dL 145.6±59.7 113.4±20.3 0.007a 135.2±33.3 119.1±19.9 <0.001a 0.416 0.624
HbA1c, % 8.2±2.3 6.7±1.4 0.001a 7.2±1.2 6.4±0.4 <0.001a 0.057 0.123
TC, mg/dL 180.7±31.9 171.2±39.4 0.184 181.2±31.8 154.6±27.4 0.0038 0.834 0.917
TG, mg/dL 120.6±61.1 125.7±81.7 0.759 171.2±190.9 135.6±71.0 0.390 0.589 0.177
HDL-C, mg/dL 48.4±9.9 53.0±14.9 0.018a 46.1±9.3 44.1±12.0 0.597 0.491 0.049a
LDL-C, mg/dL 112.2±26.6 94.1±28.5 0.020a 105.9±29.7 83.7±21.2 0.004a 0.513 0.206
BMI, kg/m2 24.2±3.1 23.8±3.2 0.379 26.2±4.1 25.5±4.5 0.050 0.412 0.872
HOMA-IR 3.4±1.8 2.7±0.9 0.220 3.7±1.7 3.4±2.4 0.158 0.873 0.627
UKPDS 10-yr CHD risk, %b 10.1±5.9 7.2±3.2 0.006a 5.5±2.6 5.7±2.7 0.048a 0.249 0.849
ΔCHD risk -2.3±4.7 1.6±3.6 0.005a
Antiplatelet 6/20 (30) 5/20 (25) 0.50
Statin 9/20 (45) 5/20 (25) 0.16
Antihypertensive 6/20 (30) 7/20 (35) 0.50
Values are presented as mean±standard deviation or number (%).
SBP, systolic blood pressure; DBP, diastolic blood pressure; FPG, fasting plasma glucose; HbA1c, glycated hemoglobin; TC, total cholesterol;
TG, triglyceride; HDL-C, high density lipoprotein cholesterol; LDL-C, low density lipoprotein cholesterol; BMI, body mass index; HOMA-IR, homeostasis model assessment-insulin resistance; UKPDS, United Kingdom Prospective Diabetes Study; CHD, coronary heart disease.
aP<0.05, bBased upon the UKPDS risk engine calculator (http://www.dtu.ox.ac.uk/riskengine).
(99.9±34.6 mg/dL vs. 79.8±24.6 mg/dL; P=0.007) (Table 4).
This result was different from the previously reported data that demonstrated a significant association between HDL-C levels and IMT progression [25,28]. Insulin resistance itself does not play a principal role in escalating LDL-C [34]. Witz- tum [35] proposed an oxidation hypothesis of atherosclerosis in which LDL particle oxidation is stimulated by coexisting in- sulin resistance and consequently acts as a strong inflammato- ry stimulus of atherosclerosis in vessel walls. Unfortunately, in our study we did not measure apolipoprotein B levels, which reflect the number of LDL particles, but the significant differ- ence observed in LDL-C levels at the 2-year follow-up between males with and without progression of carotid IMT implied a significant association between LDL-C levels and changes in carotid IMT. It is noteworthy that the mean LDL-C level of the progression group at the 2-year follow-up was in fact lower than the recommended therapeutic target for diabetic patient (99.9±34.6 mg/dL) (Table 4) [14], while in the nonprogression group, it was approximately 70 mg/dL (79.8±24.6 mg/dL) (Ta- ble 4). Though the follow-up LDL-C in the nonprogression group also failed to achieve the therapeutic target level (70 mg/
dL) as recommended by the ADA [14], the percentage of par- ticipants who brought their LDL-C below 70 mg/dL was great- er in the nonprogression group (37.1%, 13/35) than it was in the progression group (15.7%, 6/38). These findings indicated the importance of the extent that LDL-C was reduced at the follow-up period in comparison to the baseline level, and dia- betic male patients with increased carotid IMT should also be regarded as high-risk patients; proper pharmacological treat- ment should be initiated to achieve the primary therapeutic goal of LDL-C <70 mg/dL.
In female participants in both the nonprogression and pro- gression groups, most parameters had improved 2 years after the diagnosis compared to baseline. However, when baseline and 2-year follow-up levels were compared between groups, the mean HDL-C level at the 2-year follow-up was significant- ly lower in the progression group than in the nonprogression group (44.1±12.0 mg/dL vs. 53.0±14.9 mg/dL; P=0.049) (Ta- ble 5). In contrast to male patients, changes in carotid IMT ap- peared to be influenced by HDL-C. Therefore, in addition to pharmacologic treatment, the importance of lifestyle modifi- cations, such as diet control and regular exercise, to raise HDL- C >50 mg/dL should be emphasized in female patients.
The UKPDS risk score is a tool designed to evaluate CVD risk in diabetic patients more accurately than the Framingham
and Systematic Coronary Risk Evaluation methods [36]. Ca- rotid IMT measurement with calculation of UKPDS engine score is known to augment the prediction ability of coronary artery stenosis [37]. Based on these findings, the additional analysis with the UKPDS engine score was intended to assess the risk of CVD in a multidimensional manner along with ca- rotid IMT. According to a previous study, the UKPDS 10-year CHD risk in Korean patients with newly diagnosed T2DM was 14.92% [32], which was similar to our results (Table 3). We found no significant differences in CHD risk scores between those with normal and abnormal baseline IMT (Table 3), but scores at the 2-year follow-up significantly improved after 2 years in both the nonprogression and progression groups (Ta- ble 4 and 5, except for males in the progression group). The im- provement in clinical parameters after 2 years of management likely contributed to this result. It should be noted that CHD risk scores in the progression groups did not improve (13.3%±
7.1% vs. 11.1%±5.6%; P=0.071 in males) (Table 4) and actually increased (5.5%±2.6% vs. 5.7%±2.7%; P=0.048 in females) (Table 5), whereas CHD risk scores in the nonprogression group significantly improved after 2 years. Also, the mean risk reduction (ΔCHD risk of the UKPDS engine score) of the non- progression group was higher than that of the progression group. These findings implied that those with advanced ath- erosclerosis may have a higher risk of CVD at the time of diag- nosis with T2DM, but successful control of risk factors after di- agnosis can markedly delay further atherosclerosis.
Our study had several limitations. First, it was a single cen- ter study, which limited the number of study participants. Sec- ond, the classification of normal and abnormal IMT was not based upon nationwide data, and other confounding factors were not statistically adjusted. Also, those who underwent ca- rotid IMT measurement at the 2-year follow-up period and those excluded due to the follow-up loss showed significant differences with respect to their TG (P=0.048 for males) and BMI (P=0.026 for females), which could have affected the re- sults of the analyses. Finally, we used the mean carotid IMT of the left CCA only. Different results could have been obtained if carotid IMT readings from other locations had been used.
In conclusion, levels of LDL-C in males and HDL-C in fe- males at the 2-year follow-up after new diagnosis of T2DM rather than at the time of diagnosis with T2DM were signifi- cantly different between those with and without progression of carotid IMT. A reduction in the UKPDS 10-year CHD risk score was associated with delayed advancement of atheroscle-
rosis. Therefore, the importance of establishing therapeutic lipid profile goals should be emphasized in newly diagnosed T2DM patients, as this could potentially halt the progression of carotid IMT. Additional large-scale studies of different pop- ulation groups are needed to confirm factors contributing to the progression of carotid IMT.
CONFLICTS OF INTEREST
No potential conflict of interest relevant to this article was re- ported.
REFERENCES
1. Aubertin-Leheudre M, Lord C, Goulet ED, Khalil A, Dionne IJ. Effect of sarcopenia on cardiovascular disease risk factors in obese postmenopausal women. Obesity (Silver Spring) 2006;
14:2277-83.
2. Jeong IK, King GL. New perspectives on diabetic vascular complications: the loss of endogenous protective factors in- duced by hyperglycemia. Diabetes Metab J 2011;35:8-11.
3. Butler WJ, Ostrander LD Jr, Carman WJ, Lamphiear DE. Mor- tality from coronary heart disease in the Tecumseh study:
long-term effect of diabetes mellitus, glucose tolerance and other risk factors. Am J Epidemiol 1985;121:541-7.
4. Cho M, Yu JM, Moon HJ, Kang JG, Lee BW, Lee SJ, Hong EG, Kim H, Kim DM, Ihm S, Choi MK, Yoo HJ. The accuracy and efficiency of intimascope(R) for measuring carotid artery inti- ma-media thickness in diabetes. J Korean Diabetes 2006;7:
349-58.
5. Pignoli P, Tremoli E, Poli A, Oreste P, Paoletti R. Intimal plus medial thickness of the arterial wall: a direct measurement with ultrasound imaging. Circulation 1986;74:1399-406.
6. Wong M, Edelstein J, Wollman J, Bond MG. Ultrasonic-patho- logical comparison of the human arterial wall: verification of intima-media thickness. Arterioscler Thromb 1993;13:482-6.
7. Hodis HN, Mack WJ, LaBree L, Selzer RH, Liu CR, Liu CH, Azen SP. The role of carotid arterial intima-media thickness in predicting clinical coronary events. Ann Intern Med 1998;128:
262-9.
8. O’Leary DH, Polak JF, Kronmal RA, Manolio TA, Burke GL, Wolfson SK Jr. Carotid-artery intima and media thickness as a risk factor for myocardial infarction and stroke in older adults:
Cardiovascular Health Study Collaborative Research Group. N Engl J Med 1999;340:14-22.
9. Tsivgoulis G, Vemmos K, Papamichael C, Spengos K, Manios E, Stamatelopoulos K, Vassilopoulos D, Zakopoulos N. Com- mon carotid artery intima-media thickness and the risk of stroke recurrence. Stroke 2006;37:1913-6.
10. Wagenknecht LE, D’Agostino RB Jr, Haffner SM, Savage PJ, Rewers M. Impaired glucose tolerance, type 2 diabetes, and carotid wall thickness: the Insulin Resistance Atherosclerosis Study. Diabetes Care 1998;21:1812-8.
11. Wagenknecht LE, Zaccaro D, Espeland MA, Karter AJ, O’Leary DH, Haffner SM. Diabetes and progression of carotid atherosclerosis: the insulin resistance atherosclerosis study.
Arterioscler Thromb Vasc Biol 2003;23:1035-41.
12. Shah AS, Dolan LM, Kimball TR, Gao Z, Khoury PR, Daniels SR, Urbina EM. Influence of duration of diabetes, glycemic control, and traditional cardiovascular risk factors on early atherosclerotic vascular changes in adolescents and young adults with type 2 diabetes mellitus. J Clin Endocrinol Metab 2009;94:3740-5.
13. Napoli N, Zardi E, Strollo R, Arigliani M, Daverio A, Olearo F, Tosi D, Dicuonzo G, Scarpa F, Pedone C, Tegue Simo HH, Mottini G, Pozzilli P. Increased carotid thickness in subjects with recently-diagnosed diabetes from rural Cameroon. PLoS One 2012;7:e41316.
14. American Diabetes Association. Standards of medical care in diabetes: 2011. Diabetes Care 2011;34 Suppl 1:S11-61.
15. Meijer R, Grobee DE, Bots ML. Mannheim consensus on ca- rotid intima-media thickness: opposite and complementary points of view. Cerebrovasc Dis 2006;21:415-6.
16. O’Leary DH, Polak JF, Wolfson SK Jr, Bond MG, Bommer W, Sheth S, Psaty BM, Sharrett AR, Manolio TA. Use of sonogra- phy to evaluate carotid atherosclerosis in the elderly: the Car- diovascular Health Study: CHS Collaborative Research Group.
Stroke 1991;22:1155-63.
17. American Heart Association; National Heart, Lung, and Blood Institue, Grundy SM, Cleeman JI, Daniels SR, Donato KA, Eckel RH, Franklin BA, Gordon DJ, Krauss RM, Savage PJ, Smith Jr SC, Spertus JA, Costa F. Diagnosis and management of the metabolic syndrome: an American Heart Association/
National Heart, Lung, and Blood Institute Scientific Statement:
executive summary. Cardiol Rev 2005;13:322-7.
18. Matthews DR, Hosker JP, Rudenski AS, Naylor BA, Treacher DF, Turner RC. Homeostasis model assessment: insulin resis- tance and beta-cell function from fasting plasma glucose and insulin concentrations in man. Diabetologia 1985;28:412-9.
19. Yau JW, Rogers SL, Kawasaki R, Lamoureux EL, Kowalski JW,
Bek T, Chen SJ, Dekker JM, Fletcher A, Grauslund J, Haffner S, Hamman RF, Ikram MK, Kayama T, Klein BE, Klein R, Krish- naiah S, Mayurasakorn K, O’Hare JP, Orchard TJ, Porta M, Rema M, Roy MS, Sharma T, Shaw J, Taylor H, Tielsch JM, Varma R, Wang JJ, Wang N, West S, Xu L, Yasuda M, Zhang X, Mitchell P, Wong TY; Meta-Analysis for Eye Disease (META- EYE) Study Group. Global prevalence and major risk factors of diabetic retinopathy. Diabetes Care 2012;35:556-64.
20. Molitch ME, DeFronzo RA, Franz MJ, Keane WF, Mogensen CE, Parving HH, Steffes MW; American Diabetes Association.
Nephropathy in diabetes. Diabetes Care 2004;27 Suppl 1:S79- 83.
21. Vinik A. Clinical review: Use of antiepileptic drugs in the treatment of chronic painful diabetic neuropathy. J Clin Endo- crinol Metab 2005;90:4936-45.
22. Stevens RJ, Coleman RL, Adler AI, Stratton IM, Matthews DR, Holman RR. Risk factors for myocardial infarction case fatality and stroke case fatality in type 2 diabetes: UKPDS 66. Diabetes Care 2004;27:201-7.
23. Stevens RJ, Kothari V, Adler AI, Stratton IM; United Kingdom Prospective Diabetes Study (UKPDS) Group. The UKPDS risk engine: a model for the risk of coronary heart disease in Type II diabetes (UKPDS 56). Clin Sci (Lond) 2001;101:671-9.
24. Kothari V, Stevens RJ, Adler AI, Stratton IM, Manley SE, Neil HA, Holman RR. UKPDS 60: risk of stroke in type 2 diabetes estimated by the UK Prospective Diabetes Study risk engine.
Stroke 2002;33:1776-81.
25. Chambless LE, Folsom AR, Davis V, Sharrett R, Heiss G, Sorlie P, Szklo M, Howard G, Evans GW. Risk factors for progression of common carotid atherosclerosis: the Atherosclerosis Risk in Communities Study, 1987-1998. Am J Epidemiol 2002;155:38- 47.
26. Bots ML, Grobbee DE. Intima media thickness as a surrogate marker for generalised atherosclerosis. Cardiovasc Drugs Ther 2002;16:341-51.
27. Temelkova-Kurktschiev TS, Koehler C, Leonhardt W, Schaper F, Henkel E, Siegert G, Hanefeld M. Increased intimal-medial thickness in newly detected type 2 diabetes: risk factors. Dia- betes Care 1999;22:333-8.
28. Crouse JR 3rd, Tang R, Espeland MA, Terry JG, Morgan T, Mercuri M. Associations of extracranial carotid atherosclero- sis progression with coronary status and risk factors in patients
with and without coronary artery disease. Circulation 2002;
106:2061-6.
29. Fujii K, Abe I, Ohya Y, Ohta Y, Arima H, Akasaki T, Yoshinari M, Iida M. Risk factors for the progression of early carotid ath- erosclerosis in a male working population. Hypertens Res 2003;26:465-71.
30. Bae JH, Seung KB, Jung HO, Kim KY, Yoo KD, Kim CM, Cho SW, Cho SK, Kim YK, Rhee MY, Cho MC, Kim KS, Jin SW, Lee JM, Kim KS, Hyun DW, Cho YK, Seong IW, Jeong JO, Park SC, Jeong JY, Woo JT, Koh G, Lim SW. Analysis of Korean carotid intima-media thickness in Korean healthy subjects and patients with risk factors: Korea Multi-Center Epidemiological Study. Korean Circ J 2005;35:513-24.
31. Brohall G, Oden A, Fagerberg B. Carotid artery intima-media thickness in patients with Type 2 diabetes mellitus and im- paired glucose tolerance: a systematic review. Diabet Med 2006;23:609-16.
32. Seon CS, Min KW, Lee SY, Nho KW, Park SH, Koo BK, Han KA. Cardiovascular risk assessment with vascular function, carotid atherosclerosis and the UKPDS risk engine in Korean patients with newly diagnosed type 2 diabetes. Diabetes Metab J 2011;35:619-27.
33. Park SW, Kim SK, Cho YW, Kim DJ, Song YD, Choi YJ, Huh BW, Choi SH, Jee SH, Cho MA, Lee EJ, Huh KB. Insulin resis- tance and carotid atherosclerosis in patients with type 2 diabe- tes. Atherosclerosis 2009;205:309-13.
34. Semenkovich CF. Insulin resistance and atherosclerosis. J Clin Invest 2006;116:1813-22.
35. Witztum JL. The oxidation hypothesis of atherosclerosis. Lan- cet 1994;344:793-5.
36. Van der Heijden AA, Ortegon MM, Niessen LW, Nijpels G, Dekker JM. Prediction of coronary heart disease risk in a gen- eral, pre-diabetic, and diabetic population during 10 years of follow-up: accuracy of the Framingham, SCORE, and UKPDS risk functions: the Hoorn Study. Diabetes Care 2009;32:2094-8.
37. Irie Y, Katakami N, Kaneto H, Kasami R, Sumitsuji S, Yamasa- ki K, Tachibana K, Kuroda T, Sakamoto K, Umayahara Y, Ueda Y, Kosugi K, Shimomura I. Maximum carotid intima-media thickness improves the prediction ability of coronary artery stenosis in type 2 diabetic patients without history of coronary artery disease. Atherosclerosis 2012;221:438-44.