In vivo and in vitro immunomodulation of Bambusae
caulis in Liquamen on atopic dermatitis
Xu-Feng Qi
The Graduate School
Yonsei University
Department of Medicine
In vivo and in vitro immunomodulation of Bambusae
caulis in Liquamen on atopic dermatitis
A Dissertation
Submitted to the Department of Medicine
and the Graduate School of Yonsei University
in partial fulfillment of the requirements
for the degree of Doctor of Philosophy
Xu-Feng Qi
July 2010
This certifies that the Doctoral Dissertation of
Xu-Feng Qi is approved.
Thesis supervisor: Prof. Kyu-Jae Lee, M.D., Ph.D.
Committee member: Prof. Kyu-Sang Park, M.D., Ph.D.
Committee member: Prof. Tae-Young Kang, M.D., Ph.D.
Committee member: Prof. Eung-Ho Choi, M.D., Ph.D.
Committee member: Prof. Soo-Ki Kim, M.D., Ph.D.
The Graduate School
Yonsei University
ACKNOWLEDGEMENTS
Firstly, I would like to express gratitude to my supervisor, Prof. Kyu-Jae Lee, who gave me a great opportunity to challenge the degree of Ph.D. during the past several years. He has advised me with his invaluable insight, frequent encouragement, and endless support throughout my doctoral course. His help is more important to let me finish my own doctoral course and interest in research work. I would also like to express my sincere gratitude to the members of my dissertation committee, including professors Kyu-Sang Park, Tae-Young Kang, Eung-Ho Choi, and Soo-Ki Kim, for their invaluable advice and patience. Additionally and particularly, I gratefully thank Prof. Yung-Chien Teng for his concerns in life and encouragement during my Ph.D. training.
Secondly, I would like to thank the members of Department of Environmental and Medical Biology such as Dr. Dong-Heui Kim, Dr. Yang-Suk Yoon, Ms. Soon-Bong Song, Mr. Jae-Shin Sung, and Mr. Tae-Eul Jung for their helps, concerns and supports. I am also indebted to my Chinese friends such as Dr. Long-Quan Pi, Dr. Guo-Hua Song, Mr. Xing-Hai Jin, and Mr. Feng Xuan for their help in my life and research work.
At last, I feel a deep sense of gratitude to my parents for their love, support and encouragement. Without their supports, it is impossible for me to finish my doctoral course.
CONTENTS
Abstract ... 1
. Introduction Ⅰ ... 5
. Materials and Methods Ⅱ ...11
1. In vivo experiment ...11
(1). Bambusae caulis in Liquamen (BCL) ...11
(2). Animals ...11
(3). Induction of AD-like skin lesions in hairless mice... 12
(4). Transepidermal water loss (TEWL) ... 13
(5). Melanin index and Erythema ... 13
(6). Scanning electron microscopy... 13
(7). Serum leukocyte evaluation ... 14
(8). Reverse-transcription PCR... 14
(9). Measurement of serum IgE ... 15
2. In vitro experiment... 16
(1). Reagents ... 16
(2). Cell Culture ... 17
(4). Enzyme-linked immunosorbent assay (ELISA)... 18
(5). Reverse-transcription PCR and Real-time PCR analysis... 19
(6). Determination of ROS generation ... 21
(7). Whole-cell and nuclear fractionation... 22
(8). Western blotting analysis ... 23
(9). Immunocytochemistry ... 23 (10). 2,2-diphenyl-1-picrylhydrazyl (DPPH) assay ... 24 3. Statistical analysis ... 25 . Results Ⅲ ... 26 1. In vivo experiment ... 26
(1). Improvement of skin lesions in BCL-treated hairless mice ... 26
(2). Observation of the skin surface using electron microscopy... 28
(3). Effect of BCL on the production of serum leukocytes in hairless mice ... 30
(4). Effect of BCL on serum IgE levels in DNCB-treated mice... 32
(5). Cytokine mRNA expression in BCL-treated hairless mice ... 34
2. In vitro experiment... 36
(1). Cell viability ... 36 (2). IFN-γ induced the production of TARC and MDC in HaCaT cells
... 38 (3). BCL decreased IFN-γ-induced production of TARC and MDC 40 (4). ROS contributed to IFN-γ-stimulated production of TARC and MDC in HaCaT cells... 43 (5). H2O2-mimicked intracellular ROS contributed to the production
of TARC and MDC in HaCaT cells………...47 (6). The JAKs, p38 MAPK, and NF-кB pathway contributes to the production of TARC and MDC in HaCaT cells ... 49 (7). ROS promoted the p38 MAPK-independent activation of NF-кB in IFN-γ-treated HaCaT cells... 55 (8). Effect of ROS on IkB phosphorylation and degradation ... 62 (9). BCL suppressed the activation of NF-кB via IкB, but not via p38 pathway... 65 (10). Determination of antioxidant effect of BCL ... 69 . Ⅳ Discussion ... 71 . Conclusion Ⅴ ... 83 . References Ⅵ ... 84 Abstract in Korean (국문요약)... 102
LIST OF FIGURES
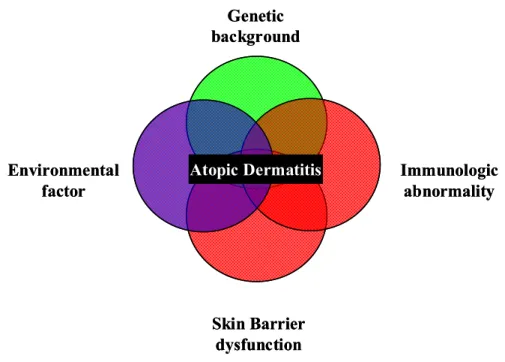
Fig. 1. Factors contributing to the pathogenesis of atopic dermatitis…………6 Fig. 2. Improvement in skin lesions in hairless mice treated with BCL……..27 Fig. 3. Scanning electron micrographs of skin lesions in hairless mice……..29 Fig. 4. Effects of BCL on the production of serum leukocytes in
DNCB-induced hairless mice………..31
Fig. 5. Effects of BCL on serum IgE levels in DNCB-induced hairless
mice……….33
Fig. 6. Cytokine mRNA expression in the spleen of hairless mice from the
normal group (Nor), control group (Con), and experimental group (Exp)………35
Fig. 7. Effect of BCL on the viability of HaCaT cells…..………37 Fig. 8. IFN-γ induced TARC (A) and MDC (B) release, and mRNA
expression (C)………..39
Fig. 9. Effects of BCL on IFN-γ-induced production of TARC and MDC in
HaCaT cells……….41
Fig. 10. Intracellular ROS generation contributed to IFN-γ-stimulated
production of TARC and MDC in HaCaT cells………..45
Fig. 11. H2O2 promoted chemokine production in HaCaT cells………...48 Fig. 12. JAKs, p38 MAPK and NF-кB pathways were involved in
Fig. 13. JAKs contributed to p38/NF-κB pathway activation in IFN-γ-treated
HaCaT cells……….53
Fig. 14. ROS promoted nuclear translocation of NF-кB p65 independent of
the p38 MAPK pathway………..57
Fig. 15. JAKs and p38 MAPK pathway were not involved in IFN-γ-induced
ROS generation………...59
Fig. 16. NF-кB was involved in ROS-mediated chemokine production in
HaCaT cells……….61
Fig. 17. Effect of ROS on IkB phosphorylation and degradation…………...64 Fig. 18. BCL suppressed the activation of NF-кB via IкB, but not via p38
pathway………...67
Abstract
In vivo and in vitro immunomodulation of Bambusae
caulis in Liquamen on atopic dermatitis
Xu-Feng Qi Dept. of Medicine The Graduate School Yonsei University
Background: Bambusae caulis in Liquamen (BCL) is a nutritious liquid
extracted from heat-treated fresh bamboo stems. It is an important traditional herbal medicine used to treat coughs and asthma in East Asia. In recent years, it has been studied for its anti-inflammatory, anti-allergenic, immune-regulating, and antioxidant properties. Atopic dermatitis (AD) is a chronic inflammatory skin disease that is characterized by Th2-skewed
immune response. However, in vivo and in vitro immunologic impacts and mechanisms of BCL on atopic dermatitis remain unknown. Aim of the study: (1) to examine whether BCL suppresses the development of 2,4-dinitrochlorobenzene (DNCB)-induced AD-like skin lesions in hairless mice; (2) to define whether and how BCL affects the expression of thymus and activation-regulated chemokine (TARC), and macrophage-derived chemokine (MDC), the Th2-type chemokines which are correlated with the disease severity in AD patients, in HaCaT keratinocytes. Materials and methods: First, the in vivo immunotherapeutic effects of BCL were analyzed using DNCB-induced hairless mice model by measuring transepidermal water loss (TEWL), melanin index, and erythema in the skin, leukocyte numbers and IgE levels in the serum, and mRNA expression of relevant cytokines in the spleen. Next, to verify the impacts of BCL on TARC and MDC expression in HaCaT cells and their potential mechanisms, we adopted a cell viability assay, RT-PCR, Real-time PCR, enzyme-linked immunosorbent assay (ELISA), Western blotting analysis, immunocytochemistry, DPPH analysis, and DCFH-DA analysis. Results: We found that topical application of BCL on hairless mice skin inhibited the development of DNCB-induced AD-like skin lesions by suppressing TEWL, erythema of skin, the number of leukocytes and
the level of IgE in serum, and the mRNA expression of IL-4, IL-13, and TNF-α in the spleen. However, topical BCL treatment increased the expression of IFN-γ in the spleen. In addition, in vitro study showed that both Janus family kinases (JAKs)/p38 mitogen-activated kinase (MAPK) pathway and increase in intracellular reactive oxygen species (ROS) generation contributed separately to IFN-γ-induced production of TARC and MDC by activating nuclear factor-kappa B (NF-кB) signaling. However, BCL suppressed IFN-γ-induced expression of TARC and MDC by inhibiting the activation of ROS/IкB/NF-кB signaling due to its antioxidant effects. Although p38 MAPK also contributed to the expression of chemokines, BCL had minimal effects on phosphorylation of p38 MAPK. Conclusions: Taken together, in vivo findings indicate that BCL suppresses the development of DNCB-induced AD-like skin lesions in hairless mice. Additionally, in vitro findings indicate that intracellular ROS and JAKs/p38 MAPK independently contribute to IFN-γ-stimulated production of TARC and MDC by increasing NF-кB activation in HaCaT keratinocytes. BCL suppressed the production of TARC and MDC via inhibiting ROS/IкB/NF-кB pathways due to its antioxidant function. Collectively, this study suggests that BCL may be useful for AD treatment.
Keywords: Bambusae caulis in Liquamen (BCL); hairless mice; HaCaT cells;
Ⅰ. Introduction
Atopic dermatitis (AD) is a chronic inflammatory skin disease that is characterized by peripheral blood eosinophilia and a high level of serum IgE1-4. In recent years, the number of patients with AD in developed nations has increased5, 6. The causes of AD are multifactorial (Fig. 1) and include immunological abnormalities and physiological and biochemical defects of the skin barrier structure7-11. Previous studies have demonstrated that the ratio of IL-4 producing cells to IFN-gamma producing cells is increased in acute AD lesions. Further, mononuclear cells from patients with AD produce higher levels of IL-4, IL-5, and IL-13 than those from healthy individuals9, 12. In contrast, chronic AD skin lesions have significantly fewer IL-4 and IL-13 mRNA-expressing cells but increased numbers of IL-5, IL-12, and IFN-gamma mRNA-expressing cells compared to those in acute AD skin lesions. These findings suggest that AD is Th2-skewed immune response. Moreover, AD tends to decrease skin hydration and thus increase transepidermal water loss (TEWL)13, 14.
Atopic Dermatitis Environmental factor Immunologic abnormality Skin Barrier dysfunction Genetic background Atopic Dermatitis Environmental factor Immunologic abnormality Skin Barrier dysfunction Genetic background
Chemokines are a superfamily of small cytokines that regulate trafficking of various types of leukocytes15. According to the position of the first two of the four conserved cysteine residues, chemokines are divided into four subgroups: CC, C, CXC, and CX3C16. Chemokines bind to leukocytes via their corresponding several transmembrane-spanning, G-protein coupled receptors that have been grouped according to the structure of their chemokine ligands (CCR, CR, CXCR and CX3CR)17. Thymus and activation-regulated chemokine (TARC/CCL17) is a CC chemokine constitutively expressed in thymus and is produced by monocyte-derived dendritic cells18 and keratinocytes19. It is a ligand for CCR4, which is preferentially expressed on Th2 lymphocytes20. Macrophage-derived chemokine (MDC/CCL22), a CC chemokine closely related to TARC, is also specific ligand for CCR4. MDC is constitutively produced by dendritic cells, B cells, macrophages, keratinocytes, and epithelial cells21-23. TARC and MDC might play an important role in the development of AD. Previous reports have showed that the serum levels of TARC and MDC are significantly elevated and correlated with the disease severity in patients with AD24. In addition, the expressions of TARC25 and MDC19 were significantly increased in the basal epidermis of lesional skin compared with the healthy controls. Given these findings, TARC and MDC may be involved in the pathogenesis of AD.
Previous studies have demonstrated that IFN-gamma induces TARC and MDC production in cultured human keratinocytes by activating NF-кB through p38 MAPK pathway26-28. Reactive oxygen species (ROS) can function as second messengers during inflammatory signaling29, thereby exerting pro-inflammatory effects and increasing nuclear factor-kB activation in various immune cells30. For instance, IFN-gamma has been shown to increase ROS generation in cultured human retinal pigment epithelial (RPE) cells31, mouse primary hepatocytes32, mouse biliary epithelial cells (BECs)33, and human endothelial cells34. Taken together, these previous data suggested that intracellular ROS levels might be associated with the development of inflammation in a cell tyepe-independent manner.
Despite the increase in the number of patients with AD in recent years, the pathogenesis of the disease has not yet been fully elucidated. Immunosuppressive drugs such as glucocorticoids are effective for atopic dermatitis. However prolonged use of these drugs may cause adverse effects owing to its non-specific immune modulation35, 36. So far, herbal medicines such as Rumexjaponicus37 and Scutellariabaicalensis38 are used to treat atopic dermatitis in eastern countries, especially in China, Korea, and Japan. Bambusae caulis in Liquamen (BCL), the nutritious liquid that is extracted from heat-treated fresh bamboo stems, is a traditional herbal medicine widely used in eastern counties for treatment of coughs and asthma. But in recent
years, it was studied for its anti-inflammatory, anti-allergenic, immune-regulating, and antioxidative capacities39, 40. Moreover, the liquid diluted with water is gaining widespread popularity in Japan as a folk medicine for skin diseases such as scabies, eczema, and atopicdermatitis41. However, in vivo and in vitro immunomodulatory effects of BCL on atopic dermatitis as well as the potential mechanism remain unclear. Therefore, the purpose of this study is to investigate whether and how BCL suppresses the development of 2, 4-dinitrochlorobenzene (DNCB)-induced AD-like skin lesions in hairless mice, a murine model of AD42, 43; second purpose is to investigate whether and how BCL inhibits the production of Th2-related chemokines (TARC and MDC), the important biomarkers of AD, in HaCaT keratinocytes.
Using DNCB-induced hairless mice, the present study showed that BCL suppresses the development of DNCB-induced AD-like skin lesions in hairless mice by improving skin barrier function, suppressing the overproduction of serum IgE and leukocytes, and balancing the expression of Th1/Th2 cytokines in the spleen, indicating that BCL might be clinically relevant therapeutic agent for AD. Additionally, using HaCaT keratinocytes, we demonstrated a significant increase in the intracellular generation of ROS in IFN-γ-stimulated HaCaT cells and this increase in ROS generation contributed to the production
of TARC and MDC, the important biomarkers of AD, by activating I kappa B (IкB)-NF-кB in a p38 MAPK-independent manner. Interestingly, BCL can markedly inhibit the production of TARC and MDC in HaCaT cells by suppressing ROS/IкB/NF-кB pathways owing to its antioxidant effects. Collectively, these results indicated that BCL possesses the in vivo and in vitro immunomodulatory effects on atopic dermatitis.
Ⅱ. Materials and Methods
1. In vivo experiment
(1). Bambusae caulis in Liquamen (BCL)
BCL was purchased from Nanumttel Co., Ltd. (Seoul, Korea). Fresh bamboo stems (Phyllostachys bambusoides Siebold et Zuccarinii) were harvested from fields in the vicinity of Chuwol Mountain in Damyang (Chonnam,Korea). A voucher specimen (KNKA200506151038) was deposited in the herbarium of the Korea National Arboretum (Gyeonggi, Korea). Ten kilograms of fresh bamboo stems (30-50 cm segments) were heated indirectly at 200°C for 12 h using a crock. About 2 liters of liquid released directly from the bamboo stems were collected and then purified using an active carbon filtration device to remove impurities. The commercial BCL was further sterilized using a 0.2 μm filter (Toyo Roshi Kaisha Ltd., Tokyo, Japan), and stored at 4°C until use.
(2). Animals
Seven-week-old female hairless mice were purchased from Orient Bio (Sungnam, Korea). The animals were kept in a constant temperature (22 ± 2°C)
and humidity (55 ± 5%) environment, and provided with a standard diet and water throughout the experiments. This study was approved by the Yonsei University Animal Committee, and the animals were maintained in accordance with the guidelines for the care and use of laboratory animals of Yonsei University Wonju College of Medicine.
(3). Induction of AD-like skin lesions in hairless mice
2, 4-dinitrochlorobenzene (DNCB) (purchased from TCI, Japan) dissolved in acetone was used to induce dermatitis in hairless mice as described previously42, 44, 45. Briefly, the dorsal skin of hairless mice in both the control
(Con) group and experimental (Exp) groups were sensitized with 100 μl of 1% DNCB daily for 7 days. After the first challenge, 100 μl of 0.5% DNCB was repeatedly applied to the dorsal skin for a further 5 weeks at 2-day intervals. At the same time, 100 μl of BCL was applied daily to the entire dorsal skin of the hairless mice in the Exp group for 5 weeks and the application of BCL was separated by 7 hours from that of DNCB. The normal (Nor) group was treated with distilled water instead of DNCB. No substances were applied to the skin surface on the last day of the experiment. The next day, measurements of skin barrier function including transepidermal water losss (TEWL), melanin
content, and erythema were carried out. The mice were then sacrificed, and skin, spleen, and blood samples were preserved for further analysis.
(4). Transepidermal water loss (TEWL)
A cutometer MPA 580 (Courage & Khazaka, Cologne, Germany) was used to evaluate the skin surface of the hairless mice at the end of the experiment according to the manufacturer’s instruction. TEWL was measured under standard conditions (a room temperature of 20 ± 2°C and a relative humidity of 45 ± 5%) using a Tewameter TM 210 probe (Courage & Khazaka, Cologne, Germany).
(5). Melanin index and Erythema
Both melanin index and erythema of the dorsal skin were measured using a Mexameter MX 18 probe (Courage & Khazaka, Cologne, Germany) under the same conditions as described above for TEWL measurement.
(6). Scanning electron microscopy
For the scanning electron microscopy (SEM) observations, the skin tissues obtained from hairless mice after measurement of skin barrier function were
fixed in 2.5% glutaraldehyde for 2 h at 4°C, washed in 0.1 M phosphate buffer (pH 7.4), and then post-fixed in 1% osmium tetroxide in the same buffer for 90 min at 4°C, dehydrated in a series of ethyl alcohol concentrations, and then critical point-dried. The specimens were coated with gold-palladium and then examined under a scanning electron microscope (TM-1000, HITACHI Co. Ltd., Japan) at 30 kV.
(7). Serum leukocyte evaluation
After the experiment, blood samples were collected from the retro-orbital plexus of mice. A HEMAVET® 950 (DREW Scientific, USA) was used to evaluated the amount of leukocytes in the serum samples of hairless mice. We measured the number of white blood cells (WBC), neutrophils (NE), eosinocytes (EO), monocytes (MO), lymphocytes (LY), and basicytes (BA).
(8). Reverse-transcription PCR
Total RNA from the spleen was isolated with Trizol (Molecular Research Center Inc., Cincinnati, USA) according to the manufacturer’s instruction. cDNA was synthesized from total RNA (2 μg) using oligo (dT)18 primers(0.5
manufacturer’s instruction. The primers used in this study were as follows: IL-4 (forward) 5’-AGT TGT CAT CCT GCT CTT CTT T-3’, (reverse) 5’-GAC TGG GAC TCA TTC ATG GTG C-3’; IL-13 (forward) 5’-GCA ACG GCA GCA TGG TAT GGA G-3’, (reverse) 5’-TGG TAT AGG GGA GGC TGG AGA C-3’; IFN-γ (forward) 5’-CTC AAG TGG CAT AGA TGT-3’, (reverse) 5’-GAG ATA ATC TGG CTC TGC AGG ATT-3’; TNF-α (forward) 5’-CAC CAC GCT CTT CTG TCT ACT GAA C-3’, (reverse) 5’-CCG GAC TCC GTG ATG TCT AAG TAC T-3’; and β-actin (forward) 5’-GCA CCA CAC CTT CTA CAA TGA G-3’, (reverse) 5’-TTG GCA TAG AGG TCT TTA CGG A-3’. β-actin primers were used as an internal control. The PCR reaction was performed using the Prime Taq Premix kit (GeNet Bio, Korea) and a final reaction volume of 20 μl. All samples were pre-denatured for 5 min at 94°C, followed by 32 thermal cycles (94°C for 30 s, 55 to 62°C for 30 s, and 72°C for 1 min), and an additional extension at 72°C for 7 min. Amplified cDNAs were subjected to electrophoresis on 2% agarose gels and visualized by staining with ethidium bromide.
(9). Measurement of serum IgE
of the experiment, and serum was obtained by centrifugation at 3000×g for 10 min at 4°C; serum was stored at -70°C until use. The serum IgE levels were measured using a mouse IgE enzyme-linked immunosorbent assay kit (Shibayagi Co., Ltd., Gunma, Japan) following the manufacturer’s instruction.
2. In vitro experiment
(1). Reagents
BCL was used in this study as described above in “in vivo experiment” section. Recombinant human IFN-γ was purchased from Abcam Inc. (Cambridge, MA, USA). Janus family kinase (JAK) inhibitor I, AG490, SB203580, PD98059, SP600125, and Bay11-7082 were purchased from Calbiochem (La Jolla, CA, USA). Buthionine sulfoximine (BSO), N-acetylcysteine (NAC), superoxide dismutase (PEG-SOD), catalase (PEG-Catalase), hydrogenperoxide (H2O2),
5’-deoxy-5’-(methylthio)-adenosine (MTA), N-acetyl-Leu-Leu-norleucinal
(ALLN), 4’,6-Diamidino-2-phenylindole (DAPI),
2,2-diphenyl-1-picrylhydrazyl (DPPH), and 2’,7’-dichlorodihydrofluorescin diacetate (DCFH-DA) were purchased from Sigma-Aldrich Co. (St. Louis, MO, USA). ELISA reagents for human TARC/CCL17 and MDC/CCL22 were
obtained from R&D Systems (Minneapolis, MN, USA). Antibodies against phospho-p38 MAPK, p38 MAPK, NF-kB p65, IkB-α, phosphor-specific IkB-α, poly(ADP-ribose) polymerase (PARP), β-actin, horseradish peroxidase (HRP)-conjugated goat anti-rabbit IgG, and Alexa Fluor® 488 goat anti-rabbit IgG (H+L) were purchased from Cell Signaling Technology (Beverly, MA, USA). An enhanced chemiluminescence (ECL) western blotting detection system was obtained from GE Healthcare (Amersham, UK).
(2). Cell Culture
A human keratinocyte cell line (HaCaT) was cultured in RPMI 1640 medium (BioWhittaker Inc., Walkersville, MD, USA) containing 10% fetal bovine serum (FBS) (BioWhittaker Inc.), 100 U/ml penicillin and 100 μg/ml streptomycin (BioWhittaker Inc.) at 37°C in a 5% CO2 incubator. The medium
was exchanged for serum-free RPMI 1640 medium prior to beginning the experiments described below.
(3). Cell viability assay
Cell viability was assessed by the 3-(4,5-dimethylthiazol-2-yl)-2,5-diphenyl tetrazolium bromide (MTT) assay according to the method described
previously46 with some modifications. Briefly, HaCaT cells were seeded into
96-well microtiter plates at a density of 1 × 10⁴ cells/well (200 μl) and
incubated in complete medium. After 24 h, the medium was replaced with serum-free medium containing various concentrations of BCL, with RPMI 1640 as the negative control. After incubating for 12 h, cells were treated with MTT (5 mg/ml) for 4 h. The formazan precipitate was dissolved in 200 μl of dimethyl sulfoxide (DMSO), and the absorbance at 570 nm was detected with an automated microplate reader. The percentage of cell viability was calculated by the following formula: cell viability (%) = (mean absorbency in test wells) / (mean absorbency in control wells) × 100.
(4). Enzyme-linked immunosorbent assay (ELISA)
Cells (1×10⁶/well) were seeded into 6-well plates in 1 ml medium with 10%
FBS, at least in triplicate. After reaching confluence, the cells were washed and incubated with 1 ml serum-free medium containing various concentrations of IFN-γ for 24 h. The culture supernatants were analyzed for TARC and MDC by ELISA (R&D Systems) according to the manufacturer’s instructions. In some experiments, cells were incubated with IFN-γ in the presence or absence of pharmacological reagents.
(5). Reverse-transcription PCR and Real-time PCR
analysis
Cells were incubated as above for 12 h to analyze the mRNA expression of TARC and MDC. Total RNA was isolated using TRI reagent (Molecular Research Center Inc., Cincinnati, OH, USA). The quantity and purity of RNA was verified by measuring absorbance (A260 and A280). cDNA was synthesized from total RNA (2 μg) and oligo (dT)18 primers(0.5 μg) using
Prime RT Premix (GeNet Bio, Korea) according to the manufacturer’s instructions. Reverse transcription polymerase chain reaction (RT-PCR) was performed as previously described27. The primers used for RT-PCR were as
follows: TARC (forward) 5’-ATG GCC CCA CTG AAG ATG CT-3’, (reverse) 5’-TGA ACACCA ACG GTG GAG GT-3’; MDC (forward) 5’-AGG ACA GAG CAT GGC TCG CCT ACA GA-3’, (reverse) 5’-TAA TGG CAG GGA GGT AGG GCT CCT GA-3’; and GAPDH (forward) 5’-ACC ACA GTC CAT GCC ATC AC-3’, (reverse) 5’-TCC ACC ACC CTG TTG CTG TA-3’. GAPDH primers were used as an internal control. All samples were pre-denatured for 5 min at 94°C. Conditions of PCR amplification were as follows: TARC, 94°C for 30 s, 62°C for 30 s, 72°C for
30 s for a total of 30 cycles; MDC, 94°C for 30 s, 65°C for 30 s, 72°C for 30 s for a total of 30 cycles; GAPDH, 94°C for 30 s, 56°C for 30 s, 72°C for 30 s for a total of 30 cycles. Following these cycles of PCR amplification, the amplified cDNAs were further extended by additional extension at 72°C for 7min. The expected fragment length was 351 bp for TARC, 362 bp for MDC, and 452 bp for GAPDH, respectively. Amplified products were subjected to electrophoresis on 2% agarose gels and visualized by staining with ethidium bromide.
Quantitative real-time PCR analysis was carried out using first-strand cDNA, QuantiTect SYBR green PCR Master Mix (Qiagen GmbH, Hilden, Germany) and a Rotor-Gene™ 3000 machine (Corbett Robotics Inc., San Francisco, USA). The following primers were used in this study: TARC (forward) 5′-AGG GAC CTG CAC ACA GAG AC-3′, (reverse) 5′-CTC GAG CTG CGT GGA TGT GC-3′; MDC, (forward) 5’-ATG GCT CGC CTA CAG ACT GCA CTC-3’, (reverse) 5’-CAC GGC AGC AGA CGC TGT CTT CCA-3’; β-actin (forward) 5′-CTG GCA CCC AGC ACA ATG-3′, (reverse) 5′-CCG ATC CAC ACG GAG TAC TTG-3′. β-actin was used as an internal control. After denaturation for 10 min at 95°C, the reactions were subjected to
45 cycles of 95°C for 30 s, 60°C for 30 s, and 72°C for 30 s. To verify that only the specific product was amplified, a melting point analysis was done after the last cycle by cooling samples to 55°C and then increasing the temperature to 95°C at 0.2°C/s. Results were calculated using the ΔCt method and normalizing to β-actin expression for each sample.
(6). Determination of ROS generation
The level of intracellular ROS was assessed by measuring the oxidation of 2’,7’-dichlorodihydrofluorescin diacetate (DCFH-DA) as described previously47 with some modification. In brief, cells were seeded into 6-well
plates and grown until reaching about 80% confluence. The medium was then removed, the cells were washed with cold PBS, and serum-free medium was added. The cells were then loaded with 10 μM DCFH-DA for 30 min in the incubator, and then IFN-γ and/or BCL were added with indicated concentrations in the presence or absence of pharmacological reagents. After 1 h, the cells were scraped in the dark in 100 μl of PBS containing 1% Triton X-100. Lysates were centrifuged at 12,000×g for 10 min at 4°C. The samples were put into a black 96-well plate, and fluorescence was measured with a DTX-880 multimode microplate reader (Beckman Coulter Inc., Fullerton, CA,
USA) at excitation/emission wavelengths of 480/535 nm. Values were normalized to protein content and expressed as a percentage of the level of ROS in the control cells. Additionally, typical cellular images of ROS generation (green fluorescence of DCF) were captured by fluorescence microscopy (Olympus, Japan) at excitation/emission wavelengths of 488/525 nm.
(7). Whole-cell and nuclear fractionation
HaCaT cells were treated with IFN-γ and/or BCL in the presence or absence of pharmacological reagents for 30 min, and whole-cell and nuclear extracts were prepared using a Nuclear Extract Kit (Active Motif, Carlsbad, CA, USA). Briefly, cells (2×10⁷) were washed twice with 3ml ice-cold hosphate-buffered
solution (PBS) containing phosphatase inhibitors, centrifuged 5min at 500×g at 4°C, lysed in 300 μl complete lysis buffer, mixed completely and centrifuged at 14,000×g for 20 min at 4°C. Supernatants (whole-cell extract) were then stored at −80°C until use. For nuclear extracts, after washing, the cells were lysed in 500 μl hypotonic buffer and then centrifuged at 14,000×g for 30 s at 4°C. After removing the supernatant, pellets were resuspended in 50 μl complete lysis buffer and centrifuged at 14,000×g for 10 min at 4°C, and
the supernatants (nuclear fraction) were stored at −80°C until use. Protein concentrations were determined using the Bio-Rad Protein Assay (Bio-Rad Laboratories, CA).
(8). Western blotting analysis
Equal amounts of protein (40 μg/lane) were separated by SDS- polyacrylamide gel electrophoresis (SDS-PAGE) and transferred onto polyvinylidene difluoride (PVDF) membrane (Immobilion-P; Millipore, Bedford, MA). Membranes were blocked with 5% nonfat milk, washed briefly, incubated with primary antibodies at 4°C overnight, and then incubated with corresponding HRP-conjugated secondary antibodies for 1 h at room temperature. Protein bands were visualized by incubating membranes with chemiluminescence reagents before exposure to X-ray film. Chemiluminescent signals were analyzed using Image-Pro Plus version 6.0 (Media Cybernetics, MD, USA).
(9). Immunocytochemistry
Cells were incubated on BD FalconTM culture slides (BD Biosciences,
3.7% formaldehyde and permeabilized with 0.5% Triton X-100. Slides were washed with PBS, blocked for one hour with 3% bovine serum albumin and incubated with rabbit monoclonal anti-NF-kB p65 antibody (1:50, Cell Signaling) overnight at 4°C. The cells were then washed and incubated with Alexa Fluor® 488 goat anti-rabbit IgG (H+L) (1:200, Cell Signaling) for one hour at room temperature, and nuclei were stained for 10 min with 4′,6-Diamidino-2-phenylindole (DAPI) (10 μg/ml, Sigma). The stained cells were mounted with mounting medium and observed by Leica DMI 4000 confocal microscope (Leica, Germany).
(10). 2,2-diphenyl-1-picrylhydrazyl (DPPH) assay
2,2-diphenyl-1-picrylhydrazyl (DPPH) free radical was used to measure antioxidant capacity (ACDPPH) as described previously48, 49 with some
modification. In brief, DPPH was dissolved in ethanol to make a working stock with 1 mM concentration. 100 μl of DPPH (100 μM, diluted with ethanol) was added into each well of 96-well plate, and another 100 μl of ethanol alone or with indicated concentration of BCL was then added into relevant wells. Plate was then incubated for indicated time in the dark at room temperature. 200 μl of ethanol alone-wells were used as blank; 100 μl of
DPPH (100 μM) plus 100 μl of ethanol-wells were used as control (Ac); 100 μl of DPPH (100 μM) plus 100 μl of ethanol with indicated concentration of BCL-wells were used as test samples (At). At the end of experiment, the decrease in light absorbance in every well was measured at 515 nm against a blank using DTX-880 multimode microplate reader (Beckman Coulter Inc., Fullerton, CA, USA). The antioxidant activity of BCL was calculated by the following formula: scavenger activity against DPPH free radical (%) = [1-(mean absorbency in test wells)/(mean absorbency in control wells)] ×100 = (1-At/Ac) × 100.
3. Statistical analysis
Statistical analysis was performed using one-way ANOVA followed by Dunnett's multiple comparison test to compare three or more groups. However, the unpaired Student’s t-test was used to compare two different groups. A p value of less than 0.05 was considered to be statistically significant. All data are presented as the mean ± SEM of at least three separate experiments.
Ⅲ. Results
1. In vivo experiment
(1). Improvement of skin lesions in BCL-treated
hairless mice
Previous study has demonstrated that the barrier function of the skin at lesional sites in AD patients is deficient50. We thus examined the effect of
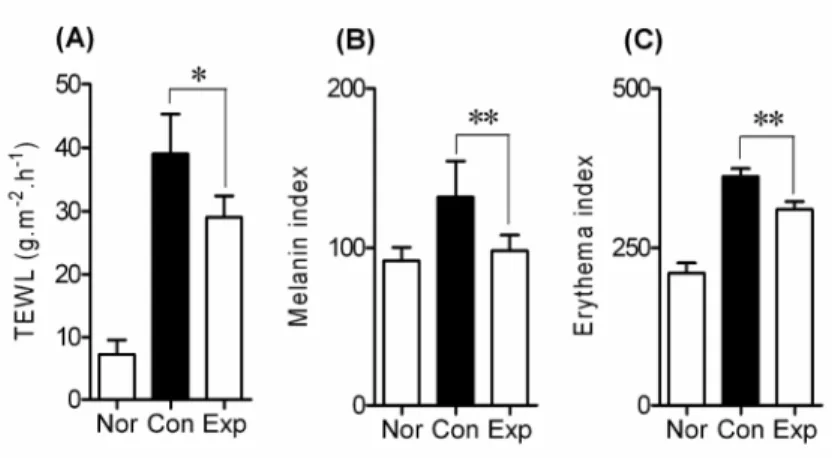
BCL on DNCB-induced skin lesions in hairless mice. TEWL was measured as a marker of barrier function. DNCB greatly increased TEWL to 39.06 ± 6.24 g.m-2.h-1, whereas it was significantly reduced to 29.08 ± 3.34 g.m-2.h-1 by the
transdermal administration of BCL (p<0.05) (Fig. 2A). Furthermore, the melanin index and erythema of AD-like skin lesions in the Exp group decreased significantly in comparison with non-BCL-treated hairless mice in the Con group (both p<0.01; Figs. 2B and C).
Fig. 2. Improvement in skin lesions in hairless mice treated with BCL. The
amount of transepidermal water loss (TEWL) (A), melanin index (B) and erythema (C) in the dorsal skin of hairless mice was evaluated. 0.5% DNCB was applied to the dorsal skin of hairless mice in both the control (Con) and experimental (Exp) groups for 5 weeks in addition to the first week of challenge with 1% DNCB to elicit AD-like skin lesions. BCL was applied to Exp group from the 2nd week until the end of the experiment. Values are expressed as mean ± SEM. *p<0.05, **p<0.01.
(2). Observation of the skin surface using electron
microscopy
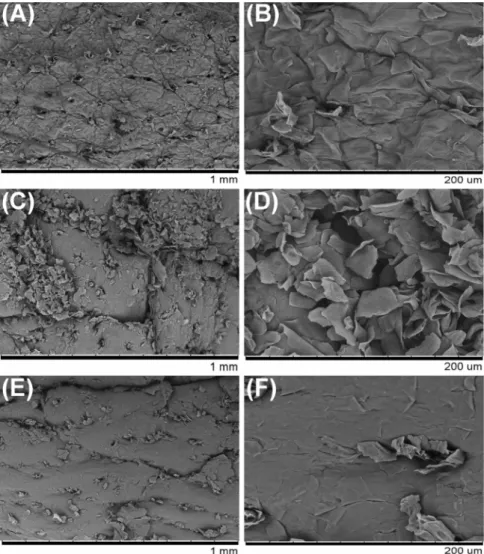
Changes in epidermal skin lesions in the hairless mice were also examined using a scanning electron microscopy (SEM). The skin surface appeared to be smooth in the Nor group (Figs. 3A and B). However, the skin surface was remarkably rough and rugged in mice with DNCB-induced skin lesions (Con and Exp groups, Figs. 3C-F). Interestingly, our results showed that the roughness of the skin surface was markedly suppressed by BCL in the Exp group (Figs. 3E-F).
Fig. 3. Scanning electron micrographs of skin lesions in hairless mice. Skin
tissue was obtained from hairless mice at the end of the experiment. The Nor group was treated with distilled water (A, B), while the Con group received DNCB alone (C, D), and the Exp group was treated with DNCB and BCL (E, F) (magnification = 100× and 500×).
(3). Effect of BCL on the production of serum
leukocytes in hairless mice
Leukocytes play an important role in inflammation1, 2, 51. We therefore
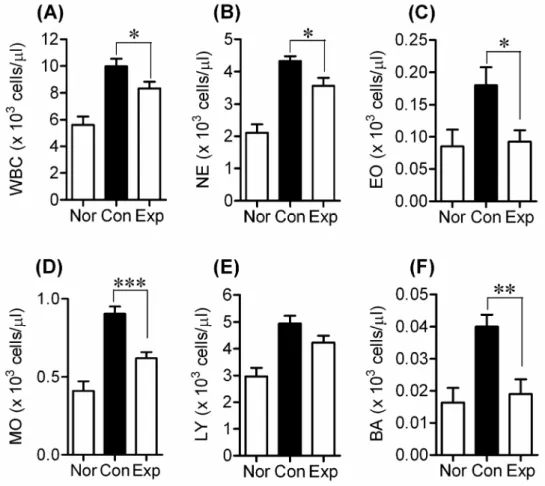
measured the amount of various serum leukocyte species (WBC, NE, EO, MO, LY, and BA) in DNCB-treated hairless mice, and found that DNCB application increased the amount of leukocytes. In contrast, BCL significantly decreased the numbers of all DNCB-induced leukocyte species, with the exception of LY (WBC, NE and EO, p<0.05; BA, p<0.01; MO, p<0.001) (Figs. 4A-D, F). The amount of LY in BCL-treated hairless mice was slightly lower than that in the DNCB-treated Con group, though this difference was not significant (Fig. 4E).
Fig. 4. Effects of BCL on the production of serum leukocytes in DNCB-induced hairless mice. Amount of (A) white blood cells (WBC), (B)
neutrophils (NE), (C) eosinocytes (EO), (D) monocytes (MO), (E) lymphocytes (LY) and (F) basicytes (BA) in the serum of hairless mice from different groups was evaluated at the end of experiment. Values are expressed as means ± SEM, *p<0.05, **p<0.01, ***p<0.001.
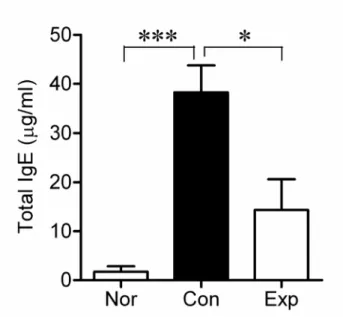
(4). Effect of BCL on serum IgE levels in
DNCB-treated mice
To examine whether BCL decreases the DNCB-induced increase in IgE level in hairless mice, serum IgE levels were measured by ELISA analysis. As shown in Fig. 5, serum IgE levels (38.26 ± 5.51 μg/ml) were elevated in the DNCB-treated group (Con) compared with the normal (Nor) group (p<0.001), whereas BCL remarkably reduced these IgE levels to 14.34 ± 6.31 μg/ml in the Exp group (p<0.05).
Fig. 5. Effects of BCL on serum IgE levels in DNCB-induced hairless mice.
The serum IgE levels in hairless mice were measured at the end of the experiment using an ELISA kit. Transdermal administration of BCL significantly decreased serum IgE levels in DNCB-induced hairless mice. Values are means ± SEM. *p<0.05, ***p<0.001.
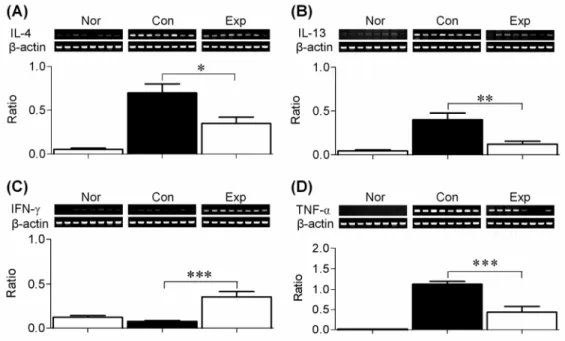
(5). Cytokine mRNA expression in BCL-treated
hairless mice
An imbalance between Th1 and Th2 responses is thought to underlie immune system diseases such as AD and asthma, which are characterized by Th2-dominated allergic inflammation19, 52, 53. We therefore examined changes
in the mRNA expression of Th1- and Th2-type cytokines in the spleen at the end of the experiment. Fig. 6 shows that BCL markedly suppressed the DNCB-induced mRNA expression of IL-4, IL-13, and TNF-α. Conversely, IFN-γ mRNA expression was increased in the Exp group compared to the Con group. These findings suggest that transdermal administration of BCL may modulate the DNCB -induced immune response in the skin of hairless mice.
Fig. 6. Cytokine mRNA expression in the spleen of hairless mice from the normal group (Nor), control group (Con), and experimental group (Exp).
The lower panel showed the mean ratio of cytokine to β-actin mRNA expression in the three groups. All values are means ± SEM. *p<0.05, **p<0.01, ***p<0.001. (A) IL-4, (B) IL-13, (C) IFN-γ, and (D) TNF-α.
2. In vitro experiment
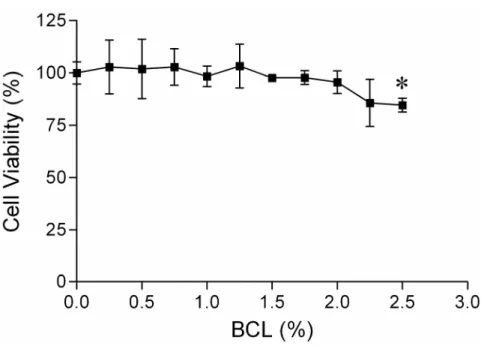
(1). Cell viability
The effect of BCL on the viability of HaCaT cells was examined using MTT assay. As shown in Fig. 7, BCL at 0-2% (v/v) had minimal effect on the viability of HaCaT cells, although it significantly reduced the viability at higher concentration of 2.5% after 24 h incubation. Therefore, 2% was determined as the maximum concentration of BCL for use throughout the following experiments.
Fig. 7. Effect of BCL on the viability of HaCaT cells. Cells were incubated
with indicated concentrations of BCL for 24 h and RPMI 1640 media was used as a negative control. Cell viability was then determined by an MTT assay. All values are presented as mean ± SEM of three experiments conducted in duplicate. *p<0.05 versus control cells incubated with media alone.
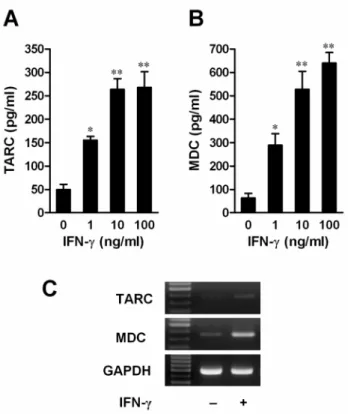
(2). IFN-γ induced the production of TARC and MDC
in HaCaT cells
We investigated the effect of IFN-γ on the production of TARC and MDC chemokines. HaCaT cells were incubated with medium alone or with IFN-γ at concentrations ranging from 1 to 100 ng/ml for 24 h. IFN-γ significantly increased secretion of TARC and MDC in HaCaT cells in a dose-dependent manner compared with control cells (Figs. 8A and B). Even at a concentration of 10 ng/ml, IFN-γ increased the secretion of TARC from a basal level of 50.03 ± 11.15 pg/ml to 263.6 ± 23.13 pg/ml (p<0.01), and of MDC from a basal level of 63.94 ± 19.17 pg/ml to 527.5 ± 77.37 pg/ml (p<0.01). The increase in protein secretion in HaCaT cells that had been incubated with IFN-γ (10 ng/ml) occurred in parallel with a significant increase in transcription of both chemokines after 12 h incubation (Fig. 8C).
Fig. 8. IFN-γ induced TARC (A) and MDC (B) release, and mRNA expression (C). Cells were incubated with or without IFN-γ at the indicated
concentrations. After 24 h, TARC (A) and MDC (B) release was analyzed by ELISA. Data are presented as the mean ± S.E.M. of three separate experiments conducted in duplicate, *p<0.05, **p<0.01 versus resting cells. (C) Cells were incubated with or without IFN-γ (10 ng/ml) for 12 h, and mRNA levels of chemokines and glyceraldehyde 3-phosphate dehydrogenase (GAPDH) were then analyzed by RT-PCR.
(3). BCL decreased IFN-γ-induced production of
TARC and MDC
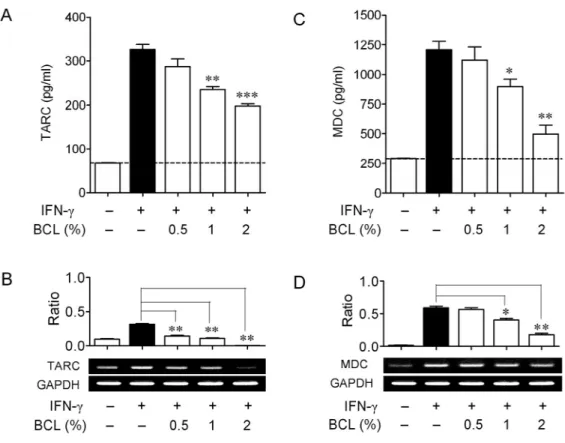
To evaluate the effect of BCL on the expression of these two chemokines, HaCaT cells were incubated with IFN-γ (10 ng/ml) in the presence or absence of BCL with indicated concentrations. After 24 h, the expression of these two chemokines was analyzed with ELISA and RT-PCR, respectively. Fig. 9A shows that BCL (0.5%-2%) suppressed IFN-γ-stimulated TARC release in a dose-dependent manner. IFN-γ greatly induced TARC release (326.6 ± 11.20 pg/ml) from HaCaT cells, and this release was reduced to 235.3 ± 6.948 pg/ml (p<0.01) and 198.2 ± 4.977 pg/ml (p<0.001) by treatment of BCL at 1% and 2%, respectively. Similarly, BCL dose-dependently suppressed IFN-γ-stimulated mRNA expression of TARC (Fig. 9B). In a way similar to TARC, MDC expression was significantly suppressed at both transcriptional and post-transcriptional levels with the treatment of BCL (Figs. 9C-D). Following this information, we next explored the potential signaling pathway by which BCL inhibits the expression of TARC and MDC in HaCaT cells.
Fig. 9. Effects of BCL on IFN-γ-induced production of TARC and MDC in HaCaT cells. Cells were incubated with IFN-γ (10 ng/ml) in the presence
or absence of BCL with indicated concentrations for 24 h. The release of TARC (A) and MDC (C) was analyzed with ELISA. Data are presented as mean ± SEM of three experiments conducted in duplicate. The dashed line represents the chemokine release in resting cells, *p<0.05, **p<0.01,
***p<0.001 versus IFN-γ. The mRNA expression of TARC (B) and MDC (D) was analyzed with RT-PCR after 12 h incubation. Representative results from three separate experiments are shown. Upper panel shows the signal intensity ratio between chemokines and GAPDH. The ratio in IFN-γ-stimulated cells was set as 100%. Data are presented as mean ± SEM of three separate experiments, *p<0.05, **p<0.01 versus IFN-γ.
(4). ROS contributed to IFN-γ-stimulated production
of TARC and MDC in HaCaT cells
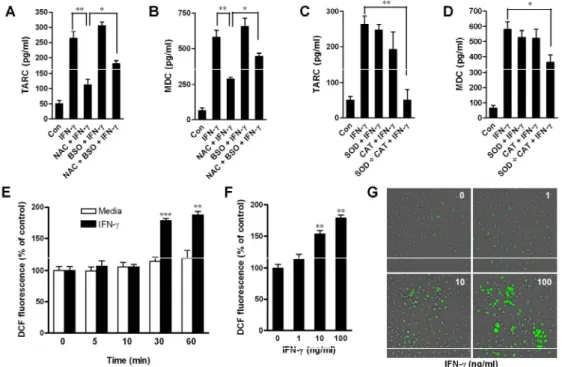
To test whether reactive oxygen species (ROS) is involved in IFN-γ-induced chemokine up-regulation, HaCaT cells were co-incubated with IFN-γ and a thiol antioxidant (5 mM NAC) and/or an inhibitor of glutathinone (GSH) synthesis (1 mM BSO), for 24 h, and subsequently analyzed for chemokine production. Our results indicated that treatment with NAC abrogated the stimulatory effect of IFN-γ on the release of TARC and MDC (Figs. 10A and B). On the other hand, although BSO did not significantly up-regulate the IFN-γ-induced production of these chemokines, it blocked the inhibitory effect of NAC on IFN-γ-induced chemokine production.
To investigate whether superoxide and hydrogen peroxide were involved in IFN-γ-induced chemokine production, cells were pre-treated with 100 units/ml superoxide scavenger (SOD) and hydrogen peroxide scavenger (CAT) alone or in combination (50 + 50 units/ml) during the 24 hour treatment with IFN-γ. SOD and CAT alone had little effect on IFN-γ-induced chemokine release (Figs. 10C and D). However, the combination of SOD and CAT abolished IFN-γ-induced production of TARC and MDC. Taken together, these results
strongly suggest that an increase in ROS contributes to the production of chemokines induced by IFN-γ.
To confirm that intracellular ROS generation could be increased by IFN-γ, we determined the fluorescence of dichlorofluorescein (DCF) as a measure of intracellular generation of ROS in HaCaT cells. A time course study revealed that IFN-γ (10 ng/ml) had no significant effect on intracellular ROS generation before a 30 min incubation time (Fig. 10E). However, exposure of HaCaT cells to IFN-γ for 30 min significantly increased the generation of ROS in a dose-dependent manner (Fig. 10F). Furthermore, typical green fluorescence indicative of the generation of ROS was also observed under the fluorescence microscope (Ex=488 nm, Em=525 nm, Olympus) (Fig. 10G). Taken together, these data indicated that IFN-γ induced ROS in human keratinocytes.
Fig. 10. Intracellular ROS generation contributed to IFN-γ-stimulated production of TARC and MDC in HaCaT cells. (A-D) ROS were involved
in production of TARC and MDC. Cells were incubated with media alone or with IFN-γ (10 ng/ml) in the absence or presence of NAC, BSO, SOD, or CAT for 24 h. TARC release (A and C) and MDC release (B and D) were then analyzed by ELISA. Data are presented as the mean ± S.E.M. of three separate experiments conducted in duplicate, *p<0.05, **p<0.01. (E-G) IFN-γ
increased intracellular ROS generation in HaCaT cells. (E) Cells were incubated with media alone or with IFN-γ (10 ng/ml) for the indicated times. Intracellular ROS generation was then examined using a DTX-880 multimode microplate reader. Data are presented as the mean ± S.E.M. of three separate experiments conducted in duplicate, **p<0.01, ***p<0.001 versus media alone. (F) Cells were incubated with IFN-γ (0-100 ng/ml) for 30 min. Intracellular ROS generation was then examined using a DTX-880 multimode microplate reader. The data are presented as the mean ± S.E.M. of three separate experiments conducted in duplicate, **p<0.01 versus resting cells. (G) Typical images of ROS generation (green fluorescence) were captured by fluorescence microscope (magnification=100×).
(5). H
2O
2-mimicked intracellular ROS contributed to
the production of TARC and MDC in HaCaT cells
To further explore the mechanism that ROS generation contributes the production of TARC and MDC in human keratinocytes, we mimicked the intracellular ROS generation using H2O2. HaCaT cells were incubated with
H2O2 at different concentrations (0-1000 μM) for 24 h, and chemokine
production was then examined with ELISA. As shown in Figs. 11A and B, H2O2 increased the release of TARC and MDC in a dose-dependent manner.
Even at lower concentration (10 μM), H2O2 significantly increased the release
of these two chemokines compared with resting cells (both p<0.01). Furthermore, real-time PCR data showed that the mRNA expression of these two chemokines was also significantly increased by H2O2 after 12 h incubation
(Figs. 11C and D). These findings suggest that H2O2-mimicked ROS
generation contributes to the production of TARC and MDC in human keratinocytes.
Fig. 11. H2O2 promoted chemokine production in HaCaT cells. Cells were incubated with H2O2 at the indicated concentrations. After 24 h, TARC (A)
and MDC (B) release was analyzed by ELISA. After 12 h, mRNA expression levels of TARC (C) and MDC (D) were analyzed by quantitative real-time PCR. Data are presented as the mean ± S.E.M. of three separate experiments conducted in duplicate, *p<0.05, **p<0.01 versus resting cells.
(6). The JAKs, p38 MAPK, and NF-кB pathway
contributes to the production of TARC and MDC in
HaCaT cells
IFN-γ can activate JAKs and MAPKs in different cell types, thereby inducing activation of downstream transcription factors and the transcription of target genes54-56. IFN-γ-induced TARC release (263.6 ± 23.13 pg/ml) was
significantly reduced by treatment with JAK1/2/3 inhibitor (JAK inhibitor I; 135.1 ± 32.30 pg/ml; p<0.01), JAK2 inhibitor (AG490; 158.5 ± 18.72 pg/ml; p<0.05), p38 MAPK inhibitor (SB203580; 87.30 ± 21.35 pg/ml; p<0.01), and NF-кB inhibitor (Bay11-7082; 82.69 ± 26.10 pg/ml; p<0.01) (Fig. 12A). Similarly, MDC release (579.2 ± 50.54 pg/ml) was also decreased by treatment with JAK inhibitor I (266.2 ± 28.40 pg/ml; p<0.01), AG490 (389.6 ± 18.96 pg/ml; p<0.05), SB203580 (283.6 ± 20.97 pg/ml; p<0.01), and Bay11-7082 (234.5 ± 10.16 pg/ml; p<0.01) (Fig. 12B). However, the release of these chemokines were not significantly affected following treatment with PD98059, SP600125, or MTA, inhibitors of ERK, JNK, or STAT1, respectively. Furthermore, the mRNA expression levels of these chemokines were markedly suppressed by the addition of JAK inhibitor I, AG490,
SB203580, and Bay11-7082 (Figs. 12C and D). These data suggested that JAKs, p38, and NF-кB signaling contributed to production of TARC AND MDC chemokines in IFN-γ-treated HaCaT cells.
JAKs may contribute to the p38/NF-кB pathway56. This prompted us to
investigate whether JAK inhibitor I and AG490 affect the activation of p38 MAPK and NF-кB in IFN-γ-treated HaCaT cells. We found a significant increase in the phosphorylation of p38 MAPK after 30 min incubation with IFN-γ. This increased phosphorylation was blocked by the addition of JAK inhibitor I or AG490 (Fig. 13A), suggesting that JAKs indeed contribute to the activation of the p38 MAPK pathway in HaCaT cells. Since the p65 subunit is the primary component of activated NF-кB, we studied the activation of NF-кB in IFN-γ-stimulated HaCaT cells by measuring the nuclear translocation of this p65 subunit by western blot27, 57. IFN-γ (10 ng/ml) greatly
increased basal nuclear translocation of NF-кB p65 compared to control cells, whereas the IFN-γ-induced nuclear translocation of NF-кB p65 was significantly suppressed following treatment with JAK inhibitor I, AG490, or SB203580 (Fig. 13B). These results indicate that JAKs contribute to NF-кB activation in HaCaT keratinocytes, at least partly through the p38 MAPK
pathway. To further investigate the dose-dependent effect of IFN-γ on NF-кB activation, nuclear translocation of NF-кB p65 subunit was determined using both western blots and immunocytochemistry. A 30 min incubation with IFN-γ (from 0 to 100 ng/ml) increased nuclear translocation of NF-кB p65 in HaCaT cells in a dose-dependent manner (Figs. 13C and D).
Fig. 12. JAKs, p38 MAPK and NF-кB pathways were involved in IFN-γ-induced chemokine production. Cells were incubated with IFN-γ (10
ng/ml) in the absence or presence of various pharmacological inhibitors (JI, 5 μM; AG, 5 μM; SB, 5 μM; SP, 5 μM; PD, 5 μM; MTA, 100 μM; Bay, 5 μM) for the indicated times. After 24 h, TARC (A) and MDC (B) release were analyzed by ELISA. After 12 h, mRNA expression levels of TARC (C) and MDC (D) were analyzed by quantitative real-time PCR. Data are presented as the mean ± SEM of three separate experiments conducted in duplicate, *p<0.05, **p<0.01 versus IFN-γ alone.
Fig. 13. JAKs contributed to p38/NF-κB pathway activation in IFN-γ-treated HaCaT cells. After 30 min, the whole-cell or nuclear proteins
were extracted. An equal amount of whole-cell protein (40 μg/lane) was subjected to western blot using antibodies against p38 MAPK and phospho-p38 MAPK (A). The activation level of p38 MAPK was evaluated by the ratio of the chemiluminescent signals of phospho-p38 and pan p38, compared to a level of 100% in IFN-γ-stimulated cells. Data are presented as
mean ± S.E.M. of three separate experiments, **p<0.01, ***p<0.001 versus IFN-γ alone. An equal amount of nuclear protein (40 μg/lane) was subjected to western blot using antibodies against NF-кB p65, and anti-poly(ADP-ribose) polymerase (PARP) antibody was used as a nuclear protein loading control (B). Nuclear levels of NF-кB p65 in IFN-γ-stimulated cells were set to 100%. Data are presented as the mean ± S.E.M. of three separate experiments, **p<0.01 versus IFN-γ alone. (C) Nuclear protein was subjected to western blot using antibodies against NF-кB p65 and PARP. Nuclear levels of NF-кB p65 in IFN-γ (100 ng/ml)-stimulated cells were set to 100%. Data are presented as the mean ± S.E.M. of three separate experiments, **p<0.01 versus resting cells. (D) After a 30 min incubation of cells with IFN-γ (0-100 ng/ml), nuclear translocation of NF-кB p65 was determined by immunocytochemistry using a fluorescence microscope (magnification=600×). To detect nuclei, the cells were stained with DAPI. (JI, JAK inhibitor I; AG, AG490; SB, SB203580; SP, SP600125; PD, PD98059; MTA, 5’-deoxy-5’-(methylthio)-adenosine; Bay, Bay11-7082)
(7). ROS promoted the p38 MAPK-independent
activation of NF-кB in IFN-γ-treated HaCaT cells
We next examined whether ROS affected the NF-кB activation that was involved in the release of TARC and MDC and in the increased expression of their mRNAs (Fig. 12). We used western blot to show that IFN-γ significantly increased the nuclear translocation of NF-кB p65 subunit at 30 min. NAC (5 mM) greatly decreased the nuclear levels of NF-кB p65, suggesting that it inhibited the IFN-γ-induced activation of NF-кB. The NF-кB inhibitor Bay11-7082 (5 μM) similarly suppressed IFN-γ-induced nuclear translocation of NF-кB. However, both H2O2 and BSO enhanced IFN-γ-induced nuclear
translocation of NF-кB (Fig. 14A). IFN-γ-induced phosphorylation of p38 was not affected by treatment with NAC, BSO, or H2O2 (Fig. 14B), suggesting that
the p38 MAPK pathway may not be involved in ROS-induced NF-кB activation in HaCaT cells. In addition, inhibitors of both JAKs and p38 MAPK pathways had no significant effect on intracellular ROS generation in IFN-γ-treated HaCaT keratinocytes (Figs. 15), suggesting that JAKs and p38 MAPK pathways were not involved in ROS generation in HaCaT cells.
production in HaCaT cells, we mimicked intracellular ROS generation using H2O2 and examined chemokine production and NF-кB activation in the
presence or absence of Bay11-7082, an inhibitor of NF-кB. H2O2 (100
μM)-induced chemokine production and NF-кB p65 nuclear translocation were markedly inhibited by Bay11-7082 (5 μM), suggesting that NF-кB signaling is involved in ROS-induced chemokine production (Fig. 16). We concluded that ROS and JAKs/p38 MAPK independently promoted the activation of NF-кB, thereby increasing production of TARC and MDC in HaCaT cells.
Fig. 14. ROS promoted nuclear translocation of NF-кB p65 independent of the p38 MAPK pathway. Cells were incubated for 30 min with IFN-γ (10
ng/ml) in the absence or presence of NAC (5 mM), BSO (1 mM), H2O2 (100
μM), Bay (5 μM), or SB (5 μM). An equal amount of nuclear protein (40 μg/lane) was subjected to western blot using antibodies against NF-кB p65, and PARP antibody was used as a nuclear protein loading control (A). Nuclear levels of NF-кB p65 in IFN-γ-stimulated cells were set to 100%. Data are presented as the mean ± S.E.M. of three separate experiments, *p<0.05, **p<0.01 versus IFN-γ alone. An equal amount of whole-cell protein (40
μg/lane) was subjected to western blot using antibodies against p38 MAPK and phospho-p38 MAPK (B). The ratio of the chemiluminescent signal of phospho-p38 and pan p38 was set to 100% in IFN-γ-stimulated cells. Data are presented as mean ± S.E.M. of three separate experiments, *p<0.05 versus IFN-γ alone.
Fig. 15. JAKs and p38 MAPK pathway were not involved in IFN-γ-induced ROS generation. Cells were incubated with IFN-γ (10 ng/ml)
in the presence or absence of JI (5 μM), AG (5 μM), SB (5 μM), Bay (5 μM), NAC (5 mM), or BSO (1 mM) for 30 min. Intracellular ROS generation was
then examined using a DTX-880 multimode microplate reader (A). The data are presented as the mean ± S.E.M. of three separate experiments conducted in duplicate, *p<0.05, **p<0.01 versus IFN-γ alone. (B) Typical images of ROS generation (green fluorescence) were captured by fluorescence microscope (magnification=100×).
Fig. 16. NF-кB was involved in ROS-mediated chemokine production in HaCaT cells. Cells were incubated with H2O2 (100 μM) in the presence or absence of Bay11-7082 (5 μM) for the indicated time. After 24 h, TARC (A) and MDC (B) release was analyzed by ELISA. Data are presented as the mean ± S.E.M. of three separate experiments conducted in duplicate, *p<0.05, **p<0.01 versus H2O2-treated cells. After 30 min, NF-кB p65 nuclear
translocation was determined by western blot (C, **p<0.01 versus H2O2-treated cells) and immunocytochemistry (D, magnification=600×).
(8). Effect of ROS on IkB phosphorylation and
degradation
To further explore the underlying molecular mechanisms contributing to ROS-induced activation of NF-кB in HaCaT cells, we investigated the effect of ROS on the degradation and phosphorylation of IкB, a cytosolic inhibitor of NF-кB. Whole cell lysates were subjected to western blotting after a 30 min incubation period with IFN-γ. We found that IFN-γ (10 ng/ml) significantly induced the degradation of IкB-α, which could in turn be blocked by the addition of NAC. However, both H2O2 and BSO strongly enhanced
IFN-γ-induced degradation of IкB-α (Fig. 17A). Since degradation of IkB-α depends primarily on phosphorylation, we determined whether IFN-γ modulated the phosphorylation of IkB-α. Given the rapid degradation of IkB-α, we incubated cells with IFN-γ in the presence of a proteasome inhibitor (ALLN). After 30 min, whole cell extracts were subjected to western blotting using phosphor-IkB-α antibodies. We found that IFN-γ significantly increased the phosphorylation of IkB-α compared to resting cells, and that this increased phosphorylation was reversed by the addition of NAC (Fig. 17B). Furthermore, both H2O2 and BSO promoted IFN-γ-induced phosphorylation
of IkB-α. These results suggested that intracellular ROS generation contributed, at least in part, to TARC and MDC production through the IkB/NF-кB pathway in IFN-γ-treated HaCaT keratinocytes.
Fig. 17. Effect of ROS on IkB phosphorylation and degradation. (A) Cells
were incubated with IFN-γ (10 ng/ml) for 30 min. Whole-cell extracts were prepared and analyzed by western blot using antibodies against IкB-α. β-actin was used as a loading control. IкB-α levels were set to 100% in IFN-γ-treated cells. Data are presented as mean ± SEM of three separate experiments, *p<0.05, **p<0.01 versus IFN-γ alone. (B) Cells were pre-treated with 50 μg/ml ALLN for 20min, and were then exposed to IFN-γ (10 ng/ml) for 30 min. Whole-cell extracts were prepared and analyzed by western blot using antibodies against phospho-IkB-α, and β-actin was used as a loading control. Phospho-IkB-α levels were set to 100% in IFN-γ-treated cells. Data are presented as mean ± SEM of three separate experiments, *p<0.05, **p<0.01 versus IFN-γ alone.
(9). BCL suppressed the activation of NF-кB via IкB,
but not via p38 pathway
We thus examined the effect of BCL on the activation of p38 MAPK, NF-кB, and IкB pathways in IFN-γ-stimulated HaCaT cells. The activation of p38 MAPK results in phosphorylation at threonine and tyrosine residues of this kinase58. In this study, the phosphorylation of p38 MAPK was induced
following 30 min incubation with IFN-γ (10 ng/ml), and this phosphorylation was not affected by BCL (2%) treatment. However, the specific inhibitor of p38 MAPK, SB203580, significantly suppressed the phosphorylation of p38 MAPK (Fig. 18A).
On the other hand, the p65 subunit is the primary component of activated NF-кB, the activation of NF-кB in IFN-γ-stimulated HaCaT cells was studied by measuring the nuclear translocation of NF-кB subunit p65 by western blot. IFN-γ significantly increased the nuclear translocation of NF-кB p65 at 30 min. BCL (2%) decreased the nuclear levels of NF-кB p65 by approximately 60% in IFN-γ-stimulated HaCaT cells (p<0.01) (Fig. 18B). In a manner similar to BCL, the NF-кB inhibitor, Bay11-7082, suppressed IFN-γ-induced nuclear translocation of NF-кB by approximately 85% (Fig. 18B).
Furthermore, the inhibitory effect of BCL on IFN-γ-induced nuclear translocation of NF-кB p65 was also observed using immunocytochemistry analysis (Fig. 18C). Collectively, these findings strongly suggest that BCL can inhibit the activation of NF-кB in HaCaT cells.
We subsequently examined the potential effect of BCL on the degradation and phosphorylation of IкB as described above. After 30 min incubation, our Western blotting results showed that BCL (2%) markedly blocked IFN-γ (10 ng/ml)-induced degradation of IкB-α (p<0.01) (Fig. 18D). In addition, IFN-γ-induced phosphorylation of IkB-α was also significantly suppressed by the addition of 2% BCL (p<0.05) (Fig. 18E). Taken together, BCL could suppress the activation of NF-кB through IkB-α signaling, but not through p38 MAPK signaling in HaCaT cells.
Fig. 18. BCL suppressed the activation of NF-кB via IкB, but not via p38 pathway. Cells were incubated for 30 min with IFN-γ (10 ng/ml) in the
absence or presence of BCL (2%). (A) An equal amount of whole-cell protein (40 μg/lane) was subjected to western blot using antibodies against p38 MAPK and phospho-p38 MAPK. The ratio of the chemiluminescent signal of phospho-p38 and pan p38 was set to 100% in IFN-γ-stimulated cells. Data are presented as mean ± SEM of three separate experiments, *p<0.05 versus IFN-γ alone. (B) An equal amount of nuclear protein (40 μg/lane) was
subjected to western blot using antibodies against NF-кB p65, and PARP antibody was used as a nuclear protein loading control. Nuclear levels of NF-кB p65 in IFN-γ-stimulated cells were set to 100%. Data are presented as the mean ± SEM of three separate experiments, **p<0.01, ***p<0.001 versus IFN-γ alone. (C) Nuclear translocation of NF-кB p65 was determined by immunocytochemistry using a confocal microscope (magnification=600×). To detect nuclei, the cells were stained with DAPI. (D) Whole-cell extracts were prepared and analyzed by western blot using antibodies against IкB-α. β-actin was used as a loading control. IкB-α levels were set to 100% in IFN-γ-treated cells. Data are presented as mean ± SEM of three separate experiments, **p<0.01 versus IFN-γ alone. (E) Cells were pre-treated with 50 μg/ml ALLN for 20min, and were then exposed to IFN-γ (10 ng/ml) for 30 min. Whole-cell extracts were prepared and analyzed by western blot using antibodies against phospho-IkB-α, and β-actin was used as a loading control. Phospho-IkB-α levels were set to 100% in IFN-γ-treated cells. Data are presented as mean ± SEM of three separate experiments, *p<0.05 versus IFN-γ alone.