© 2017 Korean Breast Cancer Society. All rights reserved. http://ejbc.kr | pISSN 1738-6756
INTRODUCTION
Breast cancer is the second leading cause of malignancy among women worldwide, with an estimated 1.67 million new cases and 522,000 deaths in 2012 [1]. As a result of im- provements in early detection and treatment, the mortality
rate of breast cancer has continued to decline over the last two decades in many countries worldwide. However, the 5-year relative survival rate for metastatic breast cancer remains rela- tively low [2]. On the molecular level, breast cancer encom- passes a heterogeneous group of diseases with distinct clinical differences in prognosis and response to therapy [3,4]. Estro- gen receptor (ER), progesterone receptor, and human epider- mal growth factor receptor 2 (HER2) statuses are widely used as biomarkers to aid in treatment selection and prediction of prognosis in patients with breast cancer. For example, the use of HER2 as a predictive biomarker has been successful in the treatment of HER2-enriched tumors with trastuzumab [5].
Despite the remarkable clinical response achieved with the use of biomarkers such as HER2, there is still a critical need for better prognostic and therapeutic biomarkers for efficient treatment of breast cancer. Recently, gene signatures such as the 70-gene signature [6], wound-response gene signature [7],
Overexpression of Uridine-Cytidine Kinase 2 Correlates with Breast Cancer Progression and Poor Prognosis
Guosong Shen*, Pingya He*, Yingying Mao1, Peipei Li2, Frank Luh3,4, Guohui Ding5, Xiyong Liu3, Yun Yen6
Prenatal Diagnostic Center, Huzhou Women and Children Hospital, Huzhou; 1Department of Epidemiology and Biostatistics, School of Basic Medical Sciences, Zhejiang Chinese Medical University, Hangzhou; 2Hangzhou Hope Biotechnology Company, Hangzhou, China; 3Biomarkers Development, California Cancer Institute, Sino-American Cancer Foundation, Temple City, USA; 4General Medicine Division, College of Medicine, Taipei Medical University, Taipei, Taiwan; 5Key Lab of Computational Biology, CAS-MPG Partner Institute for Computational Biology, Shanghai Institutes for Biological Sciences, Chinese Academy of Sciences, Shanghai, China; 6Integrated Laboratory, Center of Translational Medicine, Taipei Medical University, Taipei, Taiwan
ORIGINAL ARTICLE
Purpose: Uridine-cytidine kinase (UCK) 2 is a rate-limiting enzyme involved in the salvage pathway of pyrimidine-nucleotide biosyn- thesis. Recent studies have shown that UCK2 is overexpressed in many types of cancer and may play a crucial role in activating antitumor prodrugs in human cancer cells. In the current study, we evaluated the potential prognostic value of UCK2 in breast cancer. Methods: We searched public databases to explore as- sociations between UCK2 gene expression and clinical parame- ters in patients with breast cancer. Gene set enrichment analysis (GSEA) was performed to identify biological pathways associated with UCK2 gene expression levels. Survival analyses were per- formed using 10 independent large-scale breast cancer microar- ray datasets. Results: We found that UCK2 mRNA expression was elevated in breast cancer tissue compared with adjacent nontumorous tissue or breast tissue from healthy controls. High
UCK2 levels were correlated with estrogen receptor negativity (p<0.001), advanced tumor grade (p<0.001), and poor tumor differentiation (p<0.001). GSEA revealed that UCK2-high breast cancers were enriched for gene sets associated with metasta- sis, progenitor-like phenotypes, and poor prognosis. Multivariable Cox proportional hazards regression analyses of microarray datasets verified that high UCK2 gene expression was associated with poor overall survival in a dose-response manner. The prognostic power of UCK2 was superior to that of TNM staging and comparable to that of multiple gene signatures. Conclusion:
These findings suggest that UCK2 may be a promising prognos- tic biomarker for patients with breast cancer.
Key Words: Biomarkers, Breast neoplasms, Prognosis, Uridine-cytidine kinase 2
Correspondence to: Yingying Mao
Department of Epidemiology and Biostatistics, School of Basic Medical Sciences, Zhejiang Chinese Medical University, 548 Binwen Road, Hangzhou 310053, China
Tel: +86-571-8663-3305, Fax: +86-571-8663-3305 E-mail: [email protected]
*These authors contributed equally to this work.
This work was supported by grants from Natural Science Foundation of Zhejiang Province (LQ15H260001), National Natural Science Foundation of China (81602917), and Rencai Program of Zhejiang Chinese Medical University (2014ZR06).
Received: November 4, 2016 Accepted: May 6, 2017
Cancer
and 21-gene recurrence score [8] have been developed to pre- dict patient outcomes. These multiple-gene-based signatures potentially increase prediction accuracy, but the disadvantages include the high cost of testing and lack of specific targets for chemotherapeutic agents.
UCK2, located on chromosome 1q22-23.2, was initially identified as human testis-specific gene TSA903. It encodes uridine-cytidine kinase (UCK) 2, which is a rate-limiting en- zyme involved in the salvage pathway of pyrimidine-nucleo- tide biosynthesis. UCK2 catalyzes the phosphorylation of uri- dine and cytidine to form uridine monophosphate (UMP) and cytidine monophosphate (CMP) with efficiency 15- to 20-fold higher than that of ubiquitously expressed isozyme UCK1 [9].
It also catalyzes the phosphorylation of several cytotoxic ribo- nucleoside analogs that have been investigated for possible use as chemotherapeutic agents for cancer treatment [10]. In add- ition, UCK2 may be important for the pharmacological activa- tion of uridine and cytidine base analogs, such as the clinically used analog 5-fluorouracil (5-FU). The level of UCK2 activity may be associated with cellular sensitivity to the nucleoside an- alogs, as loss of UCK2 activity has been observed in cells resis- tant to the nucleoside analogs [9]. Interestingly, several previ- ous studies have suggested that UCK2 activity is increased in cancer cells compared with normal tissue [11,12].
In the current study, we performed expression profiling analyses of UCK2 in breast cancer using publicly available da- tabases and microarray datasets. We found that UCK2 expres- sion was correlated with clinical parameters in patients with breast cancer, and its prognostic value was superior to TNM staging and comparable to multiple gene signatures.
METHODS
Differential expression of UCK2 gene in breast cancer tissues We first searched the Oncomine database (http://www.on- comine.org; accessed on October 6th, 2015) using key words gene: “UCK2,” cancer type: “breast cancer” and analysis type:
“cancer vs. normal” to assess whether UCK2 expression was al- tered in breast cancer tissue. The search returned a total of 80 comparisons in 15 breast cancer studies. Details regarding tis- sue collection and the experimental protocol of each study can be found in the Oncomine database or the original publica- tions. Additionally, one microarray dataset (E-TABM-276) [13]
was downloaded from the ArrayExpress database (http://www.
ebi.ac.uk/arrayexpress) to further examine UCK2 expression in malignant breast tumor tissue, adjacent tissue exhibiting non- proliferative change, adjacent normal tissue, and breast tissue from healthy controls undergoing reduction mammoplasties.
Associations of UCK2 gene expression with clinical outcome of patients with breast cancer
To investigate the associations of UCK2 expression with his- tological grades, molecular subtypes, and clinical outcomes of patients with breast cancer, we then searched the GOBO data- base (Gene Expression-based Outcome for Breast Cancer Online; http://co.bmc.lu.se/gobo; accessed on October 9, 2015), which included microarray profiling data from 1,881 patients with breast cancer [14]. To further evaluate the prog- nostic and predictive value of UCK2 expression in breast can- cer, 10 microarray datasets containing survival information of patients with breast cancer, including GSE1456 [15], GSE2034 [16], GSE4922 [17], GSE7390 [18], NKI [19], GSE10885 [20], GSE22226 [21], GSE24450 [22], GSE25066 [23], GSE53031 [24], and GSE58812 [25], were downloaded from the Gene Expression Omnibus. Detailed information regarding the mi- croarray datasets used in the survival analysis is summarized in Supplementary Table 1 (available online).
Gene set enrichment analysis
To evaluate the correlations between UCK2 expression and cancer-related pathways, gene set enrichment analysis (GSEA) was performed using the above mentioned breast cancer mi- croarray data sets. The detailed protocol for GSEA is available on the Broad Institute Gene Set Enrichment Analysis website (http://www.broad.mit.edu/gsea). Briefly, GSEA is a computa- tional method that determines whether a priori defined set of genes shows statistically significant, concordant differences be- tween two biological states [26]. Data sets and phenotype label files were created and loaded into GSEA software (v2.0.13;
Broad Institute, Cambridge, USA). The gene sets were down- loaded from the Broad Institute website. The phenotype label was UCK2-high versus UCK2-low. The number of permuta- tions was set to 1000. A ranked-list metric was generated by calculating the signal-to-noise ratio, which is based on the dif- ference of means scaled according to the standard deviation.
Statistical analyses
All statistical analyses were performed using SAS statistical software, version 9.2 (SAS Institute Inc., Cary, USA), unless otherwise noted. Student t-test and one-way analysis of vari- ance were used for continuous data analyses, and Pearson chi- square test was used for categorical data analyses. UCK2 ex- pression levels were stratified into four categories (Q1, Q2, Q3, and Q4) based on the quartile distribution in the individ- ual studies, with the lowest quartile as the reference group (Q1). The overall survival (OS) period was calculated as the time from initial surgery to the date when the patient was last seen. The disease-free survival (DFS) period was defined as
the time from initial surgery until tumor recurrence, includ- ing local relapse and metastatic progression. Kaplan-Meier survival analysis was used to plot the proportions of the popu- lation that were alive (OS) or cancer-free (DFS) by the length of follow-up. Hazard ratios (HR) with 95% confidence inter-
vals (CI) were calculated using multivariable Cox proportion- al hazards regression models to examine the association of UCK2 expression levels with patient survival. Two-sided p- values less than 0.05 were considered statistically significant.
Figure 1. Expression analyses of UCK2 gene in patients with breast cancer. (A) UCK2 expression in breast cancer tissues relative to controls from the Oncomine database. Analyses showing p-values <10–5 and fold change values >|2| are marked in red. The size of the circle is scaled by the sample size of the corresponding analysis. (B) One array study E-TABM-276 comparing UCK2 expression in breast tissues from patients with breast cancer to UCK2 expression in breast tissues from healthy controls was identified in the Array Express database. The median normalized log2 expres- sion values of UCK2 were 3.6 in breast tissues from healthy controls, 5.6 in tumor adjacent normal tissues, 6.4 in tissues exhibiting cystic change, and 7.4 in invasive breast cancer tissues. *Indicated p-value less than 0.05.
40 35 30 25 20 15 10 5 0
-6 -4 -2 0 2 4 6
Fold change -Log10 p-value
A 12
10 8 6 4 2 0
Healthy controls
* * *
*
Tumor adjacent normal Cystic change Invasive breast carcinoma ---UCK2 gene (median) [209825_s_at]
Log2 UCK2 gene expression
B
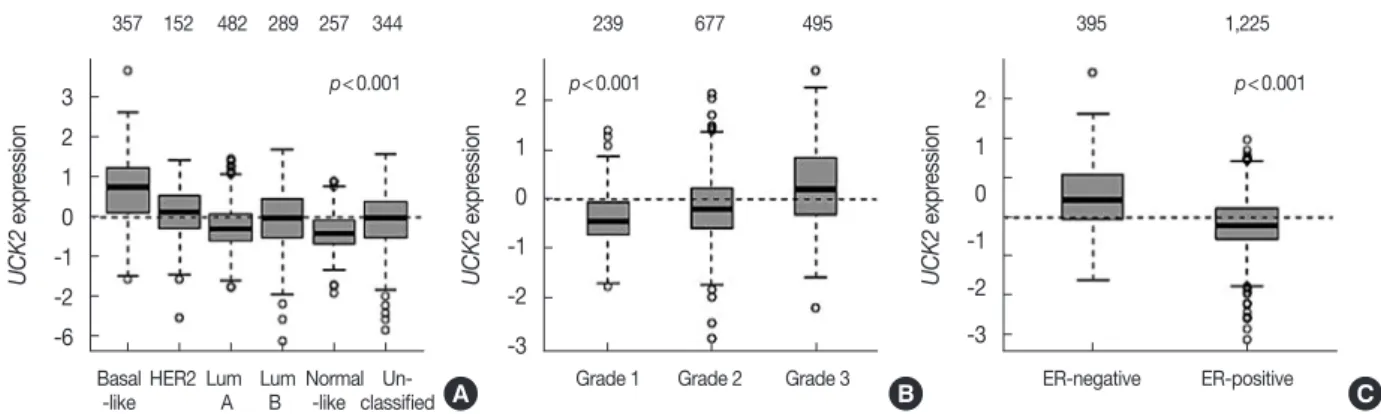
Figure 2. Association of UCK2 gene expression with tumor characteristics. UCK2 gene expression was associated with molecular subtypes (A), tu- mor grade (B) and estrogen receptor (ER) status (C) in patients with breast cancer using the GOBO (Gene Expression-based Outcome for Breast Cancer Online) database. The top row each figure indicates the number of patients with breast cancer in the analyses.
HER2=human epidermal growth factor receptor 2; Lum=luminal.
3 2 1 0 -1 -2 -6
2 1 0 -1 -2 -3
2 1 0 -1 -2 -3 Basal HER2 Lum Lum Normal Un-
-like A B -like classified Grade 1 Grade 2 Grade 3 ER-negative ER-positive
395 1,225
239 677 495 357 152 482 289 257 344
p<0.001 p<0.001 p<0.001
UCK2 expression UCK2 expression UCK2 expression
A B C
0.8 0.6 0.4 0.2 0
0
-0.2 -0.4
-0.6
1.0 0.5 0 -0.5
1.0 0.5 0 -0.5
0 2,500 5,000 7,500 10,000 12,500 0 2,500 5,000 7,500 10,000 12,500
Rank in ordered dataset Rank in ordered dataset
Naderi breast cancer prognosis (up) Landis breast cancer prognosis (down)
NES=2.10 NES=-1.87
p=0.000 p=0.014
Enrichment score Enrichment score
Ranked list metric Ranked list metric
A B
NES
-2.5 -2 -1.5 -1 -0.5 0 0.5 1 1.5 2 2.5 C
Figure 3. Enriched gene signatures asso- ciated with aggressiveness and prognosis in UCK2-high and -low breast cancers.
Normalized enrichment score (NES) rep- resents the NES for the gene-set enrich- ment analyses. The ranked list metric was generated by calculating the signal-to- noise ratio, which is based on the differ- ence of means scaled according to the standard deviation. The larger the signal- to-noise ratio, the more distinct the gene expression is for each phenotype. The heat maps show the enrichment of genes in the gene sets. Columns are individual samples and rows represent each gene.
Blue indicates a low level of expression, and red indicates a high level of expres- sion. (A, B) are the examples showing that UCK2 expression levels were in- versely associated with breast cancer prognosis, and (C) shows the genes co- expressed with UCK2 were enriched in biological pathways associated with tu- mor grade, molecular subtype, cancer in- vasiveness, metastasis, and prognosis.
RESULTS
Higher UCK2 gene expression in breast cancer tissues relative to controls
To explore whether UCK2 mRNA expression was altered in
breast cancer tissues, we searched the Oncomine database us- ing key words gene: “UCK2,” cancer type: “breast cancer,” and analysis type: “cancer vs. normal analysis.” The search re- turned a total of 80 array comparisons in 15 breast cancer studies. As shown in Figure 1A, UCK2 was frequently upregu-
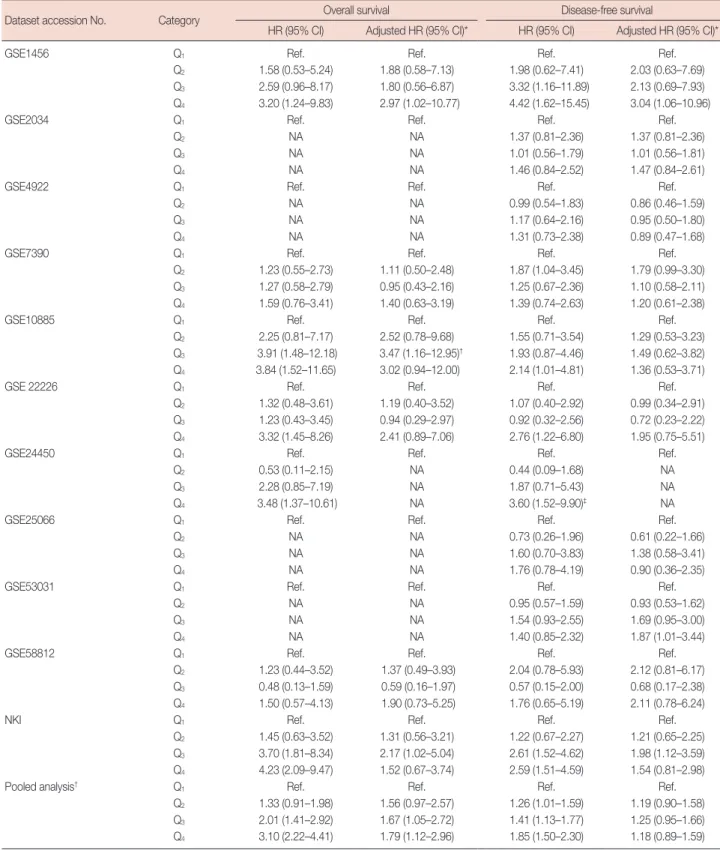
Table 1. Cox-proportional hazards regression analyses of UCK2 gene expression and breast cancer survival in 10 public microarray datasets
Dataset accession No. Category Overall survival Disease-free survival
HR (95% CI) Adjusted HR (95% CI)* HR (95% CI) Adjusted HR (95% CI)*
GSE1456 Q1 Ref. Ref. Ref. Ref.
Q2 1.58 (0.53–5.24) 1.88 (0.58–7.13) 1.98 (0.62–7.41) 2.03 (0.63–7.69) Q3 2.59 (0.96–8.17) 1.80 (0.56–6.87) 3.32 (1.16–11.89) 2.13 (0.69–7.93) Q4 3.20 (1.24–9.83) 2.97 (1.02–10.77) 4.42 (1.62–15.45) 3.04 (1.06–10.96)
GSE2034 Q1 Ref. Ref. Ref. Ref.
Q2 NA NA 1.37 (0.81–2.36) 1.37 (0.81–2.36)
Q3 NA NA 1.01 (0.56–1.79) 1.01 (0.56–1.81)
Q4 NA NA 1.46 (0.84–2.52) 1.47 (0.84–2.61)
GSE4922 Q1 Ref. Ref. Ref. Ref.
Q2 NA NA 0.99 (0.54–1.83) 0.86 (0.46–1.59)
Q3 NA NA 1.17 (0.64–2.16) 0.95 (0.50–1.80)
Q4 NA NA 1.31 (0.73–2.38) 0.89 (0.47–1.68)
GSE7390 Q1 Ref. Ref. Ref. Ref.
Q2 1.23 (0.55–2.73) 1.11 (0.50–2.48) 1.87 (1.04–3.45) 1.79 (0.99–3.30) Q3 1.27 (0.58–2.79) 0.95 (0.43–2.16) 1.25 (0.67–2.36) 1.10 (0.58–2.11) Q4 1.59 (0.76–3.41) 1.40 (0.63–3.19) 1.39 (0.74–2.63) 1.20 (0.61–2.38)
GSE10885 Q1 Ref. Ref. Ref. Ref.
Q2 2.25 (0.81–7.17) 2.52 (0.78–9.68) 1.55 (0.71–3.54) 1.29 (0.53–3.23) Q3 3.91 (1.48–12.18) 3.47 (1.16–12.95)† 1.93 (0.87–4.46) 1.49 (0.62–3.82) Q4 3.84 (1.52–11.65) 3.02 (0.94–12.00) 2.14 (1.01–4.81) 1.36 (0.53–3.71)
GSE 22226 Q1 Ref. Ref. Ref. Ref.
Q2 1.32 (0.48–3.61) 1.19 (0.40–3.52) 1.07 (0.40–2.92) 0.99 (0.34–2.91) Q3 1.23 (0.43–3.45) 0.94 (0.29–2.97) 0.92 (0.32–2.56) 0.72 (0.23–2.22) Q4 3.32 (1.45–8.26) 2.41 (0.89–7.06) 2.76 (1.22–6.80) 1.95 (0.75–5.51)
GSE24450 Q1 Ref. Ref. Ref. Ref.
Q2 0.53 (0.11–2.15) NA 0.44 (0.09–1.68) NA
Q3 2.28 (0.85–7.19) NA 1.87 (0.71–5.43) NA
Q4 3.48 (1.37–10.61) NA 3.60 (1.52–9.90)‡ NA
GSE25066 Q1 Ref. Ref. Ref. Ref.
Q2 NA NA 0.73 (0.26–1.96) 0.61 (0.22–1.66)
Q3 NA NA 1.60 (0.70–3.83) 1.38 (0.58–3.41)
Q4 NA NA 1.76 (0.78–4.19) 0.90 (0.36–2.35)
GSE53031 Q1 Ref. Ref. Ref. Ref.
Q2 NA NA 0.95 (0.57–1.59) 0.93 (0.53–1.62)
Q3 NA NA 1.54 (0.93–2.55) 1.69 (0.95–3.00)
Q4 NA NA 1.40 (0.85–2.32) 1.87 (1.01–3.44)
GSE58812 Q1 Ref. Ref. Ref. Ref.
Q2 1.23 (0.44–3.52) 1.37 (0.49–3.93) 2.04 (0.78–5.93) 2.12 (0.81–6.17) Q3 0.48 (0.13–1.59) 0.59 (0.16–1.97) 0.57 (0.15–2.00) 0.68 (0.17–2.38) Q4 1.50 (0.57–4.13) 1.90 (0.73–5.25) 1.76 (0.65–5.19) 2.11 (0.78–6.24)
NKI Q1 Ref. Ref. Ref. Ref.
Q2 1.45 (0.63–3.52) 1.31 (0.56–3.21) 1.22 (0.67–2.27) 1.21 (0.65–2.25) Q3 3.70 (1.81–8.34) 2.17 (1.02–5.04) 2.61 (1.52–4.62) 1.98 (1.12–3.59) Q4 4.23 (2.09–9.47) 1.52 (0.67–3.74) 2.59 (1.51–4.59) 1.54 (0.81–2.98)
Pooled analysis† Q1 Ref. Ref. Ref. Ref.
Q2 1.33 (0.91–1.98) 1.56 (0.97–2.57) 1.26 (1.01–1.59) 1.19 (0.90–1.58) Q3 2.01 (1.41–2.92) 1.67 (1.05–2.72) 1.41 (1.13–1.77) 1.25 (0.95–1.66) Q4 3.10 (2.22–4.41) 1.79 (1.12–2.96) 1.85 (1.50–2.30) 1.18 (0.89–1.59) HR=hazard ratio; CI=confidence interval; NA=not applicable.
*For multivariate analyses, HR was adjusted by age, estrogen receptor (ER) status, and Elston grade in GSE10885, GSE25066, GSE53031, GSE22226; for GSE1456, it was adjusted by Elston grade, ER and human epidermal growth factor receptor 2 status; for GSE2034, HR was adjusted by ER status. For GSE4922 and GSE7390, HR was adjusted by age, ER, Elston grade T stage and N stage. For GSE58812, HR was adjusted by age and ER. The NKI set was adjusted by age, grade, ER, tumor size, and lymph node status; †Pooled analysis was performed with adjustment for age, grade and ER status.
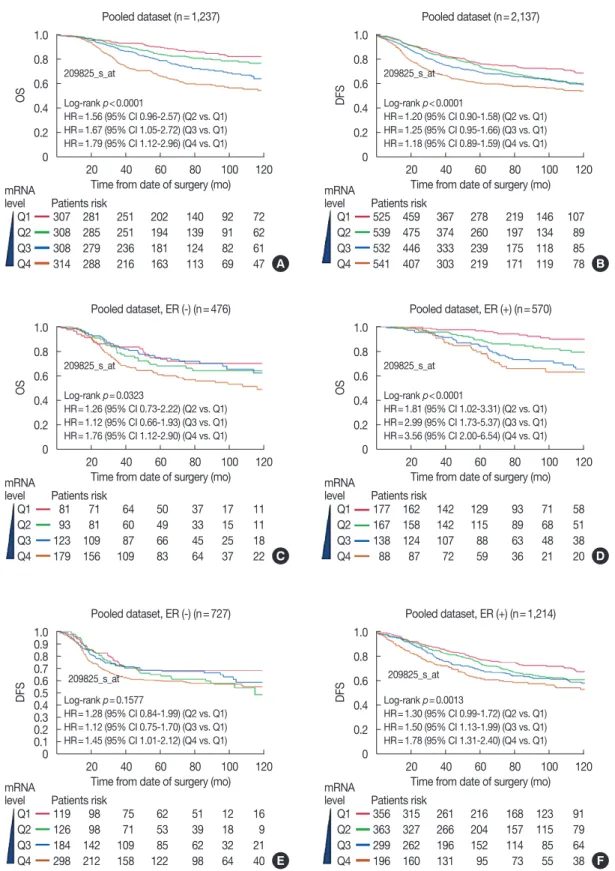
Figure 4. The prognostic significance of UCK2 in breast cancer. Multivariable Cox regression analyses of UCK2 with overall survival (OS) (A) and disease-free survival (DFS) (B) in patients with adjustment for age, grade and estrogen receptor (ER) status. Cox regression analyses of UCK2 with OS in patients with ER– (C) and ER+ (D) breast cancer, respectively. Multivariable analyses of UCK2 with DFS in patients with ER– (E) and ER+ (F) breast cancer, respectively. Hazard ratios (HRs) and 95% confidence intervals (CIs) were adjusted for age and grade for (C-F).
1.0 0.8 0.6 0.4 0.2 0
1.0 0.8 0.6 0.4 0.2 0
1.00.9 0.80.7 0.60.5 0.40.3 0.20.1 0
1.0 0.8 0.6 0.4 0.2 0
1.0 0.8 0.6 0.4 0.2 0
1.0 0.8 0.6 0.4 0.2 0 20 40 60 80 100 120
20 40 60 80 100 120
20 40 60 80 100 120
20 40 60 80 100 120
20 40 60 80 100 120
20 40 60 80 100 120 Time from date of surgery (mo)
Time from date of surgery (mo)
Time from date of surgery (mo)
Time from date of surgery (mo)
Time from date of surgery (mo)
Time from date of surgery (mo) Pooled dataset (n=1,237)
Pooled dataset, ER (-) (n=476)
Pooled dataset, ER (-) (n=727)
Pooled dataset (n=2,137)
Pooled dataset, ER (+) (n=570)
Pooled dataset, ER (+) (n=1,214) Patients risk
Patients risk
Patients risk
Patients risk
Patients risk
Patients risk 209825_s_at
209825_s_at
209825_s_at
209825_s_at
209825_s_at
209825_s_at Log-rank p<0.0001
HR=1.56 (95% CI 0.96-2.57) (Q2 vs. Q1) HR=1.67 (95% CI 1.05-2.72) (Q3 vs. Q1) HR=1.79 (95% CI 1.12-2.96) (Q4 vs. Q1)
Log-rank p=0.0323
HR=1.26 (95% CI 0.73-2.22) (Q2 vs. Q1) HR=1.12 (95% CI 0.66-1.93) (Q3 vs. Q1) HR=1.76 (95% CI 1.12-2.90) (Q4 vs. Q1)
Log-rank p=0.1577
HR=1.28 (95% CI 0.84-1.99) (Q2 vs. Q1) HR=1.12 (95% CI 0.75-1.70) (Q3 vs. Q1) HR=1.45 (95% CI 1.01-2.12) (Q4 vs. Q1)
Log-rank p<0.0001
HR=1.20 (95% CI 0.90-1.58) (Q2 vs. Q1) HR=1.25 (95% CI 0.95-1.66) (Q3 vs. Q1) HR=1.18 (95% CI 0.89-1.59) (Q4 vs. Q1)
Log-rank p<0.0001
HR=1.81 (95% CI 1.02-3.31) (Q2 vs. Q1) HR=2.99 (95% CI 1.73-5.37) (Q3 vs. Q1) HR=3.56 (95% CI 2.00-6.54) (Q4 vs. Q1)
Log-rank p=0.0013
HR=1.30 (95% CI 0.99-1.72) (Q2 vs. Q1) HR=1.50 (95% CI 1.13-1.99) (Q3 vs. Q1) HR=1.78 (95% CI 1.31-2.40) (Q4 vs. Q1) level
level
level
level
level
level Q1
Q2 Q3 Q4
Q1 Q2 Q3 Q4
Q1 Q2 Q3 Q4
Q1 Q2 Q3 Q4
Q1 Q2 Q3 Q4
Q1 Q2 Q3 Q4 307 281 251 202 140 92 72
308 285 251 194 139 91 62 308 279 236 181 124 82 61 314 288 216 163 113 69 47
81 71 64 50 37 17 11 93 81 60 49 33 15 11
123 109 87 66 45 25 18
179 156 109 83 64 37 22
119 98 75 62 51 12 16 126 98 71 53 39 18 9 184 142 109 85 62 32 21 298 212 158 122 98 64 40
525 459 367 278 219 146 107 539 475 374 260 197 134 89 532 446 333 239 175 118 85 541 407 303 219 171 119 78
177 162 142 129 93 71 58 167 158 142 115 89 68 51 138 124 107 88 63 48 38 88 87 72 59 36 21 20
356 315 261 216 168 123 91 363 327 266 204 157 115 79 299 262 196 152 114 85 64 196 160 131 95 73 55 38 mRNA
mRNA
mRNA
mRNA
mRNA
mRNA
OSOSDFS DFSOSDFS
A
C
E
B
D
F
Figure 5. The prognostic performances of UCK2 expression, the 70-gene signature, the wound-response gene signature, the 21-gene recurrence score, and the TNM staging in patients with estrogen receptor (ER)+ breast cancer in the NKI dataset using multivariable Cox proportional hazards re- gression models. (A) Overall survival (OS).(B) Disease-free survival (DFS).
HR=hazard ratio; CI=confidence interval; WR=wound-response.
26 25 24 23 22 21 20 2-1 2-2
26 25 24 23 22 21 20 2-1 2-2
Q1 Q2 Q3 Q4 G P Q A L M H I IIa IIb III-IV N P
Q1 Q2 Q3 Q4 G P Q A L M H I IIa IIb III-IV N P UCK2 70 Genes WR 21 Genes TNM stage MK167
UCK2 70 Ggenes WR 21 Genes TNM stage MK167 NKI dataset (ER+, n=225)
NKI dataset (ER+, n=225)
*p<0.05, †p<0.01
*p<0.05, †p<0.01
†
†
†
†
†
†
†
†
†
†
†
* *
†
†
HR of OS (95% CI)HR of DFS (95% CI)
A
B
lated in breast cancer tissue compared with breast tissue from healthy controls. When filtered by p<10–5 and fold change
>|2|, seven probe comparisons in three studies demonstrated significantly higher UCK2 expression in breast cancer tissue relative to controls. Moreover, in the study of E-TABM-276, the median expression level of UCK2 in invasive breast cancer tissue was higher compared to that in tissue exhibiting cystic changes (p=0.003), adjacent normal tissue (p<0.001), or breast tissue from healthy controls (p<0.001). Likewise, UCK2 expression in tumor-adjacent nonproliferative tissue was higher than that in adjacent normal tissue (p=0.009) or in breast tissue from healthy controls (p<0.001). Interestingly, tumor-adjacent normal tissue also expressed significantly higher levels of UCK2 than breast tissue drawn from healthy controls (p=0.008) (Figure 1B).
Association of UCK2 gene expression with clinical and pathological characteristics of patients with breast cancer
To further assess whether UCK2 expression was associated
with tumor stage, molecular subtype, and clinical outcome, we searched the GOBO database, which contained expression profiling data of 1,881 patients with breast cancer. As shown in Figure 2A, the search revealed that UCK2 was differentially expressed between breast cancer subtypes, with the highest level in basal-like tumors and the lowest in normal-like tu- mors (p<0.001). Higher UCK2 expression levels were associ- ated with ER-negative status (p<0.001) and more advanced tumor grade (trend p<0.001) (Figure 2B, C).
GSEA was performed to determine the associations be- tween UCK2 expression and cancer-related pathways. Subjects were sorted according to the expression level of UCK2 from low to high, and the microarray data was loaded into GSEA software. Figure 3A and B are examples showing that UCK2 expression levels were inversely associated with breast cancer prognosis. Genes co-expressed with UCK2 were enriched in biological pathways associated with tumor grade, molecular subtype, cancer invasiveness, metastasis, and prognosis (Fig- ure 3C). These findings suggest that overexpression of UCK2
might be associated with tumor aggressiveness and poor out- come in patients with breast cancer.
Prognostic significance of UCK2 gene in patients with breast cancer
We further analyzed the prognostic value of UCK2 in 10 publicly accessible microarray datasets with survival informa- tion of patients with breast cancer, using Kaplan-Meier curves and multivariable Cox proportional hazards regression mod- els. As shown in Table 1, higher UCK2 levels were correlated with poorer OS. Pooled analysis of the 10 microarray datasets revealed that, compared with those in the lowest quartile of UCK2 expression, the adjusted HRs for those in the second, the third, and the highest quartile of UCK2 expression were 1.56 (95% CI, 0.96–2.57), 1.67 (95% CI, 1.05–2.72), and 1.79 (95% CI, 1.12–2.96), respectively. Similar trends were ob- served for DFS, with borderline statistical significance. Strati- fication analyses also showed that UCK2 expression was asso- ciated with OS and DFS in patients with both ER-positive and ER-negative breast cancer (Figure 4). To further evaluate the prognostic value of UCK2, we compared its performance with that of TNM stages and multiple gene-based prognostic sig- natures, respectively. For ER-positive breast cancer, our analy- ses indicated that the prognostic value of UCK2 expression was superior to that of TNM staging and comparable to that of the 70-gene signature, the wound-response signature, and the 21-gene recurrence score in the NKI set (Figure 5).
DISCUSSION
Although high expression of UCK2 has been observed only in human placenta and testis, previous studies have also shown altered UCK2 expression in most human cancer cell lines [27]. However, no study has yet investigated the role of UCK2 in breast cancer. In the current study, we demonstrated that UCK2 is frequently upregulated in breast cancer tissue relative to controls. Compared with breast tissue drawn from healthy controls, the expression level of UCK2 was significant- ly increased in tumor-adjacent normal tissue, tissue exhibiting nonproliferative changes, and invasive breast cancer tissue.
Moreover, the expression levels of UCK2 differed between breast cancer subtypes, with the highest levels observed in basal-like tumors and the lowest in normal-like tumors. High UCK2 levels also correlated with ER-negative status, advanced tumor grade, and poor differentiation, as well as short survival time in patients with breast cancer. These data indicate that UCK2 is implicated in breast cancer progression and progno- sis, and suggest that it may operate as a potential oncogene.
However, additional analyses of atypical proliferative lesions
or ductal carcinoma in situ are warranted to further support this hypothesis.
While detailed mechanisms of the function of UCK2 in breast cancer remain incompletely understood, pharmacolog- ical studies have demonstrated that UCK2 is responsible for the phosphorylation and activation of 5-FU, an agent widely used in the therapy of solid tumors, including breast, colorec- tal, and head and neck cancers. Muhale et al. [28] showed that UCK2, along with other genes involved in the 5-FU anabolic pathway, produced a phenotype of cell sensitivity to 5-FU fol- lowing knockdown. Our stratified analysis using the NKI da- taset showed that among patients with stage II breast cancer, chemotherapy significantly improved DFS (p=0.008) and OS (p=0.050) in patients with UCK2-low expression, but not in those with UCK2-high expression (p=0.107 for OS and p=0.243 for DFS, respectively), a finding that might be attrib- uted to the sample size of the study. However, our analysis showed that chemotherapy significantly improved survival in patients with UCK2-low expression, a result inconsistent with previous findings that activity of UCK2 was required for che- mosensitivity. Possible explanations for these results include:
(1) chemotherapeutic agents such as 5-FU are not commonly used for treatment of breast cancers; (2) one of the major roles of UCK2 is converting uridine and cytidine into UMP and CMP, which are critical for the integrity of human cells; and (3) the association of UCK2 and chemosensitivity is only ob- served in the NKI dataset, and requires further validation in additional datasets. The potential mechanisms of UCK2 and drug sensitivity require further investigation.
Currently, prognostic factors such as primary tumor size, histological grade, lymph node stage, and hormone receptor status are routinely used in clinical practice to aid in treatment prediction and management of patients with breast cancer.
However, due to the heterogeneity of the disease, there is a critical need for additional prognostic and therapeutic bio- markers for efficient breast cancer treatment. Based on this systematic review and literature search for biomarkers for breast cancer prognosis, we found multiple genes that are be- ing validated for clinical use as prognostic tools. For example, the 70-gene signature, 21-gene recurrence score, core serum response signature, PI3K signature [29], and the grade signa- ture [17] have been used to predict the clinical outcome for patients with ER-positive breast cancer. These multiple gene- based signatures have been shown to improve the accuracy of prediction compared with TNM staging, but have also dra- matically increased diagnostic costs. Notably, in the current study we observed that the prognostic performance of UCK2 was superior to that of TNM staging and comparable to that of the above gene signatures for breast cancer, suggesting its
potential use as a cost-effective predictive biomarker for breast cancer progression and prognosis.
There are several limitations to this study, but there are also merits. The sample size of the study was relatively large, so the statistical power was superior to that of the majority of single center studies. Because the findings are mainly based on public microarray datasets with genome-wide expression profiling data, the selection bias was reduced to some extent. A major limitation is that the current observed associations were re- stricted to the mRNA level. We attempted to evaluate the asso- ciations of UCK2 protein levels with clinical and pathological characteristics of breast cancer in our tissue array samples us- ing immunohistochemistry assays. However, because the com- mercialized UCK2 antibody available at this point showed non-specific results, we failed to correlate expression on the protein level with patient outcomes. Moreover, the current study utilized individual-level UCK2 gene expression data from public databases generated by different platforms, and the absolute cutoff value of UCK2 is not universally defined and needs to be established in the future to allow application of UCK2 gene as a possible prognostic marker in daily clinical practice.
In summary, these findings show that UCK2 gene expres- sion levels were associated with breast cancer subtype, tumor stage, and ER status, as well as survival time, in patients with breast cancer, suggesting a critical role of UCK2 gene in breast cancer progression and prognosis. The prognostic perfor- mance of UCK2 gene was superior to that of the current pa- thology stages and comparable to that of the multiple gene- based signatures. Additional studies are warranted to further elucidate the exact role of UCK2 in breast cancer.
CONFLICT OF INTEREST
The authors declare that they have no competing interests.
ACKNOWLEDGMENTS
The authors thank Chris Schacht from the University of Nebraska Omaha for grammatical revision on the manu- script.
REFERENCES
1. Torre LA, Bray F, Siegel RL, Ferlay J, Lortet-Tieulent J, Jemal A. Global cancer statistics, 2012. CA Cancer J Clin 2015;65:87-108.
2. Siegel RL, Miller KD, Jemal A. Cancer statistics, 2015. CA Cancer J Clin 2015;65:5-29.
3. André F, Domont J, Delaloge S. What can breast cancer molecular sub- classification add to conventional diagnostic tools? Ann Oncol 2007;18
Suppl 9:ix33-6.
4. Brenton JD, Carey LA, Ahmed AA, Caldas C. Molecular classification and molecular forecasting of breast cancer: ready for clinical applica- tion? J Clin Oncol 2005;23:7350-60.
5. Romond EH, Perez EA, Bryant J, Suman VJ, Geyer CE Jr, Davidson NE, et al. Trastuzumab plus adjuvant chemotherapy for operable HER2- positive breast cancer. N Engl J Med 2005;353:1673-84.
6. van ‘t Veer LJ, Dai H, van de Vijver MJ, He YD, Hart AA, Mao M, et al.
Gene expression profiling predicts clinical outcome of breast cancer.
Nature 2002;415:530-6.
7. Chang HY, Nuyten DS, Sneddon JB, Hastie T, Tibshirani R, Sørlie T, et al. Robustness, scalability, and integration of a wound-response gene expression signature in predicting breast cancer survival. Proc Natl Acad Sci U S A 2005;102:3738-43.
8. Paik S, Shak S, Tang G, Kim C, Baker J, Cronin M, et al. A multigene as- say to predict recurrence of tamoxifen-treated, node-negative breast cancer. N Engl J Med 2004;351:2817-26.
9. Van Rompay AR, Norda A, Lindén K, Johansson M, Karlsson A. Phos- phorylation of uridine and cytidine nucleoside analogs by two human uridine-cytidine kinases. Mol Pharmacol 2001;59:1181-6.
10. Shimamoto Y, Koizumi K, Okabe H, Kazuno H, Murakami Y, Nakagawa F, et al. Sensitivity of human cancer cells to the new anticancer ribo-nu- cleoside TAS-106 is correlated with expression of uridine-cytidine ki- nase 2. Jpn J Cancer Res 2002;93:825-33.
11. Shen F, Look KY, Yeh YA, Weber G. Increased uridine kinase (ATP: uri- dine 5’-phosphotransferase; EC 2.7.1.48) activity in human and rat tu- mors. Cancer Biochem Biophys 1998;16:1-15.
12. Davidsson J, Andersson A, Paulsson K, Heidenblad M, Isaksson M, Borg A, et al. Tiling resolution array comparative genomic hybridiza- tion, expression and methylation analyses of dup(1q) in Burkitt lym- phomas and pediatric high hyperdiploid acute lymphoblastic leuke- mias reveal clustered near-centromeric breakpoints and overexpression of genes in 1q22-32.3. Hum Mol Genet 2007;16:2215-25.
13. Cheng AS, Culhane AC, Chan MW, Venkataramu CR, Ehrich M, Nasir A, et al. Epithelial progeny of estrogen-exposed breast progenitor cells display a cancer-like methylome. Cancer Res 2008;68:1786-96.
14. Ringnér M, Fredlund E, Häkkinen J, Borg Å, Staaf J. GOBO: gene ex- pression-based outcome for breast cancer online. PLoS One 2011;
6:e17911.
15. Smeds J, Miller LD, Bjöhle J, Hall P, Klaar S, Liu ET, et al. Gene profile and response to treatment. Ann Oncol 2005;16 Suppl 2:ii195-202.
16. Wang Y, Klijn JG, Zhang Y, Sieuwerts AM, Look MP, Yang F, et al. Gene- expression profiles to predict distant metastasis of lymph-node-nega- tive primary breast cancer. Lancet 2005;365:671-9.
17. Ivshina AV, George J, Senko O, Mow B, Putti TC, Smeds J, et al. Genetic reclassification of histologic grade delineates new clinical subtypes of breast cancer. Cancer Res 2006;66:10292-301.
18. Desmedt C, Piette F, Loi S, Wang Y, Lallemand F, Haibe-Kains B, et al.
Strong time dependence of the 76-gene prognostic signature for node- negative breast cancer patients in the TRANSBIG multicenter indepen- dent validation series. Clin Cancer Res 2007;13:3207-14.
19. van de Vijver MJ, He YD, van’t Veer LJ, Dai H, Hart AA, Voskuil DW, et al. A gene-expression signature as a predictor of survival in breast can- cer. N Engl J Med 2002;347:1999-2009.
20. Hennessy BT, Gonzalez-Angulo AM, Stemke-Hale K, Gilcrease MZ,
Krishnamurthy S, Lee JS, et al. Characterization of a naturally occurring breast cancer subset enriched in epithelial-to-mesenchymal transition and stem cell characteristics. Cancer Res 2009;69:4116-24.
21. Esserman LJ, Berry DA, Cheang MC, Yau C, Perou CM, Carey L, et al.
Chemotherapy response and recurrence-free survival in neoadjuvant breast cancer depends on biomarker profiles: results from the I-SPY 1 TRIAL (CALGB 150007/150012; ACRIN 6657). Breast Cancer Res Treat 2012;132:1049-62.
22. Heikkinen T, Greco D, Pelttari LM, Tommiska J, Vahteristo P, Heikkilä P, et al. Variants on the promoter region of PTEN affect breast cancer pro- gression and patient survival. Breast Cancer Res 2011;13:R130.
23. Itoh M, Iwamoto T, Matsuoka J, Nogami T, Motoki T, Shien T, et al. Es- trogen receptor (ER) mRNA expression and molecular subtype distri- bution in ER-negative/progesterone receptor-positive breast cancers.
Breast Cancer Res Treat 2014;143:403-9.
24. Azim HA Jr, Brohée S, Peccatori FA, Desmedt C, Loi S, Lambrechts D, et al. Biology of breast cancer during pregnancy using genomic profil- ing. Endocr Relat Cancer 2014;21:545-54.
25. Jézéquel P, Loussouarn D, Guérin-Charbonnel C, Campion L, Vanier A, Gouraud W, et al. Gene-expression molecular subtyping of triple-nega- tive breast cancer tumours: importance of immune response. Breast Cancer Res 2015;17:43.
26. Subramanian A, Tamayo P, Mootha VK, Mukherjee S, Ebert BL, Gillette MA, et al. Gene set enrichment analysis: a knowledge-based approach for interpreting genome-wide expression profiles. Proc Natl Acad Sci U S A 2005;102:15545-50.
27. Murata D, Endo Y, Obata T, Sakamoto K, Syouji Y, Kadohira M, et al. A crucial role of uridine/cytidine kinase 2 in antitumor activity of 3’-ethy- nyl nucleosides. Drug Metab Dispos 2004;32:1178-82.
28. Muhale FA, Wetmore BA, Thomas RS, McLeod HL. Systems pharma- cology assessment of the 5-fluorouracil pathway. Pharmacogenomics 2011;12:341-50.
29. Saal LH, Johansson P, Holm K, Gruvberger-Saal SK, She QB, Maurer M, et al. Poor prognosis in carcinoma is associated with a gene expression signature of aberrant PTEN tumor suppressor pathway activity. Proc Natl Acad Sci U S A 2007;104:7564-9.