Are traditional scoring systems for severity stratification of acute pancreatitis sufficient?
Thaddaeus Tan Jun Kiat1, Sivaraj K Gunasekaran2, Sameer P Junnarkar2, Jee Keem Low2, Winston Woon2, and Vishal G Shelat2
1Yong Loo Lin School of Medicine, National University of Singapore,
2Department of General Surgery, Tan Tock Seng Hospital, Singapore
Backgrounds/Aims: Ranson’s score (RS) and Glasgow score (GS) have been utilized to stratify the severity of acute pancreatitis (AP). The aim of this study was to validate RS and GS for stratifying the severity of acute pancreatitis and audit our experience of managing AP. Methods: We conducted a retrospective review of patients treated for AP from July 2009 to September 2016. Final severity was determined using the revised Atlanta classification. Mortality and complications were analyzed. Results: From July 2009 to September 2016, a total of 675 patients with a diagnosis of AP were admitted at the hospital. Of them, 669 patients who had sufficient data were analyzed. Their average age±SD was 58.7±17.4 years (range, 21-98 years). There was a male preponderance (n=393, 53.8%). A total of 82 (12.3%) patients had eventual severe pancreatitis. RS demonstrated a sensitivity of 92.7% and a specificity of 52.8%
with a positive predictive value (PPV) of 21.5% and a negative predictive value (NPV) of 98.1%. GS demonstrated a sensitivity of 76.8% and a specificity of 69.2% with a PPV of 25.8% and a NPV of 95.5%. For severity prediction, areas under the curve (AUCs) for RS and GS were 0.848 (95% CI: 0.819-0.875) and 0.784 (95% CI: 0.750-0.814), respectively (p=0.003). Twelve (1.6%) patients died in the hospital. Conclusions: RS has higher sensitivity, NPV and AUC for predicting severity of AP than GS. (Ann Hepatobiliary Pancreat Surg 2018;22:105-115)
Key Words: Glasgow score; Ranson score; Scoring; Severe acute pancreatitis
Received: December 18, 2017; Revised: February 7, 2018; Accepted: February 8, 2018 Corresponding author: Vishal G Shelat
Department of General Surgery, Tan Tock Seng Hospital, 11 Jalan Tan Tock Seng, 308433, Singapore Tel: +65-63577807, Fax: +65-63577809, E-mail: [email protected]
Copyright Ⓒ 2018 by The Korean Association of Hepato-Biliary-Pancreatic Surgery
This is an Open Access article distributed under the terms of the Creative Commons Attribution Non-Commercial License (http://creativecommons.org/
licenses/by-nc/4.0) which permits unrestricted non-commercial use, distribution, and reproduction in any medium, provided the original work is properly cited.
Annals of Hepato-Biliary-Pancreatic Surgery ∙ pISSN: 2508-5778ㆍeISSN: 2508-5859
INTRODUCTION
Acute pancreatitis (AP) with an incidence of 50-80 per 100,000 population is a common cause of acute abdomi- nal pain.1 Its management is influenced by etiology, se- verity, and local resources.2,3 SAP based the revised Atlanta classification4 occurs in 20% of AP cases. It has higher mortality rates than AP.5,6 To optimize outcomes, patients with predicted SAP should be identified early to allow prompt resuscitation, resource allocation, close monitoring, and timely interventions. For these patients, optimal prognostication allows clinicians to inform pa- tients and caregivers on heightened possibility of critical care requirement, increased length of stay with inter- ventions, higher hospital costs, and mortality. Hence, pre- dictive scoring systems are essential to AP management.
Many such systems exist. Ranson’s score (RS) and
Glasgow-Imrie (Glasgow) score (GS) have been tradition- ally used for severity stratification of AP.7,8 They have been widely validated for their prognostic utility.9-13
Despite their widespread use, both scores have been criticized for their limitations. A meta-analysis including 110 studies has reported that the predictive power of RS in clinical setting is insufficient for prognosticating new admissions.14 Another prospective study has evaluated 137 consecutive patients on admission and at 48 hours using RS, GS, and Acute Physiology and Chronic Health Evaluation (APACHE)-II score and found that none of them could achieve sufficient predictability when used alone.15
Both RS and GS scores have some limitations in clin- ical setting.16 Interpretation of blood glucose levels in dia- betic patients, urea levels in patients with renal dysfunc- tion, and redundancy of performing arterial blood gas
analysis in a healthy patient are some of their limitations.
It is not uncommon to find patients with predicted SAP clinically behaving as ‘mild’ AP. Furthermore, for patients clinically manifesting SAP, it is essential to have prompt treatment rather than waiting for 48 hours before full stratification. Both RS and GS have been criticized for their requirement of 48 hours for prediction. Many authors have reported prediction models that can provide risk stratification upon admission.17,18 Lastly, multivariable scoring is cumbersome to perform in routine clinical practice. To overcome these limitations, recent guidelines advocate the implementation of organ failure (OF)-based scoring systems.4,5 While it is ideal to predict severity ac- curately upon admission, this deviates from clinical truth.
Hence, experts now advocate 48 hours for OF-based scoring. Although OF-based scoring is being increasingly adopted worldwide, many units continue to use traditional scoring either exclusively or along with OF-based scores.
The search for an ideal scoring system continues. It re- mains our local practice to continue using traditional scor- ing systems along with OF-based systems. Conflicting evidence regarding the accuracy and predictive value of RS and GS brings to question their relevance to modern pancreatology. In addition, although presentation, etiol- ogy, and complications AP in a multi-ethnic population are more complex than those in other reported pop- ulations,19 few such studies exist. Therefore, the primary aim of this study was to validate RS and GS for stratify- ing the severity of acute pancreatitis in a local clinical set- ting and audit our experience of managing AP in a mul- ti-ethnic population.
MATERIALS AND METHODS
Methodology
A retrospective cohort study of all patients admitted for AP in the Department of General Surgery between July 2009 and September 2016 was conducted. All patients were prognosticated with RS and GS at 48 hours.
Demographic and clinical data were correlated with final severity outcome upon discharge. All patient data were re- viewed retrospectively to assign severity stratification ac- cording to the revised Atlanta classification.4 Patients with insufficient data to complete any of the three scores were considered for imputation or exclusion. Imputation of var-
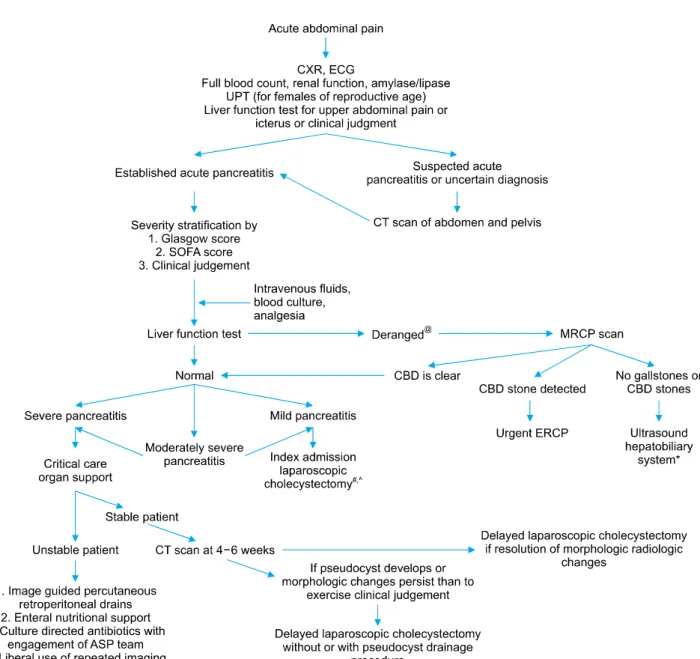
iables with up to 20% missing data was done by mean substitution of missing data. Variables with >20% miss- ing data were excluded from analysis. Electronic medical records were reviewed for demographic information, labo- ratory investigations, imaging, intervention history, mor- bidity, and mortality. Data on mortality and local compli- cations were collected and correlated with risk scores. Tan Tock Seng Hospital’s algorithm of management of AP is shown in Fig. 1. This study was approved by our Institutional Review Board.
Definitions
Diagnosis and severity stratification of AP were made in accordance with the revised Atlanta classification.4 The local laboratory did not measure amylase value in excess of 2000 units or lipase value in excess of 400 units.
Hence, for these two variables, maximum value was fixed as predetermined. We have adopted Atlanta classification in clinical practice since 2013. Atlanta classification sug- gests the use of modified Marshall score which defines organ failure as a score of ≥2 for one of the following three systems: respiratory, cardiovascular, and renal. In our department, patients treated for AP are routinely prog- nosticated via Sequential Organ Failure Assessment (SOFA) score. The SOFA score is a mortality prediction tool based on six organ systems. It is widely used as mor- tality stratification tool in intensive care units (ICU).20 While SOFA score is not widely adopted for severity stratification or prognostication of SAP, there is evidence of its utility within ICU.21 Analysis of severity strat- ification using SOFA was included for comparison along with RS and GS.
Etiology of acute pancreatitis
The following aetiologies were documented: gallstones, alcohol, hypertriglyceridemia, hypercalcemia, post endo- scopic retrograde cholangiopancreatography (ERCP), auto- immune, drug-induced, and idiopathic (Table 1).
Gallstone-associated AP was based on identification of gallstones on any form of imaging. Alcohol-associated AP was based on the presence of a recent alcoholic binge or regular high intake. Hypertriglyceridemia-associated AP was based on the presence of hypertriglyceridemia (TG, defined as serum TG >10 mmol/L) at the time of pre- sentation of AP. Autoimmune AP was diagnosed in ac-
Fig. 1. Tan tock seng hospital algorithm for management of acute pancreatitis. CXR, chest X-ray; ECG, electrocardiogram; FBC, full blood count; RP, renal panel; UPT, urine pregnancy test; LFT, liver function test; IVF, intravenous fluids; CT, Computed Tomography; CBD, common bile duct; ERCP, endoscopic retrograde cholangiopancreatography; MRCP, magnetic retrograde cholangiopancreatography; SOFA, sequential organ failure assessment; ASP, antibiotic stewardship programme. @Any form of elevation in bilirubin, alkaline phosphatase, or gamma glutamyl transferase is considered derangement. #Liberal practice of MRCP scan in preference to intraoperative cholangiography. *At least two imaging modalities are done prior to concluding non-biliary aetiology. All patients were offered endoscopic ultrasonography before diagnosis of idiopathic pancreatitis. ^Laparoscopic chol- ecystectomy is discussed with and offered to all patients with idiopathic pancreatitis.
cordance with the Mayo Clinic HISORt (Histology, Imaging, Serology, Other organ involvement, Response to steroid therapy, diagnostic criteria for autoimmune pan- creatitis) criteria.22 Hypercalcemia was designated as the etiology if serum ionized calcium was >1.3 mmol/L.
Drug-induced AP was diagnosed in the absence of the above common etiologies and in the presence of recent in- take of hydrochlorothiazide, statins, non-steroidal anti-in-
flammatory drugs (NSAIDs), and sulfa-based medication.
Idiopathic AP was diagnosed if no clear etiology was found. All patients should have at least two normal ab- dominal ultrasound scans or one ultrasound scan and one magnetic resonance cholangiopancreatography (MRCP) scan prior to excluding gallstone etiology. All patients were offered endoscopic ultrasound (EUS) prior to con- cluding idiopathic pancreatitis. All patients with idiopathic
Table 1. Demographic and clinical profile of patients with acute pancreatitis Characteristic Overall study population,
n=669 (%)
Mild to moderately
severe AP, n=587 (%) Severe AP, n=82 (%) p-value Mean/Median age (years)
Gender (n, %) Male
Ethnicity (n, %) Chinese Malay Indian Others
Comorbidities (n, %) Hypertension T2DM
Hyperlipidemia Ischaemic heart disease Cerebrovascular disease Renal impairment COPD
Asthma Others Medications
Immunosuppressed Steroids
Anticoagulants History of smoking (n, %)
History of alcohol consumption (n, %) Previous pancreatic disease (n, %) Chronic pancreatitis (n, %) Previous cholecystectomy (n, %) Etiology (n, %)
Gallstones Alcohol Idiopathic
Hypertriglyceridemia Autoimmune Hypercalcemia Drug induced Others
58.7±17.4 / 60 (21-98) 393 (53.8) 471 (64.5) 43 (5.9) 109 (14.9) 46 (6.3) 347 (51.9) 211 (31.5) 243 (36.3) 83 (12.4) 53 (7.9) 44 (6.6) 13 (1.9) 37 (5.5) 126 (18.8) 2 (0.3) 9 (1.3) 34 (5.1) 126 (18.8) 163 (24.3) 76 (11.4) 30 (4.5) 47 (6.4) 460 (68.8) 39 (5.8) 47 (7.0) 19 (2.8) 4 (0.6) 3 (0.4) 6 (0.9) 50 (7.5)
57.9±16.9 / 59 (21-95) 344 (53.1) 404 (62.3) 36 (5.6) 103 (15.9) 44 (7.5) 291 (49.6) 175 (29.8) 206 (35.1) 65 (11.1) 45 (7.7) 35 (6.0) 9 (1.5) 33 (5.6) 113 (19.3) 2 (0.3) 6 (1.0) 26 (4.4) 119 (20.2) 149 (25.3) 67 (11.4) 29 (4.9) 41 (7.0) 399 (68.0) 35 (6.0) 42 (7.2) 14 (2.4) 4 (0.7) 2 (0.3) 3 (0.5) 47 (8.0)
63.9±20.1 / 68 (21-98) 49 (59.8) 67 (81.7) 7 (8.5) 6 (7.3) 2 (2.4) 47 (65.3) 31 (43.1) 36 (50.0) 18 (22.0) 8 (9.8) 9 (11.0) 3 (4.2) 6 (8.3) 13 (15.9)
0 3 (3.7) 8 (9.8) 7 (8.5) 14 (17.0) 9 (11.0) 1 (1.2) 6 (7.3) 61 (74.4) 4 (4.9) 5 (6.1) 5 (6.1)
0 1 (1.2) 3 (3.7) 3 (3.7)
0.003 0.253 0.170
0.044 0.136 0.360 0.012 0.890 0.239 0.425 0.166 0.889 0.471 0.108 0.071 0.041 0.394 0.172 0.097 0.530 0.069 0.428 0.490 0.156 0.778 0.232 0.063 0.281 Rightmost column displays results of Chi-square test on demographic and comorbid factors. T2DM, type 2 diabetes mellitus;
COPD, chronic obstructive pulmonary disease. 41 (6%) patients, all of whom belonging to the mild or moderately-severe AP group had no recorded data on etiology. Eetiology, “others” includes AP attributed to choledochal cysts, microlithiasis, post-ERCP (endoscopic retrograde cholangiopancreaticography), common bile duct strictures and pancreatic divisum
pancreatitis were offered laparoscopic cholecystectomy.
Ranson’s score (RS)
First published in 1974,7 RS was based on 11 parameters. It requires 48 hours to complete scoring. SAP is considered when patients have a cumulative score of
≥3.
Glasgow score (GS)
GS was initially described by Blamey et al.8 in 1984 for severity prognostication of AP. It is scored at 48 hours
post-admission. SAP is considered when patients have a score of ≥3.
Comorbidities
In this study comorbidities included hypertension, type 2 diabetes mellitus (T2DM), hyperlipidemia, ischemic heart disease (IHD), cerebrovascular disease, renal impair- ment, chronic obstructive pulmonary disease (COPD), and asthma (Table 1). Hypertension was diagnosed based on the eighth Joint National Committee (JNC8) guidelines.
T2DM was diagnosed based on measured random serum
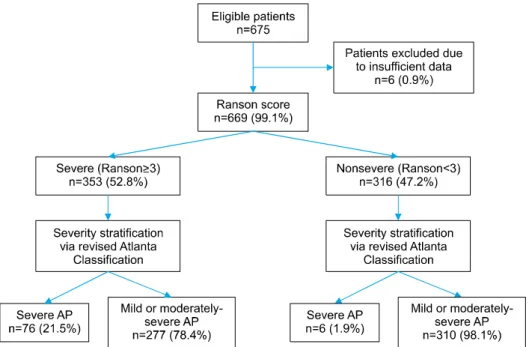
Fig. 2. Distribution of patients by Ranson score.
glucose of ≥11.1 mmol/L or a fasting glucose level of
≥6.0 mmol/L with symptoms of diabetes mellitus and its complications. Hyperlipidemia was diagnosed based on National Cholesterol Education Program (NCEP) guidelines.
History of smoking was defined as any personal history of tobacco use or dependence. History of alcohol con- sumption was regarded as any history of regular alcohol consumption.
Length of stay and mortality
Length of stay (LOS) was defined as the duration in days between the time of admission and the time of discharge. Mortality was defined as death occurring with- in the same hospital admission.
Statistical analysis
All statistical analyses were conducted via SPSS ver- sion 23 (Armonk NY: IBM Corp). Categorical variables are expressed as absolute numbers and proportions.
Variance within categorical variables was analysed using chi-square test while continuous variables were analysed using Student’s t-test. Multivariate analysis was conducted using logistic regression analysis. Statistical significance was considered at p<0.05. Sensitivity, specificity, pos- itive predictive value (PPV), and negative predictive value (NPV), positive and negative likelihood ratios (LR+ and LR-, respectively), diagnostic odds ratio, and overall accu-
racy were calculated for both RS and GS (with ≥3 for either score as the cutoff for SAP). Receiver-operating characteristic (ROC) curves for the prediction of SAP were calculated for both scoring systems. The predictive accuracy of RS or GS was measured by the area under the receiver-operative curve (AUC). Pairwise AUC com- parisons were performed between ROC curves for RS and GS via the nonparametric approach developed by DeLong et al.23 AUC ranged from 0.5 to 1.0. For prediction mod- els, AUC values of <0.6, 0.6 to 0.8, 0.8 to 0.9, and >0.9 indicated poor, moderate, good, and excellent discrim- inatory ability, respectively.24
RESULTS
Demographic and clinical profile
A total of 675 patients with a diagnosis of AP were admitted to Department of General Surgery. Six patients with insufficient data for either scoring system (RS or GS) were excluded. Figs. 2 and 3 reflect patient distribution according to RS and GS, respectively. Of variables stud- ied, C-reactive protein (CRP), prothrombin time (PT), par- tial thromboplastin time (aPTT), and arterial partial pres- sure of O2 (PaO2) had over 20% data missing. Thus, they were excluded from analysis. For 12 variables (alanine transaminase [AST], lactate dehydrogenase [LDH], serum amylase, hemoglobin, total white (blood cell) count
Fig. 3. Distribution of patients by Glasgow score.
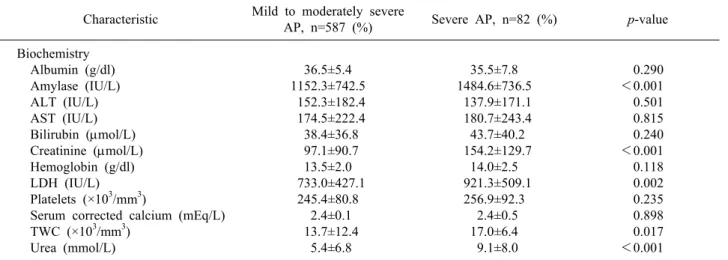
Table 2. Biochemical characteristics of patients with acute pancreatitis Characteristic Mild to moderately severe
AP, n=587 (%) Severe AP, n=82 (%) p-value
Biochemistry Albumin (g/dl) Amylase (IU/L) ALT (IU/L) AST (IU/L) Bilirubin (mol/L) Creatinine (mol/L) Hemoglobin (g/dl) LDH (IU/L) Platelets (×103/mm3)
Serum corrected calcium (mEq/L) TWC (×103/mm3)
Urea (mmol/L)
36.5±5.4 1152.3±742.5 152.3±182.4 174.5±222.4 38.4±36.8 97.1±90.7 13.5±2.0 733.0±427.1 245.4±80.8 2.4±0.1 13.7±12.4 5.4±6.8
35.5±7.8 1484.6±736.5 137.9±171.1 180.7±243.4 43.7±40.2 154.2±129.7 14.0±2.5 921.3±509.1 256.9±92.3 2.4±0.5 17.0±6.4 9.1±8.0
0.290
<0.001 0.501 0.815 0.240
<0.001 0.118 0.002 0.235 0.898 0.017
<0.001 ALT, alanine transaminase; AST, aspartate transaminase; LDH, lactate dehydrogenase; TWC, total white count
[TWC], platelet count, albumin, serum total bilirubin, urea, creatinine, alanine transaminase [ALT], and cor- rected serum calcium), missing data occurred for less than 20% of the sample. Thus, missing values were substituted with mean values. Average age of the 669 patients was 58.7±17.4 years (range, 21-98 years). There was a male preponderance (n=393, 53.8%). Their demographic char- acteristics are summarized in Table 1.
The three most common comorbidities were hyper- tension (n=347, 51.9%), hyperlipidemia (n=243, 36.3%), and T2DM (n=211, 31.5%). Seventy-six (11.4%) patients had previous history of pancreatic disease, including 30 (4.5%) with history of chronic pancreatitis. A total of 126
(18.8%) patients had smoking history while 163 (24.3%) patients consumed alcohol. The three most common etiol- ogies of AP were gallstone disease (n=460, 68.8%), alco- hol consumption (n=39, 5.8%), and hypertriglyceridemia (n=19, 2.8%). Hypertension (49.6% vs. 65.3%, p=0.044) and IHD (11.1% vs. 22.0%, p=0.012) were found to be significantly more prevalent in patients with SAP. History of smoking was more common in patients with mild-to-moderate AP (20.2% vs. 8.5%, p=0.041) (Table 1). On multivariate analysis, only IHD had significant as- sociation with severity (p=0.014).
Results of comparison for baseline biochemistry inves- tigations done at admission are shown in Table 2. Of pa-
Table 4. Distribution of Glasgow, Ranson and SOFA scores in patients with AP
Scoring criteria Mild or Moderately severe AP, n=587 (%)
Severe AP, n=82 (%) Glasgow score (n, %)
<3 ≥3
Ranson’s score (n, %) <3
≥3
SOFA score (n, %) <7
≥7
406 (69.2) 181 (30.8) 310 (52.8) 277 (47.2) 585 (99.7) 2 (0.3)
19 (23.2) 63 (76.8) 6 (7.2) 76 (92.7) 70 (85.4) 11 (13.4) Results of severity prognostication using Glasgow score, Ranson’s score. Results for SOFA score were included for comparison. AP, acute pancreatitis; SOFA, sequential organ failure assessment. Data on SOFA score for one patient was not available
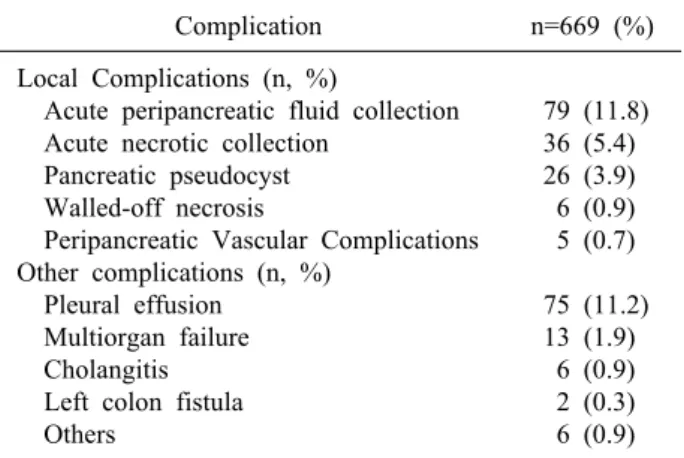
Table 3. Local and systemic complications in acute pancreatitis
Complication n=669 (%)
Local Complications (n, %)
Acute peripancreatic fluid collection Acute necrotic collection
Pancreatic pseudocyst Walled-off necrosis
Peripancreatic Vascular Complications Other complications (n, %)
Pleural effusion Multiorgan failure Cholangitis Left colon fistula Others
79 (11.8) 36 (5.4) 26 (3.9) 6 (0.9) 5 (0.7) 75 (11.2) 13 (1.9) 6 (0.9) 2 (0.3) 6 (0.9) Included within the category “Others” are: Atrial fibrillation (n=3), new-onset diabetes mellitus (n=1), gram negative rod bacteremia (n=2), ischemic bowel (n=1) and severe type 1 respiratory failure (n=1). Some patients had more than one complication
rameters assessed at initial presentation, univariate analy- sis using Student’s t-test identified five variables with sig- nificant differences between the non-severe and severe AP groups: serum amylase (mean±SD: 1151.1±753.5 vs.
1484.6±736.5, p<0.001), TWC (13.7±12.5 vs. 17.0±6.4, p=0.017), urea (5.4±6.9 vs. 9.1±8.0, p<0.001), creatinine (97.0±91.5 vs. 154.2±129.7, p<0.001), and LDH (729.8±455.9 vs. 936.7±530.0, p=0.002).
Morbidity and outcomes
Of patients studied, 160 (23.9%) had imaging findings consistent with local complications, most commonly acute peripancreatic fluid collection (n=79, 11.8%) and acute necrotic collection (n=36, 5.4%). Eighty-seven (13.0%) patients developed other complications, most commonly pleural effusion (n=75, 11.2%) (Table 3).
Mean LOS was 6.8±8.7 days (range, 2-92 days).
Ninety-four (14.1%) and 20 (3.0%) patients required ad- mission to high dependency ward (HDU) and ICU, respectively. The most common surgical intervention was cholecystectomy (n=188, 28.1%), followed by percuta- neous retroperitoneal drainage (n=10, 1.5%) and necrosec- tomy (n=7, 1.0%). Ninety-six (14.3%) patients underwent ERCP with stent insertion. Thirteen (1.9%) patients re- quired endoscopic ultrasonography for diagnostic evaluation. The overall incidence of local complications was 23.9% (n=160). Twelve (1.8%) patients died in the hospital.
Patients with severe acute pancreatitis
Eighty-two (12.3%) patients eventually developed SAP.
Mean age of patients with SAP was higher than those with mild-moderate AP (63.9±20.1 years vs. 57.9±16.9 years, p=0.003). The most common aetiology for AP was gallstone (n=61, 74.4%). Gender, ethnicity, and the three most common comorbidities were comparable between the two groups (SAP and mild-to-moderate AP). Incidence of previous pancreatic disease (n=9, 11.0%) and chronic pancreatitis (n=1, 1.2%) in overall distribution was similar to each other (p=0.097). SAP group had higher complica- tions (54.9% vs. 19.6%, p<0.001) and mortality (14.6%
vs. nil, p<0.001) compared to the non-severe group.
Score evaluation
Distribution of RS, GS, and SOFA score is summarized in Table 4. Diagnostic outcomes stratified by initial scor- ing of both tests are shown in Table 5. RS demonstrated a sensitivity of 92.7%, a specificity of 52.8%, a PPV of 21.5%, and an NPV of 98.1%. Positive and negative like- lihood ratios (LR+ and LR-) were 1.964 and 0.139, respectively. Diagnostic odds ratio of RS was 14.18 and its overall accuracy was 57.7%. GS demonstrated a sensi- tivity of 76.8%, a specificity of 69.2%, a PPV of 25.8%, and an NPV of 95.5%. LR+ and LR- were 2.492 and 0.335, respectively, corresponding to a diagnostic odds ra- tio of 7.44. The overall accuracy of GS was 70.1%.
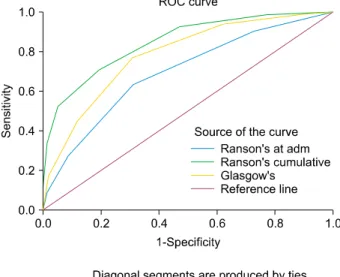
ROC curves for RS and GS are shown in Fig. 4. AUCs for RS and GS were 0.848 (95% CI: 0.819-0.875) and
Table 5. Evaluation of Glasgow and Ranson’s scores Score Sensitivity
(%)
Specificity (%)
PPV (%)
NPV
(%) LR+ LR- DOR Accuracy
Glasgow-Imrie score ≥3 Ranson score ≥3
76.8 92.7
69.2 52.8
25.8 21.5
95.5 98.1
2.492 1.964
0.335 0.139
7.438 14.176
70.1 57.7 PPV, positive predictive value; NPV, negative predictive value; LR+, positive likelihood ratio; LR-, negative likelihood ratio;
DOR, diagnostic odds ratio. DOR is an indicator of test performance which is independent of prevalence (unlike accuracy) and ranges from zero to infinity. Higher DOR is indicative of better test performance
Fig. 4. Area under receiver-operator curves of Ranson’s score and Glasgow score.
0.784 (95% CI: 0.750-0.814), respectively, for SAP pre- diction (p<0.001). Pairwise comparison of ROC curves of GS and RS revealed that AUC of RS was significantly greater than that of GS (p=0.003).
DISCUSSION
Our study demonstrates that both RS and GS are effec- tive in severity stratification at 48 hours. However, RS has superior diagnostic odds ratio and higher area under the curve for predicting severity of AP than GS in multiethnic Asian population with predominant gallstone aetiology.
Age was found to be significantly higher in the SAP group than that in the mild-to-moderate AP group in our study. The old age of our patients reflects local demog-
raphy of 30% local population being ≥55 years.25 Ethnicity and distribution of comorbidities within the study population were congruent with those of the local population.26 Gallstone was a predominant aetiology, sim- ilar to findings of other studies.8,9,27 However, Westerners have higher incidence of alcoholic pancreatitis.10,15 This is likely due to lower alcohol consumption rate in our pa- tients compared to Westerners. Incidence of SAP (12.3%) in this study was lower than 20-25% estimated by Beger and Rau,5 but comparable to results of more recent studies.12,27 This might be due to changing definitions of SAP with the revised Atlanta classification.4 On univariate analysis, biochemical profiles of SAP patients revealed significant differences in serum amylase, TWC, urea, cre- atinine, and LDH compared to those of mild-to-moderate AP patients. These biochemical associations have been well-documented in previous studies, showing that in- creased TWC,3 serum urea,28,29 creatinine,30-32 and LDH33,34 are associated with AP severity. Studies have al- so documented low serum albumin levels in patients with SAP.8,35 However, this was not evident in our study.
One key finding of this study was the high NPV of both scores (i.e., patients who were predicted not to have SAP truly did not have SAP). While the ideal NPV is 100%, these values remain consistent with other studies, highlighting the scores’ utility in ruling out SAP.10,27,36 Results from our study are consistent with other reports showing that RS has a higher sensitivity but a lower spe- cificity than GS for SAP prediction.10,14,15 This highlights the primacy of the treating physician’s judgment and wis- dom in deciding disposition and initial management re- gardless of scoring.
RS and GS have other inherent limitations. Both scores’ low PPV raises a high alert level in many patients who eventually have mild AP, imposing an unnecessary resource burden and anxiety to patients. Chauhan and
Forsmark16 have commented that using the revised Atlanta classification reduces the broad spectrum of AP severity to a binary result for the purpose of analysis. However, it fails to realistically capture the full spectrum of the condition. Nonetheless, our study demonstrates high AUC of both scores, emphasizing their suitability as a basic risk-stratification tool.
RS and GS have been compared to other prognostic in- dices in several studies. Comparative risk prediction tools include the APACHE-II score, Bedside Index of Severe Acute Pancreatitis (BISAP) score, and Harmless Acute Pancreatitis score (HAPS). Robert et al.15 have compared RS and GS scores to APACHE II and CRP and found that APACHE II is superior to RS on admission (p=0.049). This persisted throughout the subsequent five days,15 highlighting the limited prognostic value of RS be- fore 48 hours. In a study on 185 patients with mean age of 57.1 years with 51% male population, Papachristou et al.9 have shown that RS has the highest AUC (94%) for predicting SAP compared to APACHE II score, BISAP score, and Computerised Tomography Severity Index (CTSI). In their study, the incidence of SAP (22% vs 12.3%) and mortality in SAP (17.6% vs 14.5%) were higher compared to our results. A study involving 161 pa- tients with mean age of 62.3 years including 63% males by Cho et al.27 has reported that APACHE-II has higher AUC than RS, BISAP, CRP at 24 hours and CTSI.
However, there was no significant difference. In addition, NPV of RS (95.3%) was on par with APACHE-II (95.8%). Their study involved 22% alcoholic and 21%
idiopathic pancreatitis aetiologies. This is different from our experience. However, their incidence of SAP (13%) is comparable to ours. Both Papachristou et al.9 and Cho et al.27 have concluded that novel and unique models are needed to further improve the prognostic accuracy in SAP. Recently, many authors have evaluated the role of indices based on acute phase proteins and simple labo- ratory indices such as neutrophil to lymphocyte ratio (NLR) as predictive tools in SAP. A study including 328 patients with AP of mean age 47.5 years by Han et al.37 has reported that a combination of NLR and fluid seques- tration has predictive abilities similar to RS. However, in that study, RS had higher AUC (82.4%) compared to NLR and fluid sequestration measured on days 0, 1, and 2. A study including 169 patients with mean age 54.3
years and 58% males by Yue et al.38 has reported that pre- albumin/fibrinogen ratio score has higher AUC than RS (92.3% vs. 86%).38 These results need to be validated pro- spectively and in other units. A Spanish study by Valverde-López et al.39 including 269 patients with mean age 64.6 years and 50% males has reported that BISAP outperforms RS. However, AUCs for RS in predicting se- verity (85%) and mortality (94%) were high.39 Their study emphasized the role of BUN at 48 hours and serum lactate as simple biomarkers for severity prediction.
These findings prompt several questions. Firstly, given all scores possess a margin of error, should they be con- sidered relevant given that ultimately clinical judgment triumphs all? Secondly, given traditional scoring systems have sufficient prognostic accuracy, is there a need to de- velop novel and unique indices? Thirdly, is there a need to continue investing efforts to develop an ‘upon-admis- sion scoring system’ for severity or is the 48-hour time- frame essential for accurate severity prediction?
Regarding the first question, while these criteria cannot replace clinical judgment, they have value in providing objective stratification in doubtful cases, providing means for standardized reporting and auditing, and providing a platform for patient communication and future research.
For the second question, while novel indices such as BISAP, HAPS, and APACHE-II allow prognostication at admission, we believe scores at admission contradict the underlying pathophysiology of AP as a disease in evolu- tion that requires daily review for severity reassessment.
Severity is thus a ‘continuous phenomenon’ rather than a
‘time-point’. Many studies have suggested that the 48-hour time frame is essential to accurately predict severity.1,3-5,37-39
Further, the quality of clinical care and treatment response contribute to clinical outcomes. One may thus consider the 48-hour requirement to complete RS as an inherent strength, which we have failed to ac- knowledge since the original report published by Ranson J H et al. in 1974. Recommendations by the recent Atlanta symposium similarly endorse the 48-hour timeframe for severity stratification, highlighting the importance of prog- nosticating AP accurately rather than prematurely.
For the third question, one must differentiate whether the system is designed for binary prediction (i.e., mild versus severe) or multiple stages of disease severity. For the latter, the 48-hour window seems essential. For the
former, it is possible that composite scoring systems which incorporate ‘scoring on admission’ with
‘physician-determined severity’ should enable accurate and reliable severity prediction. Without the subjective component of ‘physician determined severity’, an ad- equately powered study to develop an objective severity stratification score is not feasible as the overarching aim in care of patients with SAP is to improve outcomes (i.e., reduce mortality). Merely predicting severity is only half of the process. Assuming a 15% rate of SAP, mortality of SAP of 15% and a dropout rate of 10%, approximately 5,000 patients with AP needs to be enrolled in a pro- spective trial to demonstrate mortality reduction to 10%
with 80% power and two-tailed alpha of 5%.
Our study has several limitations. First, patients treated for AP under non-surgical departments were excluded.
This might explain the paucity of post-ERCP AP patients.
Second, this study did not account for certain laboratory limitations. In particular, for serum amylase, our labo- ratory cannot quantify beyond 2000 IU/L. Despite this, se- rum amylase was still significantly greater in the SAP group compared to that in the mild-moderate severe group, rendering this limitation negligible. Further, serum amylase is elevated in a myriad of other pathologies and its magnitude of rise is neither associated with severity nor predictive of mortality.40 Third, gallstone-associated AP appeared to be underreported here, with local in- cidence falling short of the reported 80% prevalence in other studies.19,41 This might be due to inconsistencies in radiologic reporting and approximately 6% (n=41) pa- tients in our study had no established aetiology. However, the overall distribution of gallstone etiology in our study remained congruent with that reported in other studies.
Lastly, this was a single center retrospective study with missing data requiring imputation and exclusion (non-re- porting) of certain important variables (e.g., C-reactive protein). We believe these limitations are in part compen- sated by large sample and computerized data recording system.
In conclusion, in the prediction of SAP, RS and GS have high NPV. RS has a higher AUC than GS. The 48-hour required for risk stratification by traditional scor- ing systems is their inherent strength rather than weakness. It is very plausible that scientific endeavors to investigate novel and unique scoring systems will have
limited ability to improve outcomes of SAP with clinical impact. We foresee that the use of traditional scoring sys- tems is a reasonable alternative to generic OF-based scor- ing systems. Further studies comparing the utility of both scores with organ failure-based systems are needed before traditional scoring systems are considered outdated and obsolete. Future effort needs to be invested in collabo- rative multicenter prospective studies aiming to identify simple bed side and/or biochemical variables routinely done as part of clinical care.
REFERENCES
1. Clancy TE, Benoit EP, Ashley SW. Current management of acute pancreatitis. J Gastrointest Surg 2005;9:440-452.
2. Tenner S, Baillie J, DeWitt J, Vege SS; American College of Gastroenterology. American College of Gastroenterology guide- line: management of acute pancreatitis. Am J Gastroenterol 2013;108:1400-1415; 1416.
3. Banks PA, Freeman ML; Practice Parameters Committee of the American College of Gastroenterology. Practice guidelines in acute pancreatitis. Am J Gastroenterol 2006;101:2379-2400.
4. Banks PA, Bollen TL, Dervenis C, Gooszen HG, Johnson CD, Sarr MG, et al. Classification of acute pancreatitis--2012: re- vision of the Atlanta classification and definitions by interna- tional consensus. Gut 2013;62:102-111.
5. Beger HG, Rau BM. Severe acute pancreatitis: clinical course and management. World J Gastroenterol 2007;13:5043-5051.
6. Shelat VG, Diddapur RK. Minimally invasive retroperitoneal pancreatic necrosectomy in necrotising pancreatitis. Singapore Med J 2007;48:e220-e223.
7. Ranson JH, Rifkind KM, Roses DF, Fink SD, Eng K, Spencer FC. Prognostic signs and the role of operative management in acute pancreatitis. Surg Gynecol Obstet 1974;139:69-81.
8. Blamey SL, Imrie CW, O'Neill J, Gilmour WH, Carter DC.
Prognostic factors in acute pancreatitis. Gut 1984;25:1340-1346.
9. Papachristou GI, Muddana V, Yadav D, O'Connell M, Sanders MK, Slivka A, et al. Comparison of BISAP, Ranson's, APACHE-II, and CTSI scores in predicting organ failure, com- plications, and mortality in acute pancreatitis. Am J Gastroenterol 2010;105:435-441; quiz 442.
10. Simoes M, Alves P, Esperto H, Canha C, Meira E, Ferreira E, et al. Predicting acute pancreatitis severity: comparison of prog- nostic scores. Gastroenterology Res 2011;4:216-222.
11. Mounzer R, Langmead CJ, Wu BU, Evans AC, Bishehsari F, Muddana V, et al. Comparison of existing clinical scoring sys- tems to predict persistent organ failure in patients with acute pancreatitis. Gastroenterology 2012;142:1476-1482; quiz e15-e16.
12. Bollen TL, Singh VK, Maurer R, Repas K, van Es HW, Banks PA, et al. A comparative evaluation of radiologic and clinical scoring systems in the early prediction of severity in acute pancreatitis. Am J Gastroenterol 2012;107:612-619.
13. Williams M, Simms HH. Prognostic usefulness of scoring sys- tems in critically ill patients with severe acute pancreatitis. Crit Care Med 1999;27:901-907.
14. De Bernardinis M, Violi V, Roncoroni L, Boselli AS, Giunta A, Peracchia A. Discriminant power and information content of Ranson's prognostic signs in acute pancreatitis: a meta-analytic study. Crit Care Med 1999;27:2272-2283.
15. Robert JH, Frossard JL, Mermillod B, Soravia C, Mensi N, Roth M, et al. Early prediction of acute pancreatitis: prospective study comparing computed tomography scans, Ranson, Glascow, Acute Physiology and Chronic Health Evaluation II scores, and various serum markers. World J Surg 2002;26:612-619.
16. Chauhan S, Forsmark CE. The difficulty in predicting outcome in acute pancreatitis. Am J Gastroenterol 2010;105:443-445.
17. Larvin M, McMahon MJ. APACHE-II score for assessment and monitoring of acute pancreatitis. Lancet 1989;2:201-205.
18. Leese T, Shaw D, Holliday M. Prognostic markers in acute pan- creatitis: can pancreatic necrosis be predicted? Ann R Coll Surg Engl 1988;70:227-232.
19. Kandasami P, Harunarashid H, Kaur H. Acute pancreatitis in a multi-ethnic population. Singapore Med J 2002;43:284-288.
20. Vincent JL, Moreno R, Takala J, Willatts S, De Mendonça A, Bruining H, et al. The SOFA (Sepsis-related Organ Failure Assessment) score to describe organ dysfunction/failure. On be- half of the working group on sepsis-related problems of the European society of intensive care medicine. Intensive Care Med 1996;22:707-710.
21. Adam F, Bor C, Uyar M, Demırağ K, Çankayalı İ. Severe acute pancreatitis admitted to intensive care unit: SOFA is superior to Ranson's criteria and APACHE II in determining prognosis. Turk J Gastroenterol 2013;24:430-435.
22. Chari ST, Smyrk TC, Levy MJ, Topazian MD, Takahashi N, Zhang L, et al. Diagnosis of autoimmune pancreatitis: the Mayo Clinic experience. Clin Gastroenterol Hepatol 2006;4:1010-1016;
quiz 934.
23. DeLong ER, DeLong DM, Clarke-Pearson DL. Comparing the areas under two or more correlated receiver operating character- istic curves: a nonparametric approach. Biometrics 1988;44:
837-845.
24. Anbalakan K, Chua D, Pandya GJ, Shelat VG. Five year experi- ence in management of perforated peptic ulcer and validation of common mortality risk prediction models - are existing models sufficient? A retrospective cohort study. Int J Surg 2015;14:38-44.
25. Department of Statistics, Ministry of Trade and Industry, Republic of Singapore. Population. In: Department of Statistics, Ministry of Trade and Industry, Republic of Singapore, ed.
Population trends, 2016. 12th ed. Singapore: Department of Statistics, Singapore, 2016:3-17.
26. Health Information Division, Ministry of Health, Singapore.
Morbidity and biographic profile of patients. In: Ministry of Health, Singapore, ed. Primary care survey 2010. Singapore:
Ministry of Health, Singapore, 2010:6-14.
27. Cho JH, Kim TN, Chung HH, Kim KH. Comparison of scoring systems in predicting the severity of acute pancreatitis. World J Gastroenterol 2015;21:2387-2394.
28. Wu BU, Bakker OJ, Papachristou GI, Besselink MG, Repas K, van Santvoort HC, et al. Blood urea nitrogen in the early assess- ment of acute pancreatitis: an international validation study.
Arch Intern Med 2011;171:669-676.
29. Wu BU, Johannes RS, Sun X, Conwell DL, Banks PA. Early changes in blood urea nitrogen predict mortality in acute pancreatitis. Gastroenterology 2009;137:129-135.
30. Talamini G, Uomo G, Pezzilli R, Rabitti PG, Billi P, Bassi C, et al. Serum creatinine and chest radiographs in the early assess- ment of acute pancreatitis. Am J Surg 1999;177:7-14.
31. Lankisch PG, Weber-Dany B, Maisonneuve P, Lowenfels AB.
High serum creatinine in acute pancreatitis: a marker for pancre- atic necrosis? Am J Gastroenterol 2010;105:1196-1200.
32. Muddana V, Whitcomb DC, Khalid A, Slivka A, Papachristou GI. Elevated serum creatinine as a marker of pancreatic necrosis in acute pancreatitis. Am J Gastroenterol 2009;104:164-170.
33. Hirota M, Takada T, Kawarada Y, Hirata K, Mayumi T, Yoshida M, et al. JPN guidelines for the management of acute pancreatitis:
severity assessment of acute pancreatitis. J Hepatobiliary Pancreat Surg 2006;13:33-41.
34. Hritz I, Hegyi P. Early Achievable Severity (EASY) index for simple and accurate expedite risk stratification in acute pancreatitis. J Gastrointestin Liver Dis 2015;24:177-182.
35. Wang X, Cui Z, Li H, Saleen AF, Zhang D, Miao B, et al.
Nosocomial mortality and early prediction of patients with severe acute pancreatitis. J Gastroenterol Hepatol 2010;25:1386-1393.
36. Ueda T, Takeyama Y, Yasuda T, Matsumura N, Sawa H, Nakajima T, et al. Simple scoring system for the prediction of the prognosis of severe acute pancreatitis. Surgery 2007;141:51-58.
37. Han C, Zeng J, Lin R, Liu J, Qian W, Ding Z, et al. The utility of neutrophil to lymphocyte ratio and fluid sequestration as an early predictor of severe acute pancreatitis. Sci Rep 2017;7:
10704.
38. Yue W, Liu Y, Ding W, Jiang W, Huang J, Zhang J, et al. The predictive value of the prealbumin-to-fibrinogen ratio in patients with acute pancreatitis. Int J Clin Pract 2015;69:1121-1128.
39. Valverde-López F, Matas-Cobos AM, Alegría-Motte C, Jiménez-Rosales R, Úbeda-Muñoz M, Redondo-Cerezo E.
BISAP, RANSON, lactate and others biomarkers in prediction of severe acute pancreatitis in a European cohort. J Gastroenterol Hepatol 2017;32:1649-1656.
40. Shah KS, Shelat VG, Jogai S, Trompetas V. Primary gallbladder lymphoma presenting with perforated cholecystitis and hyperamylasaemia. Ann R Coll Surg Engl 2016;98:e13-e15.
41. Tan YHA, Rafi S, Tyebally Fang M, Hwang S, Lim EW, Ngu J, et al. Validation of the modified Ranson versus Glasgow score for pancreatitis in a Singaporean population. ANZ J Surg 2015;87:700-703.