ISSN 2234-3806 • eISSN 2234-3814
https://doi.org/10.3343/alm.2018.38.5.458
Diagnostic Performance and Comparative Evaluation of the Architect, Liaison, and Platelia Epstein-Barr Virus Antibody Assays
Younhee Park, M.D.1, Borae G. Park, M.D.2, Jihye Ha, M.D.1, and Hyon-Suk Kim , M.D.1
Department of Laboratory Medicine1, Yonsei University College of Medicine, Seoul; Department of Laboratory Medicine2, Korea University College of Medicine, Seoul, Korea
Background: Epstein-Barr Virus (EBV) is one of the most prevalent causes of viral infec- tion in humans. EBV infection stage (acute, past, or absent infection) is typically determined using a combination of assays that detect EBV-specific markers, such as IgG and IgM an- tibodies against the EBV viral capsid antigen (VCA) and IgG antibodies against the EBV nuclear antigen (EBNA). We compared the diagnostic performance and agreement of re- sults between three commercial EBV antibody assays using an EBV performance panel (SeraCare Life Science, Milford, MA, USA) as a reference.
Methods: EBV antibody tests of EBV VCA IgM, VCA IgG, and EBNA IgG antibodies were performed by the Architect (Abbott Diagnostics, Wiesbaden, Germany), Liaison (DiaSorin, Saluggia, Italy), and Platelia (Bio-Rad, Marnes-la-Coquette, France) assays. Agreement between the three assays was evaluated using 279 clinical samples, and EBV DNA and antibody test results were compared.
Results: The three EBV antibody assays showed good diagnostic performance with good and excellent agreement with the performance panel (kappa coefficient, >0.6). The over- all VCA IgM positivity rate was higher in EBV DNA-positive samples than in EBV DNA-neg- ative samples for all three EBV antibody assays (P =0.02). The three EBV antibody assays exhibited good agreement in results for the clinical samples.
Conclusions: The diagnostic performance of the three EBV antibody assays was accept- able, and they showed comparable agreement in results for the clinical samples.
Key Words: Epstein-Barr virus, Assay, Diagnostic performance, DNA, Antibody, Immuno- globulin
Received: August 17, 2017
Revision received: November 28, 2017 Accepted: May 3, 2018
Corresponding author: Hyon-Suk Kim https://orcid.org/0000-0001-5662-7740 Department of Laboratory Medicine, Yonsei University College of Medicine, 50-1 Yonsei-ro, Seodaemun-gu, Seoul 03722, Korea
Tel: +82-2-2228-2443 Fax: +82-2-364-1583 E-mail: [email protected]
© Korean Society for Laboratory Medicine This is an Open Access article distributed under the terms of the Creative Commons Attribution Non-Commercial License (http://creativecom- mons.org/licenses/by-nc/4.0) which permits unrestricted non-commercial use, distribution, and reproduction in any medium, provided the original work is properly cited.
INTRODUCTION
The Epstein-Barr virus (EBV) is one of the most prevalent causes of viral infection in humans. EBV has been linked to infectious mononucleosis [1]. Humans are the only natural hosts of EBV.
Oral transmission is the primary route of infection in adolescents and young adults [2]; however, EBV can also be acquired via blood transfusions, hematopoietic stem cell transplantation, or
solid organ transplants, and these infections can be life-threat- ening [3-6].
In immunocompromised patients (particularly in solid organ transplant recipients), EBV DNA detection tests are performed within three months of transplantation and at least once per year in stable transplanted patients [4, 7]. However, these tests do not reflect EBV infection status in all patients, as the virus can exist in B lymphocytes and possess Herpesviridae latency
2017-03-16 https://crossmark-cdn.crossref.org/widget/v2.0/logos/CROSSMARK_Color_square.svg
[8]. Antibody tests for EBV, such as those involving IgM and IgG antibodies against the EBV viral capsid antigen (VCA) and an IgG antibody against the EBV nuclear antigen (EBNA), are also frequently used to determine EBV infection status. EBV infection stage is typically assessed using a combination of antibody as- says. An ideal EBV testing panel, including a combination of an- tibody assays for detecting EBV-specific antigens, should be able to detect all serologic infection statuses (acute, past, and absent infections).
Although the immunofluorescence assay (IFA) is considered the gold standard for the detection of VCA and EBNA IgG [9], chemiluminescence immunoassays (CLIA) using automated analyzers are also widely used because of their objective inter- pretation of results, high throughput, and low labor intensive- ness [9-15]. Different commercial EBV antibody assays often show varying test results, thus hindering the interpretation of patient EBV infection status [9, 10, 16]. Reliable test results are needed for an exact diagnosis of EBV infection; therefore, EBV assays used in diagnostic laboratories must be evaluated for their accuracy, performance, and reliability.
Although many studies have compared commercial EBV as- says [9-14], the diagnostic performance of the assays has not been evaluated using a standard EBV performance panel (Sera- Care Life Science, Milford, MA, USA) covering various EBV in- fection status. To fill this gap, we evaluated the diagnostic per- formances of three commercial EBV antibody assays, Architect (Abbott Diagnostics, Wiesbaden, Germany), Liaison (DiaSorin, Saluggia, Italy), and Platelia (Bio-Rad, Marnes-la-Coquette, France) assays, using an EBV performance panel and com- pared the results of these three commercial assays in clinical samples of patients with suspected EBV infection.
METHODS 1. Study samples
A total of 279 samples (from 123 males and 156 females with a median age of 25 years, range 11 months–96 years) for which an EBV PCR test and antibody assays (VCA IgM, VCA IgG, and EBNA IgG) were concurrently ordered, were collected from March 2015 to March 2016. All samples were derived from im- munocompetent patients for the diagnosis of EBV infection. We excluded samples from immunocompromised patients (e.g., those with cancer, organ transplant recipients, or those with other infectious diseases). The Liaison assay was performed on the requested date for EBV antibody tests, and the residual samples were stored at –20°C, following separation for the Ar-
chitect assay and Platelia assay and between assay testing. This study was approved by the Institutional Review Board (IRB) of Severance Hospital, Seoul, Korea. The IRB approved exemption for written informed consent, because this study was performed using stored residual samples after testing and based on a ret- rospective chart review.
2. EBV antibody assays
The Liaison assay was performed before the Architect and Plate- lia assays. The Liaison test is based on CLIA and samples were analyzed using the Liaison analyzer (DiaSorin); the Architect as- say is a chemiluminescent microparticle immunoassay (CMIA) and was performed using the Architect i2000 analyzer (Abbott Diagnostics); and the Platelia test is an ELISA that was performed manually. Optical densities of the Platelia test were quantified using the BEP III System (Siemens, Marburg, Germany). For the Platelia assay, serum samples were diluted 1:21 (10 μL+
200 μL) with the sample diluent provided with the assay kit. The instructions of the other tests did not recommend the use of se- rum dilution. All assay procedures followed the manufacturers’
instructions (Table 1).
3. EBV performance panel
The Anti-Epstein-Barr Virus Mixed Titer Performance Panel (Se- raCare Life Science) includes 21 samples covering different EBV infection status (one seronegative, 13 past infections [VCA IgM-, VCA IgG+, EBNA IgG+], three acute primary infections [VCA IgM+, VCA IgG+, EBNA IgG-], three early phase acute pri- mary infections [VCA IgM+, VCA IgG-, EBNA IgG-], and one transient infection or re-infection [VCA IgM+, VCA IgG+, EBNA IgG+]) and a data sheet for comparing the panel results with the test results of the commercial EBV assays.
Lyophilized aliquots of donor plasma were dissolved in dis- tilled water prior to analysis. Tests were performed in duplicate using the three commercial EBV assays to reduce the likelihood of experimental or reagent errors. VCA IgM values >43.9 and
>1.0 were considered positive according to the performance panel data sheet of the Liaison and Platelia assays, respectively;
VCA IgG values >1.0 were considered positive for the Platelia EBV assay; and EBNA IgG values >21.9 and >1.0 in the Liai- son and Platelia EBV assays, respectively, were considered posi- tive. The positive and negative results of the panel samples, ob- tained using the EBV antibody assays, were interpreted accord- ing to the performance panel instructions, and EBV antibody assay results were determined following the instructions of each assay.
4. EBV DNA test
PCR for EBV DNA was performed using the artus EBV RG PCR Kit (Qiagen, Hilden, Germany) on Rotor-Gene Q Instrument (Qia- gen) after extracting DNA from plasma with the QIAamp DNA Mini Kit (Qiagen, Dusseldorf, Germany) according to the manu- facturer’s instruction.
5. Statistical analysis
Kappa statistics, sensitivity, and specificity were calculated for VCA IgM, VCA IgG, and EBNA IgG based on the EBV performance panel results. We also calculated kappa statistics and the per- centages of positive, negative, and total agreement between the Architect, Liaison, and Platelia EBV assays. Kappa values >0.75 indicated excellent agreement, values between 0.40 and 0.75 suggested fair to good agreement, and values <0.40 represented poor agreement. The percentage of total agreement between the assays represents the percentage of paired tests with identi- cal results. Because “gray zone” or equivocal results cannot be interpreted as positive results and are mostly considered nega- tive by clinicians, these results were grouped to evaluate kappa statistics and agreement percentages. The Student t-test was performed to determine the VCA IgM positive rate between the EBV DNA-positive and negative groups. P values <0.05 were considered statistically significant. To evaluate diagnostic perfor- mance based on clinical diagnosis of EBV infection of clinical samples, Youden’s index and positive and negative Likelihood
ratio were calculated. All statistical analyses were performed us- ing Analyse-it, version 4.65 (Analyse-it Software, Ltd., Leeds, UK).
RESULTS
1. Diagnostic performance of the three EBV antibody assays
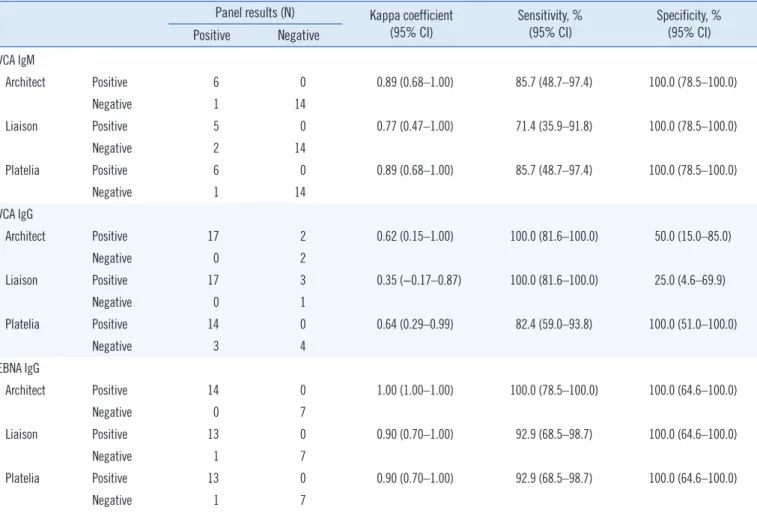
The duplicate EBV antibody results were the same in all three assays. The EBV performance panel exhibited good and excel- lent agreement with the Architect, Liaison, and Platelia EBV an- tibody assays, with Kappa coefficients>0.6 (Table 2). However, we observed poor agreement between the performance panel and the Liaison assay for VCA IgG (kappa coefficient, 0.35; Ta- ble 2). One and two VCA IgM-positive EBV performance panel samples tested negative with the Architect and Platelia assays and Liaison assay, respectively; these changes affected the sen- sitivity of the VCA IgM tests (sensitivity, 71.4–85.7%; Table 2).Two and three panel samples tested VCA IgG-positive with the Architect and Liaison assays, respectively, but were negative ac- cording to the EBV performance panel (Table 2); this affected the specificity of the two assays. For EBNA IgG, three assays and EBV performance panel demonstrated similar results.
2. Comparison of the EBV antibody and DNA assays
EBV DNA was detected in 74 of 279 (26.5%) patient samples (Table 3). Most EBV DNA-negative patients were also VCA IgM- negative. The overall VCA IgM positivity rate was higher in EBV Table 1. Characteristics of the three Epstein-Barr virus antibody assays
Architect Liaison Platelia
VCA IgM VCA IgG EBNA IgG VCA IgM VCA IgG EBNA IgG VCA IgM VCA IgG EBNA IgG
Method CMIA CLIA ELISA
Sample Serum or plasma Serum or plasma Serum
Sample volume 25 μL (+150 μL dead volume) 20 μL (+150 μL dead volume) 10 μL
Assay duration ~30 min ~50 min ~150 min
Assay unit S/CO* U/mL ISR
Interpretation
Nonreactive <0.50 <0.75 <0.50 <20 <20 <5 ≤0.90 ≤0.90 ≤0.90
Gray zone/equivocal† 0.50 to
<1.00
0.75 to
<1.00
0.50 to
<1.00
20 to
<40
No equivocal zone
5 to
<20
0.91 to
<1.10
0.91 to
<1.10
0.91 to
<1.10
Reactive ≥1.00 ≥1.00 ≥1.00 ≥40 ≥20 ≥20 ≥1.10 ≥1.10 ≥1.10
Antigen VCA p18 EBNA-1 p72 Synthetic peptide p18 EBNA-1 Affinity-purified VCA antigen Recombinant
EBNA-1
EA IgG availability No Yes Yes
*Sample RLU/cut-off RLU; †Gray zone for Architect and Equivocal for Liaison and Platelia.
Abbreviations: CLIA, chemiluminescence immunoassay; CMIA, Chemiluminescent microparticle immunoassay; EA, Epstein-Barr virus early antigen; EBNA, Epstein-Barr virus nuclear antigen; ELISA, enzyme-linked immunosorbent assay; ISR, immune status ratio; RLU, relative light unit; VCA, viral capsid antigen.
Table 2. Diagnostic performance of the Architect, Liaison, and Platelia assays Panel results (N) Kappa coefficient
(95% CI) Sensitivity, %
(95% CI) Specificity, % (95% CI) Positive Negative
VCA IgM
Architect Positive 6 0 0.89 (0.68–1.00) 85.7 (48.7–97.4) 100.0 (78.5–100.0)
Negative 1 14
Liaison Positive 5 0 0.77 (0.47–1.00) 71.4 (35.9–91.8) 100.0 (78.5–100.0)
Negative 2 14
Platelia Positive 6 0 0.89 (0.68–1.00) 85.7 (48.7–97.4) 100.0 (78.5–100.0)
Negative 1 14
VCA IgG
Architect Positive 17 2 0.62 (0.15–1.00) 100.0 (81.6–100.0) 50.0 (15.0–85.0)
Negative 0 2
Liaison Positive 17 3 0.35 (−0.17–0.87) 100.0 (81.6–100.0) 25.0 (4.6–69.9)
Negative 0 1
Platelia Positive 14 0 0.64 (0.29–0.99) 82.4 (59.0–93.8) 100.0 (51.0–100.0)
Negative 3 4
EBNA IgG
Architect Positive 14 0 1.00 (1.00–1.00) 100.0 (78.5–100.0) 100.0 (64.6–100.0)
Negative 0 7
Liaison Positive 13 0 0.90 (0.70–1.00) 92.9 (68.5–98.7) 100.0 (64.6–100.0)
Negative 1 7
Platelia Positive 13 0 0.90 (0.70–1.00) 92.9 (68.5–98.7) 100.0 (64.6–100.0)
Negative 1 7
Abbreviations: CI, confidence interval; EBNA, Epstein-Barr virus nuclear antigen; VCA, viral capsid antigen.
Table 3. Results of EBV antibody and DNA assays
EBV DNA VCA IgM/VCA IgG/EBNA IgG panel Architect Liaison Platelia
EBV DNA Positive (N=74) -/-/- Seronegative 2 3 8
+/-/- Early phase acute primary infection 3 0 5
+/+/- Acute primary infection 9 9 0
+/+/+ Transient infection/Re-infection 0 1 0
-/+/+ Past infection 53 49 48
-/+/- Isolated VCA IgG 7 12 10
-/-/+ Isolated EBNA IgG 0 0 3
EBV DNA Negative (N=205) -/-/- Seronegative 37 35 40
+/-/- Early phase acute primary infection 1 1 0
+/+/- Acute primary infection 0 0 0
+/+/+ Transient infection/Re-infection 3 3 0
-/+/+ Past infection 159 147 144
-/+/- Isolated VCA IgG 5 12 8
-/-/+ Isolated EBNA IgG 0 7 13
Abbreviations: EBV, Epstein-Barr virus; VCA, viral capsid antigen; EBNA, Epstein-Barr virus nuclear antigen.
DNA-positive samples than in EBV DNA-negative samples for all three EBV antibody assays (P =0.02).
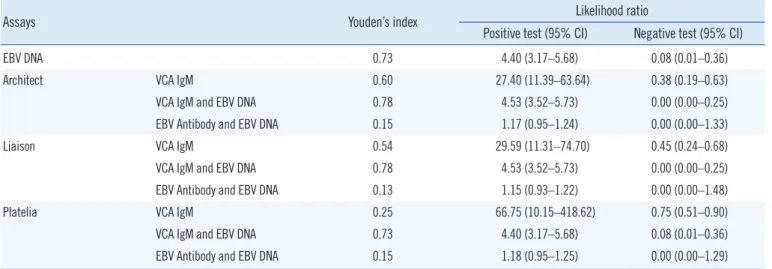
Forty of the 279 patients had confirmed cases of other infec- tious agents/diseases such as Cytomegalovirus, Mycobacterium tuberculosis, and malaria. Six of the 40 patients were positive for the EBV DNA test and all were VCA IgM negative according to the Architect, Liaison, and Platelia assays. One of the 34 EBV DNA-negative patients with another infectious disease was VCA IgM positive according to the Architect assay. The positive and negative test likelihood ratio and Youden’s index according to EBV DNA test, VCA IgM test, and assay combination results were evaluated based on the clinical diagnosis of the 279 patients (Table 4). For the Architect and Liaison assays, a combination
of VCA IgM and EBV DNA results was better than the EBV DNA test alone.
3. Comparisons between the Architect, Liaison, and Platelia EBV antibody assays
The Architect and Liaison assays exhibited kappa coefficients of 0.79 for VCA IgM, 0.80 for VCA IgG, and 0.92 for EBNA IgG, in- dicating excellent agreement between the two assays (Table 5).
We observed excellent agreement between the Architect and Platelia assays and between the Liaison and Platelia assays for EBNA IgG (kappa coefficients, 0.89 and 0.88, respectively). The kappa coefficients showed fair and good agreement between the Architect and Platelia assays and between the Liaison and
Table 4. Diagnostic performance of single and combination assays
Assays Youden’s index Likelihood ratio
Positive test (95% CI) Negative test (95% CI)
EBV DNA 0.73 4.40 (3.17–5.68) 0.08 (0.01–0.36)
Architect VCA IgM 0.60 27.40 (11.39–63.64) 0.38 (0.19–0.63)
VCA IgM and EBV DNA 0.78 4.53 (3.52–5.73) 0.00 (0.00–0.25)
EBV Antibody and EBV DNA 0.15 1.17 (0.95–1.24) 0.00 (0.00–1.33)
Liaison VCA IgM 0.54 29.59 (11.31–74.70) 0.45 (0.24–0.68)
VCA IgM and EBV DNA 0.78 4.53 (3.52–5.73) 0.00 (0.00–0.25)
EBV Antibody and EBV DNA 0.13 1.15 (0.93–1.22) 0.00 (0.00–1.48)
Platelia VCA IgM 0.25 66.75 (10.15–418.62) 0.75 (0.51–0.90)
VCA IgM and EBV DNA 0.73 4.40 (3.17–5.68) 0.08 (0.01–0.36)
EBV Antibody and EBV DNA 0.15 1.18 (0.95–1.25) 0.00 (0.00–1.29)
Abbreviations: CI, confidence interval; VCA, viral capsid antigen.
Table 5. Agreement between the Architect, Liaison, and Platelia assays
Agreement (95% CI) Architect vs Liaison Architect vs Platelia Liaison vs Platelia
VCA IgM Kappa 0.79 (0.62–0.95) 0.46 (0.20–0.72) 0.51 (0.24–0.79)
Total, % 97.8 (95.4–99.0) 96.1 (93.1–97.8) 96.8 (94.0–98.3)
Negative, % 98.5 (96.2–99.4) 100.0 (98.6–100) 100.0 (98.6–100)
Positive, % 85.7 (60.1–96.0) 31.3 (14.2–55.6) 35.7 (16.3–61.2)
VCA IgG Kappa 0.80 (0.70–0.90) 0.69 (0.59–0.79) 0.64 (0.53–0.75)
Total, % 94.6 (91.3–96.7) 90.0 (85.9–93.0) 88.2 (83.9–91.5)
Negative, % 80.4 (66.8–89.3) 97.7 (87.9–99.6) 89.1 (77.0–95.3)
Positive, % 97.4 (94.5–98.8) 88.6 (83.9–92.0) 88.0 (83.2–91.6)
EBNA IgG Kappa 0.92 (0.87–0.98) 0.89 (0.83–0.95) 0.88 (0.81–0.94)
Total, % 97.1 (94.4–98.5) 96.1 (93.1–97.8) 95.3 (92.2–97.3)
Negative, % 88.9 (79.6–94.3) 96.9 (89.3–99.1) 90.3 (81.3–95.2)
Positive, % 100.0 (98.2–100.0) 95.8 (92.2–97.8) 97.1 (93.8–98.7)
Abbreviations: CI, confidence interval; VCA, viral capsid antigen; EBNA, Epstein-Barr virus nuclear antigen.
Platelia assays for VCA IgM and VCA IgG. The percentage of posi- tive agreement for VCA IgM was relatively low when comparing the Liaison and Platelia assays and the Architect and Platelia assays, because the Platelia assay had a lower VCA IgM positiv- ity rate than the other assays as well as because of the overall low prevalence of VCA IgM-positive samples.
DISCUSSION
We evaluated the diagnostic performance of the Architect CMIA, Liaison CLIA, and Platelia ELISA EBV assays (VCA IgM, VCA IgG, and EBNA IgG antibodies) using an EBV performance panel as a reference. The EBV performance panel results indicated that the three EBV antibody assays showed excellent agreement for VCA IgM and EBNA IgG; however, the assays exhibited poorer VCA IgG detection than the performance panel. Although only a few VCA IgM-positive panel samples tested negative using the three antibody assays, false negative results could affect correct EBV infection diagnosis in patients with suspected EBV infec- tion. Kappa agreement and sensitivity were significantly affected because of the limited number of VCA IgM-positive samples in the EBV performance panel. The bias of the performance panel towards more VCA IgM-negative and VCA IgG-positive and EBNA IgG-positive panel members could have caused different agree- ment results. One EBNA IgG-positive panel sample tested nega- tive using the Liaison and Platelia assays.
This panel sample had a past infection status, and the test re- sult was close to the cut-off value based on the EBV performance panel data sheet (Liaison, 33.15 U/mL; Platelia, 1.4 ISR). For VCA IgG, the Architect and Liaison assays showed positive re- sults for two and three VCA IgG-negative panel members, re- spectively. In contrast, the Platelia assay demonstrated negative results for three VCA IgG-positive panel samples. This was likely due to differences in detection sensitivity between the assay meth- ods used in the Architect and Liaison assays (CLIA vs ELISA).
As the Architect and Liaison assays showed more differences in their test results than the Platelia assay compared with the performance panel, the kappa agreement and specificity of the Architect and Liaison assays were affected more than those of the Platelia assay. The percentages of total agreement were 90.5%, 85.7%, and 85.7% between the EBV performance panel and the Architect, Liaison, and Platelia assays, respectively. How- ever, false-positive and false-negative results have different im- portance in the field of infection diagnosis; Platelia assay false- negative cases represented the possibility of missed EBV infec- tion diagnosis. We hypothesize that the performance panel had
included more VCA IgM-positive and VCA IgG-negative samples, we would have seen excellent agreement and comparable sen- sitivity and specificity for the three EBV antibody assays.
When we compared the EBV DNA and VCA IgM antibody re- sults, we detected significantly higher positivity rates for the EBV DNA test. The EBV DNA detection method has a higher sensi- tivity than serological antibody detection methods and EBV DNA can be detected even without EBV infection, as once infected with EBV, the virus might be latently present in B lymphocytes [8]. Over 80% of clinical samples that tested negative for EBV infection using the antibody assays exhibited EBV DNA positiv- ity. These samples were possibly collected during early infection stages (prior to VCA IgM formation); DNA positivity could also be due to EBV latency in B lymphocytes. In addition, EBV DNA detection can fail at times, despite current EBV infection, be- cause of Herpesviridae latency in molecular testing [8]. This could explain the VCA IgM positivity and EBV DNA negativity in a number of samples in our study. An evaluation of the diagnos- tic performance of the EBV DNA test and EBV antibody assays alone or in combination based on the clinical diagnosis of 279 patients indicated that the performance of the VCA IgM and EBV DNA combination was superior to that of the Architect or Liaison assay alone. Although most EBV DNA-negative samples were also VCA IgM negative and EBV DNA was detected in VCA IgM positive samples, the EBV DNA and antibody tests did not always show the same results. Therefore, EBV DNA and anti- body assays should be used complementarily to diagnose the EBV infection status of patients.
The Architect and Liaison assays showed excellent agreement for VCA IgM, VCA IgG, and EBNA IgG. The Platelia assay showed more negative test results for VCA IgM- and VCA IgG-positive panel samples than the Architect and Liaison assays. This dif- ference in sensitivity between the Platelia and the Architect and Liaison assays is most likely due to the fact that the Platelia as- say uses ELISA, while the Architect and Liaison assays use CMIA and CLIA (with fully-automated analyzers), respectively. How- ever, all kappa coefficients were >0.40; thus, the three EBV as- says were considered to have fair and excellent agreement. The agreements between the different EBV antibody assays were comparable with the results of other studies [9-15, 17].
Our study has several limitations. First, the EBV performance panel and clinical samples were not tested with the IFA method, which is considered the gold standard for VCA IgG and EBNA IgG detection. However, excellent sensitivity and specificity have been reported for chemiluminescent EBV antibody detection assays [12]. In addition, we used a commercial mixed perfor-
mance panel consisting of various samples of EBV infection sta- tus to evaluate the diagnostic performance of the EBV antibody assays. The standard performance panel, which has been vali- dated with several widely used EBV antibody assays and known EBV infection status, is a valuable evaluation tool for EBV anti- body detection assays. Second, the study included only a few VCA IgM positive clinical and performance panel samples. There- fore, evaluating the accuracy of positive results for the VCA IgM assays was difficult and the agreement values between the dif- ferent assays were likely affected. As EBV infection mostly oc- curs during childhood and adolescence and young patients typ- ically do not show severe symptoms, the number of samples with new infection status was limited. Finally, we did not com- pare the EBV DNA test with the performance panel because of insufficient material. This may help explain the discrepancies in test results between the EBV DNA and antibody tests. Future studies including a sufficient number of samples with validated EBV infection status should be conducted to address this dis- crepancy and to accurately evaluate the diagnostic performance of the EBV assays.
Despite these limitations, to the best of our knowledge, this is the first study to evaluate the diagnostic performance of the Ar- chitect, Liaison, and Platelia EBV antibody assays using a stan- dard performance panel. The diagnostic performances of the three EBV antibody assays using a combination of VCA IgM, VCA IgG, and EBNA IgG antibodies were acceptable. In addition, the three EBV antibody assays showed good agreement for the clini- cal samples. A combination of the EBV DNA and VCA IgM anti- body tests would provide better diagnostic performance for pa- tients with suspected EBV infection.
Authors’ Disclosures of Potential Conflicts of Interest
No potential conflicts of interest relevant to this article were re- ported.
Acknowledgment
The authors wish to thank Abbott Diagnostics (Wiesbaden, Ger- many) that provided the reagent kits for Architect CMIA serologi- cal analysis free of charge. This research received no specific grant from any funding agency in the public, commercial, or not-for-profit sectors.
REFERENCES
1. Henle G, Henle W, Diehl V. Relation of Burkitt’s tumor-associated her- pes-ytpe virus to infectious mononucleosis. Proc Natl Acad Sci U S A 1968;59:94-101.
2. Balfour HH Jr, Odumade OA, Schmeling DO, Mullan BD, Ed JA, Knight JA, et al. Behavioral, virologic, and immunologic factors associated with acquisition and severity of primary Epstein-Barr virus infection in uni- versity students. J Infect Dis 2013;207:80-8.
3. Gerber P, Walsh JH, Rosenblum EN, Purcell RH. Association of EB-vi- rus infection with the post-perfusion syndrome. Lancet 1969;1:593-5.
4. Alfieri C, Tanner J, Carpentier L, Perpête C, Savoie A, Paradis K, et al.
Epstein-Barr virus transmission from a blood donor to an organ trans- plant recipient with recovery of the same virus strain from the recipient’s blood and oropharynx. Blood 1996;87:812-7.
5. Hanto DW, Frizzera G, Purtilo DT, Sakamoto K, Sullivan JL, Saemund- sen AK, et al. Clinical spectrum of lymphoproliferative disorders in renal transplant recipients and evidence for the role of Epstein-Barr virus. Can- cer Res 1981;41:4253-61.
6. Paya CV, Fung JJ, Nalesnik MA, Kieff E, Green M, Gores G, et al. Ep- stein-Barr virus-induced posttransplant lymphoproliferative disorders.
ASTS/ASTP EBV-PTLD Task Force and The Mayo Clinic Organized In- ternational Consensus Development Meeting. Transplantation 1999;68:
1517-25.
7. Bamoulid J, Courivaud C, Coaquette A, Crepin T, Carron C, Gaiffe E, et al. Late persistent positive EBV viral load and risk of solid cancer in kid- ney transplant patients. Transplantation 2017;101:1473-8.
8. Ambinder RF and Lin L. Mononucleosis in the laboratory. J Infect Dis 2005;192:1503-4.
9. de Ory F, Guisasola ME, Sanz JC, García-Bermejo I. Evaluation of four commercial systems for the diagnosis of Epstein-Barr virus primary in- fections. Clin Vaccine Immunol 2011;18:444-8.
10. Berth M and Bosmans E. Comparison of three automated immunoas- say methods for the determination of Epstein-Barr virus-specific immu- noglobulin M. Clin Vaccine Immunol 2010;17:559-63.
11. Corrales I, Gimenez E, Navarro D. Evaluation of the Architect Epstein- Barr Virus (EBV) viral capsid antigen (VCA) IgG, VCA IgM, and EBV nu- clear antigen 1 IgG chemiluminescent immunoassays for detection of EBV antibodies and categorization of EBV infection status using immu- nofluorescence assays as the reference method. Clin Vaccine Immunol 2014;21:684-8.
12. Grandjean Lapierre S, Vallières E, Rabaamad L, Labrecque M, Char- trand C, Renaud C. Evaluation of the abbot Architect™ Epstein-Barr vi- rus viral capsid antigen IgM, viral capsid antigen IgG and nuclear anti- gen IgG assays in a pediatric and adult population. J Clin Virol 2016;81:
1-5.
13. Lupo J, Germi R, Semenova T, Buisson M, Seigneurin JM, Morand P.
Performance of two commercially available automated immunoassays for the determination of Epstein-Barr virus serological status. Clin Vac- cine Immunol 2012;19:929-34.
14. Sickinger E, Berth M, Vockel A, Braun HB, Oer M, Buenning C. Com- parative evaluation of the new ARCHITECT EBV assays considering dif- ferent testing algorithms. Diagn Microbiol Infect Dis 2014;79:310-6.
15. Guerrero-Ramos A, Patel M, Kadakia K, Haque T. Performance of the architect EBV antibody panel for determination of Epstein-Barr virus in- fection stage in immunocompetent adolescents and young adults with clinical suspicion of infectious mononucleosis. Clin Vaccine Immunol 2014;21:817-23.
16. Klutts JS, Ford BA, Perez NR, Gronowski AM. Evidence-based approach
for interpretation of Epstein-Barr virus serological patterns. J Clin Micro- biol 2009;47:3204-10.
17. Salehi H, Salehi M, Roghanian R, Bozari M, Taleifard S, Salehi MM, et
al. Comparison of serological and molecular test for diagnosis of infec- tious mononucleosis. Adv Biomed Res 2016;5:95.